USDJPY Ready to drop?Hello traders, this is a complete multiple timeframe analysis of this pair. We see could find significant trading opportunities as per analysis upon price action confirmation we may take this trade. Smash the like button if you find value in this analysis and drop a comment if you have any questions or let me know which pair to cover in my next analysis.
Usdjpysignal

#USD/JPY Buy Trade Scenario.Here’s an up-to-date #USD/JPY Buy trade outlook (technical + fundamental) to help you assess whether positioning for a Upside makes sense right now.
Thank You......

USDJPY Risky Short!
HI,Traders !
#USDJPY is surging up again
But is about to enter a wide
Supply area around 157.568
From where a local bearish
Correction is likely to take place !
Comment and subscribe to help us grow !

USD/JPY - High-Stakes Demand Zone Defends the TrendHello Trading Fam! 👋
This USD/JPY daily chart highlights a long-term bullish setup:
Ascending Channel: The pair is trading within a broad upward-sloping channel, indicating an overall bullish trend.
Demand Zone: Price has retraced to a horizontal demand zone (pink box) around the 152.00–153.00 level.
Confluence: This demand zone aligns with the lower trendline of the channel, creating a high-probability area for buyers.
Trade Bias: The analysis suggests looking for long positions (buys) as the price attempts to bounce from this structural support.
Don’t forget to like and share your thoughts in the comments! ❤️

USDJPY 4H Bearish Breakdown – Trendline Rejection Targets 151.50Price broke below the ascending trendline.
Strong rejection from the 154.00 supply / support-turned-resistance zone.
Lower highs forming → short-term bearish structure confirmed.
Price currently consolidating around 152.90 – 153.10.
🔻 Bearish Scenario (Primary Bias)
As long as price remains below 154.00 – 154.30, downside pressure remains dominant.
Targets:
🎯 152.25 (minor intraday support)
🎯 151.50 – 151.70 (major support zone)
A continuation toward the lower boundary of the larger channel is likely if sellers maintain momentum.
🔴 Invalidation Level:
A strong 4H close above 154.30 would weaken the bearish bias.
Break and hold above that level may trigger a short squeeze toward 155.00 – 155.50.
📌 Conclusion:
The market has shifted from bullish recovery into a corrective bearish phase after trendline breakdown and supply rejection. Sellers are in control below 154.00, targeting deeper liquidity levels near 152.25 and possibly 151.50.

USDJPY: 1500+ Pips Selling Opportunity, Comment Your Views?Dear Traders,
We hope you’re doing well. We’ve identified a fantastic selling opportunity in the USDJPY pair. We anticipate a drop in the DXY and increased influence for the JPY in the market. We need confirmation within a shorter timeframe. The intraday timeframe is ideal for entering or executing any potential trades. Set a stop loss above the recent daily high and target a profit of 1500+ pips from your entry point.
If you like our idea, please like and comment below. Also, follow us to receive the latest updates.
Team Setupsfx_

BUY USDJPY now...USDJPY has been in a clear uptrend for the last few weeks but recently dropped a slight bit in the last 24 hours down to a powerful support level! It is currently held by strong support levels which means it is extremely likely to keep heading to the upside for much longer. The next target will be the fibonacci extension zone which is shown on the chart. USDJPY has struggled to break below support but has constantly been breaking through resistance levels. time to BUY USDJPY NOW.

USDJPYUSDJPY
- Completed " 12345 " Impulsive Waves
- Fibonacci Level - 78.60
- Break of Structure
- RSI - Divergence
- Bullish Channel as an corrective pattern in Short Time Frame

USDJPY drop to orderblock ?USDJPY forming multiple head and shoulder price contined it's down trend with series lower high and lower low.
As with recent downtrend with usdjpy started a new directional bisa which could continue to drop to orderblcok or further lower.
A sell entry on price action confirmation is high probability

USD/JPY Bullish Recovery from Major Support Toward 159 Target🔄 Recent Price Action
Strong impulsive drop from the channel top = liquidity sweep + stop hunt.
Price reacted perfectly from the major support zone (152.5–153.0).
A clear Higher Low is formed → bullish structure preserved.
Current price (~155.9) is retracing upward with healthy momentum.
🟡 Key Levels
Support
152.5–153.0: Major demand + structure support
154.5–155.0: Minor intraday support (pullback zone)
Resistance
157.5–158.0: Short-term resistance
158.8–159.2: Major resistance & marked Target zone
161.5–162.0: Higher timeframe resistance
🎯 Projection / Bias
Bullish Scenario (Preferred)
Hold above 154.5
Break & close above 157.5
Continuation toward 158.8–159.2 (Target)
Bearish Scenario (Invalidation)
Failure to hold 154.0
Breakdown below 152.5
Would indicate deeper correction toward 150.0

USDJPY Trading Strategy – February 6, 2026This morning’s trading range suggests that the market remains cautious between a potential recovery and a corrective move driven by profit-taking. However, the latest signals on the H1 timeframe indicate that profit-taking within the prevailing uptrend of USDJPY is inevitable toward the end of the week.
As a result, a short position is established around the H1 EMA zone at 156.70–156.80, with both take-profit and stop-loss set at ±30 pips from the entry level

USDJPY: Two areas to sell, which one has more potential? Dear traders,
This week has been incredibly volatile and uncertainty has likely led many traders to lose their entire capital. Here’s our view on the USDJPY in a smaller timeframe. There are two promising areas for sellers. The first shows strong price resistance, while the second suggests a potential move towards the second entry point. This could happen if the price fills the liquidity void, leading to a drop from that point. Consider setting a target at 150 or 148 and a stop-loss that aligns with your risk management.
Good luck and trade safely. If you enjoy our work, please like and comment for more. Also, follow us for regular updates.
Team Setupsfx_

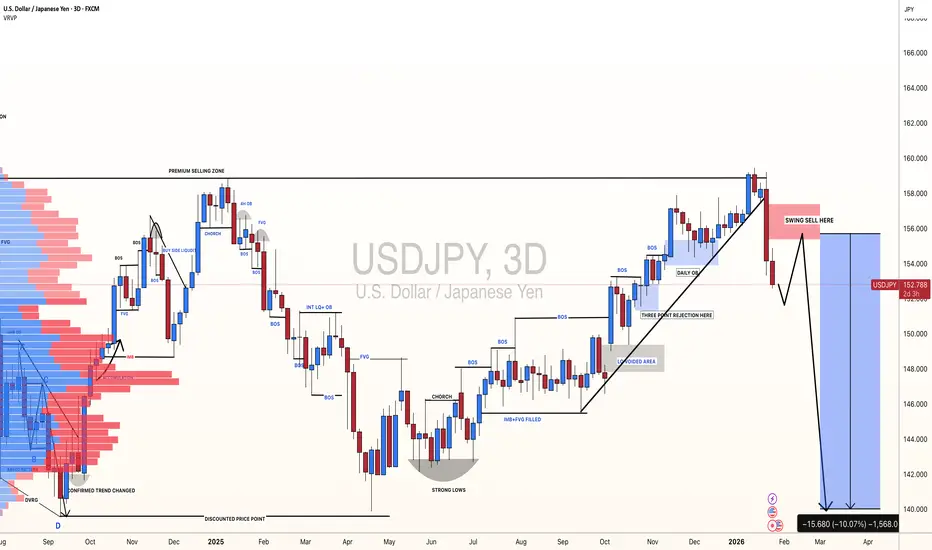
USDJPY: +1500 Pips Possible Swing Sell In Making?Dear Traders,
I hope you’re doing well. We have a fantastic selling opportunity that we believe could drop as much as 1500 pips. In our view, the US dollar is likely to continue plummeting while the Japanese yen might finally turn bullish after nearly a year of selling. This follows the US invasion of Venezuela and potential strict tariff changes in the coming days, all of which will significantly impact the USD. Furthermore, we have some important news this week that will likely shape our chart analysis.
If you enjoy our work, please like and comment. Follow us to receive notifications when we post analysis.
Team Setupsfx_
USD/JPY Price Outlook – Trade Setup (Bullish)📊 Technical Structure
FX:USDJPY USD/JPY rebounded strongly after defending the 155.70–155.90 support zone, forming a clear base and a sequence of higher lows. Price has reclaimed the 156.40 area and is now consolidating above former demand, suggesting a bullish continuation structure rather than a reversal.
As long as price holds above the key support, the technical bias remains tilted to the upside, with the next objective aligned toward the 157.40–157.60 resistance zone.
🎯 Trade Setup (Long)
Entry (Buy Zone): 155.70 – 155.90
Stop Loss: 155.55
Take Profit 1: 157.40
Take Profit 2: 157.60
Risk–Reward Ratio: ~1 : 3.37
📌 Invalidation:
A sustained break and close below 155.55 would invalidate the bullish setup.
🌍 Macro Background
Despite broader US Dollar softness driven by expectations of further Fed easing, the Japanese Yen continues to underperform. Fiscal concerns, political uncertainty, and limited near-term policy tightening from the Bank of Japan keep the JPY vulnerable.
In the short term, these factors support USD/JPY stabilization and upside follow-through, especially while technical momentum remains constructive.
🔑 Key Technical Levels
Resistance Zone: 157.40 – 157.60
Support Zone: 155.70 – 155.90
Structure Invalidation: 155.55
📝 Trade Summary
USD/JPY has completed a technical rebound from a major support area and is consolidating above it. The structure favours a buy-on-dip strategy, targeting a continuation move toward the upper resistance zone, provided price remains supported above 155.70.
⚠️ Disclaimer
This analysis is for reference only and does not constitute trading advice. Financial markets involve significant risk; proper risk and position management are essential.

USDJPY Trading Strategy – February 4, 2026USDJPY has posted three consecutive strong bullish days after rebounding from a short-term support zone on the H1 timeframe. Today’s strategy is to continue maintaining a long bias, looking to buy on a pullback toward the H1 EMA zone at 155.65–155.75.
Take-profit and stop-loss levels are set at ±30 pips from the entry price. The pending order is valid until 2:00 PM (Vietnam time).
If triggered, the position will be held until no later than 5:00 PM (Vietnam time), regardless of the outcome.

USDJPYUSDJPY
- Bullish Channel as an corrective pattern in Short Time Frame
- Demand Zone
- RSI - Divergence
- Fibonacci Level - 50.00% / 61.80%
- Completed " 12345 " Impulsive Waves

DeGRAM | USDJPY pullback from the resistance line📊 Technical Analysis
● USD/JPY has reached the upper boundary of a long-term rising channel near 159–160, where price faced repeated rejections from a horizontal resistance line, signaling trend exhaustion.
● The latest sharp bearish impulse broke the short-term rising structure, with price now projecting a corrective move toward former support zones at 152.8 and 151.2.
💡 Fundamental Analysis
● Growing expectations of tighter BoJ policy and periodic intervention risks contrast with fading US yield momentum, increasing downside pressure on USD/JPY.
✨ Summary
● Price is capped at major channel resistance.
● A medium-term pullback toward 152.8–151.2 is favored while below 159–160.
-------------------
Share your opinion in the comments and support the idea with a like. Thanks for your support!

USDJPY – Daily Trading OutlookBased on recent price action, USDJPY continues to maintain a short-term bearish trend, as the pair is currently testing the major weekly support zone around 153. As a result, most lower timeframes from the daily chart downward are showing clear sell signals, particularly when price retraces toward key resistance levels.
Today’s outlook remains consistent with this bearish scenario. Specifically, the EMA resistance zone on the H1 timeframe at 154.4 – 154.6 is considered a critical area to initiate short positions.
Sell zone: 154.4 – 154.6
Stop loss (SL)/Take profit (TP): ±30 pips from entry
If any H1 candle closes above 154.6, the current trading setup will be considered invalid. In that case, all open positions should be closed immediately, and traders should stand aside and wait for a new opportunity.

UsdJpy- Confluence Support Under PressureYesterday, I shared my view on the JPY Index, where I explained that a strong JPY recovery could be the next major move.
The first and most obvious candidate to reflect that shift is USDJPY.
🔎 What the Chart Is Telling Us
After an initial rise from support, USDJPY attempted another push higher, but the overnight spike faded completely — and price is now back into the same support area again.
What makes this level important is the fact that we are sitting on a confluence support, reinforced by:
- a key horizontal support zone
- the rising trendline drawn from mid-December
This is exactly the type of level where the market should react strongly if bulls are still in control.
⚠️ Spike & Fade = Weakness Signal
For me, the fact that USDJPY spiked up and then fully reversed back into support is not bullish.
It’s a clear sign of failed upside acceptance, and it often precedes:
➡️ a breakdown through support
If buyers were truly strong, they wouldn’t allow price to slip back so easily.
📌 Bearish Scenarios & Targets
If this confluence support breaks, the next downside path becomes realistic:
🎯 Shorter-term target: 155.75 (interim support)
🎯 Main support target: 154.50 (major floor inside the broader range)
A move into 154.50 would be fully aligned with the idea of JPY strength building across the board, as discussed in yesterday’s JPY Index post.
✅ Conclusion
USDJPY is sitting at a critical decision zone — but based on the rejection structure, I lean toward:
👉 support breaking, not holding
If price confirms the breakdown, the market could quickly accelerate lower toward 155.75, and potentially 154.50 next. 🚀

USDJPY Water fall?With gap open early USDJPY has managed to create significant trend change and we may see continued drop in this market. More in depth analysis here in the video

#USD/JPY Buy Trade Scenario.Here’s an up-to-date USD/JPY Buy trade outlook (technical + fundamental) to help you assess whether positioning for a Upside makes sense right now.
Thank You......

USDJPY and AUDUSD Analysis todayHello traders, this is a complete multiple timeframe analysis of this pair. We see could find significant trading opportunities as per analysis upon price action confirmation we may take this trade. Smash the like button if you find value in this analysis and drop a comment if you have any questions or let me know which pair to cover in my next analysis.

#USDJPY: Massive Swing Buy,Our First Two Entries Are ActiveDear Traders,
Our three swing entries are active and going good meanwhile we have found another opportunity which can take price to another record high. We expect JPY to drop in coming days or week and DXY to remain stronger against the JPY. There is one entry zone and two take profits, use proper risk management while trading.
If you like our then consider liking and commenting on our trading ideas.
Good luck and trade safe!
Team Setupsfx_
