USD/JPY Price Outlook – Trade Setup📊 Technical Structure
FX:USDJPY USD/JPY is trading near a two-week high, supported by a steady uptrend line. Price is currently consolidating just below the resistance zone (153.23 – 153.30), with support holding at 152.80 – 152.90. The bullish bias remains intact as long as the uptrend line is respected.
📌 Trade Setup
Entry: 152.90 – 152.81 (pullback to support/uptrend line)
Stop Loss: 152.79 (below support)
Take Profit: 153.30 (resistance zone)
Risk–Reward (R:R): ≈ 1 : 4.44
🌍 Macro Background
The Japanese Yen remains under pressure as fiscal concerns dominate sentiment, with new Prime Minister Sanae Takaichi expected to continue expansionary spending policies, limiting the scope for rapid monetary tightening. While Japan’s Services PPI rose to 3.0%, bolstering the case for a future BoJ rate hike, it has failed to lift the Yen significantly.
Meanwhile, US CPI data (0.3% MoM, 3% YoY) has reinforced bets for a Fed rate cut this week, followed by another in December. This divergence between the Fed’s dovish stance and the BoJ’s cautious tightening outlook adds to market uncertainty. Traders are likely to remain cautious ahead of the Fed decision on Wednesday and the BoJ meeting on Thursday, making these central bank events critical for the next major move.
🔑 Key Technical Levels
Resistance: 153.23 / 153.30
Support: 152.80 / 152.75
Trendline Support: 152.90
Upside Extension (if breakout): 153.50 – 153.60
📋 Trade Summary
USD/JPY maintains a bullish bias as long as the pair holds above 152.80 support. A pullback entry near 152.90 offers a favourable risk–reward setup toward 153.30. However, traders should be prepared for heightened volatility around the Fed and BoJ policy announcements later this week.
⚠️ Disclaimer
This analysis is for reference only and does not constitute trading advice. Trading involves significant risk, and proper risk management is essential.
Usdjpysignal

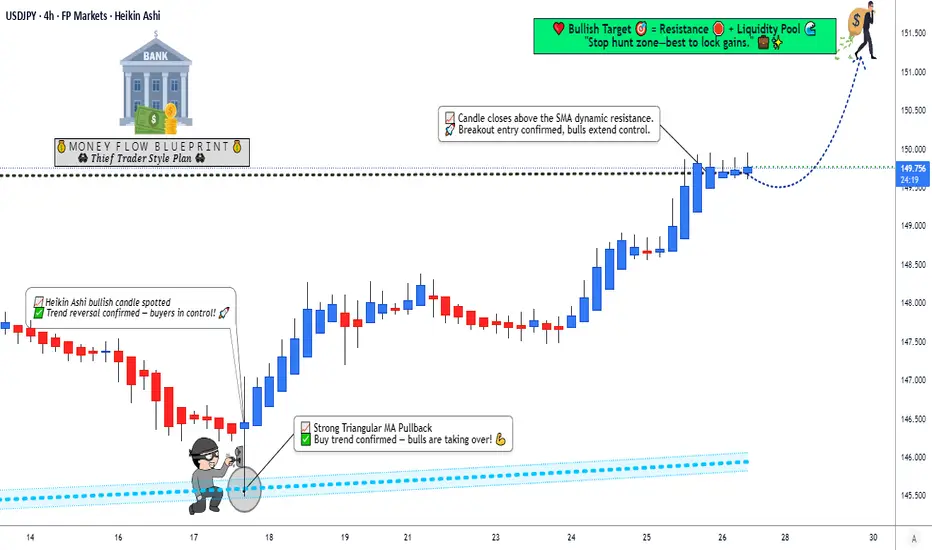
USD/JPY Bulls on the Move! Key Resistance Levels in Focus📈 USD/JPY "The Gopher" 🐹 — Forex Market Wealth Strategy Map (Swing/Day Trade)
Plan (Bullish Setup):
We’ve got a thief’s map unfolding here 👀. Confirmation builds as:
✅ Heikin Ashi Doji turning bullish
✅ Triangular Moving Average pullback
✅ Simple Moving Average breakout (dynamic resistance cleared!)
That’s our green light 🚦 for a potential bullish swing.
Entry (Layering Strategy 🧩):
The Thief Strategy = multiple limit orders, layered in style 🎭.
Buy limit layers: 149.000, 149.300, 149.600
(You can scale in further if price plays around your zone 📊)
This approach lets us sneak in like pros instead of going “all-in” at once 🔑.
Stop Loss (Risk Escape Hatch 🔓):
📍 Thief SL: 148.000
⚠️ Note: Dear Ladies & Gentlemen (Thief OG’s) — this is not a fixed rule. Manage your own risk wisely. You make money 💵, you take money 💼.
Target 🎯:
Resistance zone + overbought levels = possible trap.
Our escape target: 151.300 🏁
⚠️ Again — this is optional. Lock in profits where you feel comfortable.
🔍 Related FX Pairs to Watch:
OANDA:EURJPY — Often moves in tandem with JPY crosses.
OANDA:GBPJPY — A more volatile cousin, sometimes leading signals.
TVC:DXY (US Dollar Index) — Strength here adds weight to USD/JPY bullish bias.
OANDA:CHFJPY — Another JPY cross that can highlight safe-haven flows.
Correlation check keeps us one step ahead 🕵️.
✨ “If you find value in my analysis, a 👍 and 🚀 boost is much appreciated — it helps me share more setups with the community!”
⚠️ Disclaimer: This is a Thief Style Trading Strategy — shared for educational & entertainment purposes only. Not financial advice. Trade safe!
#USDJPY #Forex #SwingTrade #DayTrading #LayeringStrategy #TradingPlan #ThiefTrader #JPY #DXY #ForexStrategy
USDJPY Holds Firm Above 151, Dollar Strength Faces Yen’s Haven USDJPY has surged to fresh highs above 153 before pulling back, showing how stretched the pair has become after weeks of relentless dollar strength. The dollar continues to benefit from sticky US inflation and hawkish Fed expectations, but the yen is finding some defensive flows as Japanese politics and global risk aversion come into play. This leaves USDJPY in a pivotal zone: either buyers defend the 151 handle for another push higher, or yen resilience drags the pair into a deeper correction.
Current Bias
Bullish – Despite the pullback, the trend remains tilted toward further USD strength as long as price stays above 151.00.
Key Fundamental Drivers
US Dollar (USD): Firm inflation, resilient labor data, and higher Treasury yields keep the dollar bid. The Fed is signaling patience before cutting, supporting front-end yield spreads in favor of the USD.
Japanese Yen (JPY): BOJ remains ultra-loose, but rising domestic political pressure and stronger wages are fueling speculation that policy normalization could come earlier than expected.
Risk Sentiment: JPY gains when equities wobble, while USD stays supported by yield and safe-haven flows.
Macro Context
Interest Rates: Fed is cautious about cutting, while BOJ is still holding rates near zero. The divergence remains a powerful driver of USDJPY.
Economic Growth: US growth has outpaced expectations, while Japan shows modest recovery but still depends heavily on exports.
Geopolitical Themes: US–China tariffs, Middle East risks, and Japanese election speculation all tilt in favor of JPY demand on risk-off days, but USD retains the upper hand when markets stabilize.
Primary Risk to the Trend
A sharp shift in BOJ guidance or surprise yen-supportive intervention could trigger a rapid unwind in USDJPY longs.
Most Critical Upcoming News/Event
US CPI data – any upside surprise could cement Fed caution and push USDJPY back to highs.
BOJ commentary – signals of policy adjustment would likely strengthen the yen.
Leader/Lagger Dynamics
USDJPY is a leader in yen pairs, often setting direction for EURJPY, GBPJPY, and CADJPY. It also acts as a barometer for global risk sentiment, with USDJPY strength often reflecting broad dollar dominance.
Key Levels
Support Levels:
151.50
149.95
Resistance Levels:
153.15
154.00
Stop Loss (SL): 148.40
Take Profit (TP): 153.15
Summary: Bias and Watchpoints
USDJPY remains bullish above 151.00, with a stop placed at 148.40 to guard against deeper corrections. A take-profit zone near 153.15 aligns with the recent rejection point. The key watchpoints are US inflation data and BOJ communication, both of which could determine if this move extends higher or stalls. For now, USDJPY remains the dominant driver of yen flows, keeping its role as a leader among JPY crosses.

USD/JPY Breakout & Retest Buy Setup — Bullish Momentum Building Pair: USD/JPY
Timeframe: M30
Pattern: Falling Channel (Breakout Setup)
Directional Bias: Bullish (Buy Setup)
---
🔍 Technical Analysis
1. Descending Channel:
The price has been moving within a falling channel (marked in blue).
Recently, it broke above the upper trendline — a strong signal of trend reversal from bearish to bullish.
2. Retest Zone (Entry Zone):
The highlighted blue box near 149.817 – 149.333 represents a retest or demand zone.
After breakout, price often returns to this zone to gather liquidity before pushing upward.
This is an ideal entry point for buyers.
3. Structure Formation:
The “W” pattern shown indicates potential double-bottom support confirmation.
That suggests buying pressure building in the zone.
4. Momentum & Trend Shift:
Breakout candle shows strong bullish momentum with solid volume (price closing above the channel).
If price sustains above 149.817 after retest, expect continuation toward next resistance levels.
---
🎯 Trade Plan
Parameter Level Notes
Entry Point 149.817 – 149.600 Wait for bullish confirmation at retest
Stop Loss 149.333 Below the demand zone and structural low
Target Point (TP) 151.130 Based on previous structure resistance
Risk-Reward Ratio (RRR) ≈ 1:3 Strong setup for intraday swing
---
⚙ Confirmation Signals to Watch
Bullish engulfing or pin bar candle at entry zone ✅
RSI > 50 or MACD bullish crossover ✅
Rejection wicks forming at support ✅
---
📈 Summary
This chart shows a bullish breakout with a planned retest, making it a high-probability buy setup.
If price retests the 149.8–149.3 zone and shows bullish confirmation, entry is valid with a target near 151.1.
Keep stops tight and monitor for rejection candles near the entry zone.

USD/JPY BEARISH CHANNEL TOWARDS KEY 150.00 SUPPORT ZONE🔍 Chart Overview:
The USD/JPY pair is currently trading within a clear descending channel, indicating sustained bearish momentum. The price action has formed consistent lower highs and lower lows, respecting both the upper resistance and lower support boundaries of the channel.
📊 Key Technical Observations:
Range Formation:
Initially, the pair moved sideways in a consolidation range before breaking structure to the downside — marking the transition from accumulation to distribution.
CHoCH (Change of Character):
The CHoCH confirms a shift in market sentiment from bullish to bearish, validating the start of the current downtrend.
Resistance Rejection:
Price recently rejected from the channel resistance area around 152.10 – 152.50, showing seller dominance and continuation of bearish control.
Current Price Action:
The pair is now approaching the lower boundary of the bearish channel near 150.00, a strong psychological and technical support zone.
📉 Projection:
The forecast on the chart suggests a potential minor pullback toward 150.70 – 151.00 before resuming its downward move toward 150.00 support.
A clean break below 150.00 could extend the decline toward 149.50 or even lower.
However, if 150.00 holds, we could see a short-term bullish correction back to mid-channel levels.
⚙️ Trading Outlook:
Bias: Bearish continuation within channel
Resistance Zone: 151.10 – 151.50
Support Zone: 150.00 (key psychological level)
Next Targets:
✅ First target: 150.00
⚠️ Second target (if breakdown): 149.50

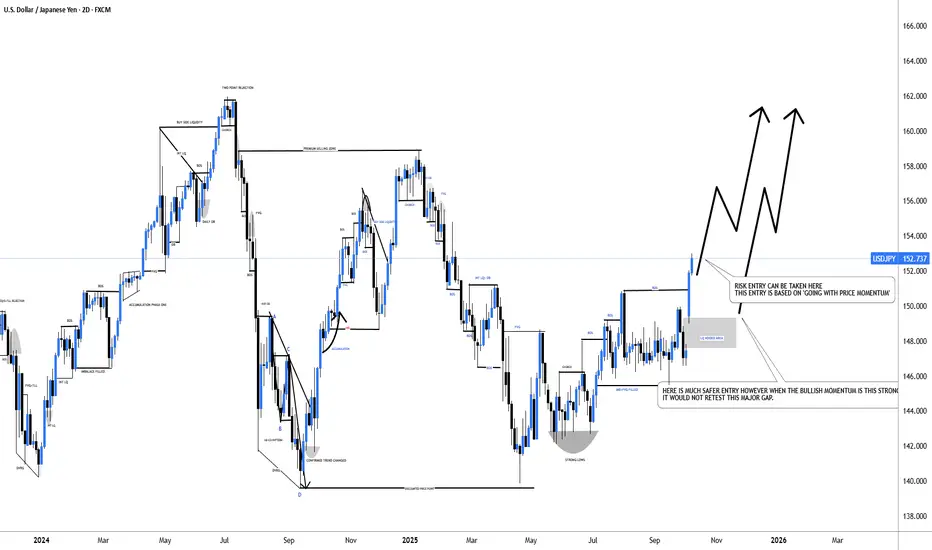
#USDJPY: From +1100 Pips To +1350 Pips A Possible Swing BuyDear Traders,
I hope you’re all having a great trading week!
The USDJPY is currently trading in a 152 price range and is experiencing extreme bullish momentum. The price is rallying without making any corrections, primarily due to the collapse of the Yen. We may see it fall further below. Given this market condition, it’s much riskier to trade with USDJPY.
Here are two approaches you may consider:
1. Take the entry at the current trading price with an accurate stop loss while using a smaller timeframe.
2. Wait for the price to return to the liquidity gap area, where it’s expected to fill.
Good luck, and thank you for your support throughout.
We appreciate your support.
Team Setupsfx_
USDJPY approaching a huge gap levelUSDJPY with it's continued down trend, price is approaching a huge gap level with massive FVG/imbalance. As with today's gap open DXY on continued down trend has created a momentum for the market to remain bearish which has given USDJPY to continue to remain bearish. As the market is approaching a gap that has not been tested in the past, it is high probable USDJPY to remain bearish at its lower and higher timeframe trend.

USDJPY TESTING SUPPORT POSSIBLE REBOUND BEFORE BEARISH BREAKDOWNOverall Market Context
The pair USD/JPY is currently trading around 152.25, showing some consolidation after a previous bullish move.
The chart is labeled with key areas such as Support Zones, an Upward Channel, and a Range period, indicating a mixed structure between bullish and corrective phases.
📈 Technical Analysis
1. Trend Structure
The chart shows a clear upward channel, suggesting a longer-term bullish trend.
However, price is currently testing the lower boundary of that channel, which often acts as a critical support line.
If this lower trendline fails, it could trigger a correction or reversal.
2. Key Levels
Immediate Resistance: Around 152.80 – 153.00
This aligns with the previous highs and upper channel limit.
Immediate Support: Around 152.20 → 151.59
Price is hovering near this region now — a break below 151.59 may signal weakness.

USD/JPY Price Outlook – Trade Setup📊 Technical Structure
FOREXCOM:USDJPY USD/JPY is trading near 151.70, consolidating after recent declines. The chart highlights a resistance zone at 152.28–152.39 and a support zone at 151.05–151.18. A short-term rebound toward resistance is possible, but failure at the resistance zone could trigger a downside move back to support. A break below 151.05 would open the door to deeper losses.
🎯 Trade Setup
Entry: 152.28–152.39 (sell near resistance)
Stop Loss: 152.50
Take Profit 1: 151.40
Take Profit 2: 151.18
Take Profit 3: 151.05
Risk/Reward (R:R): ~1 : 4.96
🗝️ Key Technical Levels
Support Zone: 151.05–151.18
Resistance Zone: 152.28–152.39
Trendline Resistance: Downtrend from October highs
🌍 Macro Background
The Japanese Yen gained modest support after Finance Minister Katsunobu Kato warned of one-sided FX moves, fueling speculation of possible intervention. Expectations that the Bank of Japan may raise rates later this year also underpin the yen. However, political uncertainty following the LDP–Komeito coalition breakup and the pending confirmation of Sanae Takaichi as Japan’s first female Prime Minister adds risks, possibly slowing BoJ’s tightening.
On the US side, Trump softened his tariff stance after previously threatening 100% tariffs on Chinese imports effective November 1, easing trade-war fears and supporting risk appetite. The US Dollar remains firm near recent highs, but dovish Fed rate cut expectations (25 bps in October and December, with 97% and 90% odds respectively) limit further upside. Meanwhile, the US government shutdown has dragged into a third week, delaying key economic data releases. The market focus is now on Fed Chair Powell’s speech, which could provide the next directional driver.
📌 Trade Summary
USD/JPY is capped by 152.39 resistance. Short positions near this zone could offer favourable setups, targeting 151.17–151.05 support levels. A clear break above 152.55 would invalidate the bearish outlook.
⚠️ Disclaimer
This analysis is for reference only and does not constitute trading advice. Trading involves significant risk, and proper risk management is essential.

USD/JPY) Bearish Trend analysis Read The captionSMC Trading point update
Technical analysis of USD/JPY (1H) chart shows a bearish SMC (Smart Money Concept) setup — here’s the idea breakdown
---
Trade Idea: Bearish Setup — USD/JPY
Market Context
Price has been in a strong bullish trend, reaching a local high near 152.35.
Recently, the price broke structure to the downside, signaling potential shift from bullish to bearish order flow.
---
Key Technical Points
1. FVG (Fair Value Gap) Break
The chart marks an FVG break zone around 152.30–152.45.
This zone acts as a premium re-entry area where institutional traders may rebalance orders before pushing price lower.
2. Rejection Zone (Supply Area)
Price is currently retracing back into the FVG zone, forming potential lower-high structure.
Expect rejection confirmation (bearish candle / liquidity sweep) before continuation down.
3. Bearish Continuation Expectation
After the retest, price is projected to drop toward the lower demand zone / target point around 150.25.
That area aligns with previous demand / liquidity pool, a likely point for profit-taking or reversal.
---
Trade Plan
Entry: Wait for bearish rejection or liquidity sweep inside the 152.30–152.45 zone.
Stop Loss: Above 152.50 (above FVG high).
Take Profit: Around 150.25 target zone (major demand area).
Mr SMC Trading point
---
Market Logic
The structure shows:
Break of structure (BOS) confirming bearish shift.
Fair Value Gap retest for premium entry.
Liquidity targeting at the lower demand zone.
This setup follows institutional flow — sell after retracement, target imbalance fill.
---
Please support boost 🚀 this analysis

USD/JPY Swing Setup ⁝ Why Thief Layer Strategy Wins Here📊 Asset: USD/JPY — "The Ninja" Forex Bank Heist Plan (Swing/Day Trade)
🎯 USD/JPY Quick Snapshot
🔸 Daily Change: +0.39% (↑)
🔸 52-Week Range: 139.57 - 158.89
📊 Retail & Institutional Sentiment
🔹 Retail Traders: Bearish (60%) – Caution due to political uncertainty in Japan.
🔹 Institutional Traders: Bullish (70%) – Expect USD strength amid BOJ-Fed policy divergence.
🔹 Fear & Greed Index: 62/100 (Greed) – Moderate risk appetite favoring USD.
🔍 Fundamental & Macro Score
🏦 BOJ Policy Outlook:
• Rate hike uncertainty keeps JPY weak.
• Score: 3/10 (Bearish for JPY) 🐻
💵 Fed Policy Outlook:
• 90% chance of 25bps rate cut in September.
• Score: 7/10 (Bullish for USD) 🐂
🇯🇵 Political Risk (Japan):
• Leadership uncertainty weighs on JPY.
• Score: 4/10 (Negative for JPY) ⚠️
🌐 Trade War Risks:
• US tariff tensions may dampen USD strength.
• Score: 5/10 (Neutral)
🎯 Overall Market Outlook
🟢 Bullish (Long) Score: 65% ✅
🔴 Bearish (Short) Score: 35% ❌
📌 Summary: USD/JPY leans bullish due to BOJ hesitation, Fed cuts, and JPY political risks.
❓ WHY THIS Setup?
🔸 USD/JPY is respecting bullish structure while retail is mostly short → contrarian signal 🚨.
🔸 Institutional flow shows confidence in USD strength vs JPY weakness 📈.
🔸 BOJ hesitation + political instability in Japan continues to suppress JPY demand 🐻.
🔸 Layered entry strategy reduces risk of bad timing + maximizes capture of bullish wave ⚡.
🔸 Key target zone 151.500–152.000 offers strong risk/reward for swing & day traders 🎯.
✅ Thief Trading Plan: Bullish Setup
🔸 Entry (Thief Style Layer Strategy 🪤):
• 147.500
• 148.000
• 148.500
• 149.000
(Increase/adjust layers as per your own strategy.)
🔸 Stop Loss (Thief SL 🔒):
• Base SL @146.000
• Adjust according to risk tolerance & personal strategy
🔸 Target 🎯:
• Trap/reversal zone near 152.000
• Safer exit before reversal @ 151.500
⚡ Strategy Breakdown
🔹 Method: Thief OG Layer Strategy = scaling with multiple limit orders instead of single-entry.
🔹 Benefit: Absorbs noise, builds positions step-by-step, reduces FOMO.
🔹 Bias: Swing/Day trade friendly with bullish momentum in higher zones.
👀 Related Pairs to Watch:
💷 OANDA:GBPJPY
💶 OANDA:EURJPY
🇨🇭 OANDA:CHFJPY
💵 OANDA:USDCHF
✨ “If you find value in my analysis, a 👍 and 🚀 boost is much appreciated — it helps me share more setups with the community!”
#USDJPY #Forex #SwingTrading #DayTrading #JPY #ForexStrategy #TradingPlan #FXThief #LayerStrategy #SmartMoney

USD/JPY Price Outlook – Trade Setup📊 Technical Structure
FX:USDJPY USD/JPY is trading near 152.86, consolidating after touching fresh lows in JPY since February. The pair is holding within a rising channel, with support seen around 152.56–152.68 and resistance at 153.27–153.38. Short-term price action suggests buyers are defending the support zone, keeping the bias upward as long as the channel holds.
🎯 Trade Setup
Entry: 152.57–152.68 (buy on dips)
Stop Loss: 152.51
Take Profit 1: 153.27
Take Profit 2: 153.38
R:R Ratio: ~1 : 4.14
🏦 Macro Background
The Yen continues to face selling pressure amid Japan’s fiscal concerns and expectations that new PM Sanae Takaichi may favor expansive fiscal policies, delaying BoJ’s tightening path. However, sticky inflation above 2% and resilience in the Japanese economy keep speculation alive for another BoJ hike later this year.
Meanwhile, the USD consolidates strong weekly gains, supported by US economic resilience and political risks abroad. The ongoing US government shutdown remains a wildcard, though markets are still pricing in two Fed rate cuts (Oct & Dec 2025), which could eventually cap USD strength.
🔑 Key Technical Levels
Resistance Zone: 153.27 – 153.38
Support Zone: 152.57 – 152.68
Trendline Support: 152.50
📌 Trade Summary
Bias remains bullish above 152.50, with scope for a retest of 153.27–153.38. A breakdown below 152.10 would invalidate the setup and open downside risk.
⚠️ Disclaimer
This analysis is for reference only and does not constitute trading advice. Trading involves significant risk, and proper risk management is essential.

USDJPY Price Accumulated|Time For Bullish Distribution|Setupsfx|The price has accumulated nicely and is now distributing. We have three targets in mind, but set your own based on your analysis. Our approach is purely technical, but also includes a basic fundamental approach. This analysis concludes over 1500 pips and is a swing move. Please use this analysis as educational purposes only, as it does not guarantee that price will move exactly as predicted.
If you like our idea, please consider liking and commenting on it.
Good luck and trade safely!
Team Setupsfx_

DeGRAM | USDJPY in accumulation zone📊 Technical Analysis
● USD/JPY is rebounding from 145.90 support, with price holding inside the ascending channel and confirming higher lows.
● The structure suggests a continuation toward 150.85, with a break above the accumulation zone likely unlocking further upside toward 153.70 resistance.
💡 Fundamental Analysis
● Hawkish Fed signals and persistent U.S. yield strength underpin dollar demand, while Japan’s reluctance for aggressive intervention keeps yen under pressure.
✨ Summary
Bullish above 145.90; targets 150.85 → 153.70. Invalidation on a close below 145.90.
-------------------
Share your opinion in the comments and support the idea with a like. Thanks for your support!

USD/JPY Buy Zone Setup – Targeting 152.54Current Price: 147.190
Buy Entry Zone: ~146.403
Support Zone (Blue Area): 146.403 – 145.183
Stop Loss: Below 145.183
Target Point: 152.547
Technical Breakdown:
Channel Trend:
The pair is moving inside an upward-sloping channel.
Price is currently in a pullback phase, approaching the lower-mid part of the channel.
Support Zone:
Strong support at 146.40 – 145.18 (marked as the blue buy zone).
Buyers are expected to step in here if tested.
Bullish Scenario:
If price respects the support and bounces, we could see a rally toward 152.547 (target).
This aligns with the upper boundary of the ascending channel.
Bearish Risk:
If price breaks 145.18 with strong volume, bearish momentum could extend, invalidating the long setup.
Next downside risk would open toward 144.00.
Trading Plan (Based on Chart Idea):
Buy Entry: Around 146.40 – 145.80 zone.
Stop Loss: Below 145.18.
Take Profit (TP): 152.54.
Risk/Reward Ratio: Approx 1:4+, which is a strong setup.
📌 This chart is suggesting a buy-the-dip strategy at support for a potential bullish continuation.

USD/JPY) Bearish Trend analysis Read The captionSMC Trading point update
Technical analysis of USD/JPY (1H timeframe) chart analysis:
---
Bearish USD/JPY Setup
Rejection at Resistance: Multiple rejections (red arrows) show strong selling pressure around 149.70 – 149.80 zone.
Fair Value Gap (FVG): Price may retest the FVG supply area before continuing lower.
Moving Averages:
50 EMA (red) is turning flat, showing short-term weakness.
200 EMA (blue) is below, acting as the larger support zone.
Market Structure Shift (MSS): Breakdown of recent support suggests bearish intent.
---
Target Point
Expected drop towards 148.38 – 148.37 (aligned with 200 EMA & previous demand zone).
Mr SMC Trading point
---
Trading Idea
Bias: Bearish.
Entry Zone: Retest of 149.60 – 149.70 (FVG).
Target: 148.38.
Invalidation: A break above 150.00 would invalidate the bearish outlook.
Please support boost 🚀 this analysis

USDJPY possible bullish for 150.45#usdjpy price broke and close above the 149.14 which is the resistance level of the current month (September). price moving down due to profit taking. 147.80-50 daily demand zone level for another leg higher. split risk equally into two positions i.e. 147.78 & 147.50 with stop loss: 147.30 and target: 150.45.

USD/JPY 1-Hour Candlestick Chart
Entry Point: ≈149.394
This is set just below the current price and near the lower boundary of the recent consolidation/support zone. The anticipation is that the price will dip slightly to this level before reversing up.
Stop Loss (SL): ≈149.068
The stop loss is placed below a recent swing low or potential support level. This represents the point where the bullish thesis is invalidated.
Risk: The risk on this trade is the distance between the entry point and the stop loss: 149.394−149.068=0.326 pips.
Target Point (Take Profit - TP): ≈150.917
This is a significant distance above the current price and the recent highs. It is likely targeting a prior high or a psychological level like 151.000 (though the target is slightly below it).
Reward: The potential reward is the distance between the target point and the entry point: 150.917−149.394=1.523 pips.
Risk/Reward Ratio (RRR):
The RRR is calculated as Reward / Risk:
RRR=
0.326
1.523
≈4.67
A Risk/Reward Ratio of ≈4.67:1 is excellent. This means that for every 1 unit of risk, you are aiming for over 4.5 units of profit. A high RRR is a key characteristic of a favorable trade setup.
Potential Scenarios & Considerations:
Bullish Confirmation (Trade Works): The price follows the projected path (the small red line with an arrow), touches the entry point, finds strong support there, and reverses sharply upward to eventually hit the 150.917 target.
Trade Fails:
The price breaks convincingly below the stop loss at 149.068. This would indicate a failure of the support level and a likely continuation of the downtrend/retracement, invalidating the buy setup.
The price moves up and reaches the target without dipping to the entry point (missing the entry).
Trader Action Summary
The setup suggests a Limit Buy order to be placed at 149.394, anticipating a final dip before the rally.
Action: Limit Buy at 149.394
Contingency: A break below 149.068 indicates a stronger selling momentum, and the trade should be exited (Stop Loss triggered).
Goal: Targeting a significant extension of the recent upward trend

USDJPY Analysis todayHello traders, this is a complete multiple timeframe analysis of this pair. We see could find significant trading opportunities as per analysis upon price action confirmation we may take this trade. Smash the like button if you find value in this analysis and drop a comment if you have any questions or let me know which pair to cover in my next analysis.

USDJPY Will Keep Growing!
HI,Traders !
#USDJPY is trading in an
Uptrend and the price
Made a bullish breakout
Of the key horizontal
Level of 148.876 and the
Breakout is confirmed so
We are bullish biased
And we will be expecting
A further bullish continuation !
Comment and subscribe to help us grow !

USD/JPY Bullish Continuation Setup – Buy from Support (148.000) Price Structure & Trend
Overall Trend: The market has been moving upward since around the 18th, forming higher highs and higher lows inside an ascending channel (shown in red).
Current Position: Price is near the top of the channel, slightly pulling back.
2. Key Levels
Entry Zone: Around 148.000 (highlighted by the gray box).
Stop Loss: Around 147.378 (below the channel and key support).
Take Profit (Target Point): 150.513 (near the next major resistance zone)
3. Trade Idea
This chart seems to suggest a buy (long) setup:
Plan: Wait for price to retest the gray zone (support zone near 148.000).
If price respects this support, go long toward the target zone 150.5.
Risk/Reward Ratio: Very favorable (risk is small compared to potential upside).
4. Confirmation Factors
Ascending Channel: Price is respecting the channel, which is a bullish sign.
Support Zone: 148.000 area has been tested multiple times — likely to act as a strong support.
Momentum: As long as price stays above 147.378, buyers are in control.
5. Bearish Scenario
If price breaks below 147.378, this setup becomes invalid.
It may indicate a channel breakdown and potential trend reversal toward 146.5–146.0.
✅ Summary:
This chart shows a bullish continuation setup on USD/JPY. The trader is likely waiting for a pullback to 148.000 before buying, with a stop below 147.378 and a target near 150.5.

USDJPY set to cross 151.00Hello traders, this is a complete multiple timeframe analysis of this pair. We see could find significant trading opportunities as per analysis upon price action confirmation we may take this trade. Smash the like button if you find value in this analysis and drop a comment if you have any questions or let me know which pair to cover in my next analysis

USD/JPY Bullish Breakout Setup – Targeting 150.30 with Strong RiChart Overview
The chart shows a rising channel (highlighted in red with blue borders).
Price recently broke above the upper boundary of the channel and pulled back.
The trader’s setup marks:
Entry Point: 148.417
Stop Loss: 148.067
Target Point: 150.307
Analysis
Trend Context
Since September 18th, price has been in an uptrend (higher highs, higher lows).
The breakout from the channel suggests continuation to the upside.
Entry Point (148.417)
Positioned slightly below the breakout area, allowing entry on a pullback confirmation.
This reduces the risk of entering at the top of the breakout wick.
Stop Loss (148.067)
Well-placed below recent consolidation and the channel’s midline.
If price breaks below this level, it would signal a potential failed breakout and bearish reversal.
Target Point (150.307)
Target is based on the measured move projection (height of the channel added to breakout level).
This aligns with a strong psychological resistance near 150.30 – 150.50.
Risk-to-Reward Ratio (RRR)
Risk (Entry to SL): ~35 pips
Reward (Entry to TP): ~190 pips
RRR ≈ 1:5.4 → very favorable.
Conclusion
This is a bullish breakout trade setup.
If price respects the pullback and stays above 148.40, continuation toward 150.30 is likely.
Watch out for news/events (like BoJ or US Fed comments) since USD/JPY is highly sensitive to fundamentals.
👉 In short: The setup looks solid with a strong uptrend, clean breakout, and excellent risk-to-reward
