USDJPY potential buy area!USDJPY 4H price has formed 2 important impulse and started to move back to the upside with new series of higher high and higher low showing a potential trend continuation.
Daily price is just crossed above 10ema and may pullback to daily 10ema which is also 4h support an important level where a bullish trade is high probale.
Usdjpysignal

USD/JPY Poised for Breakout as Fundamentals & Technicals AlignUSDJPY is entering a critical juncture where both macroeconomic conditions and price structure are pointing toward a potential bullish continuation. The pair has been consolidating just under a descending trendline after a sharp drop from July’s highs, but strong US fundamentals, a persistently dovish Bank of Japan, and upcoming political catalysts are creating the perfect environment for an upside breakout. If buyers can reclaim momentum above near-term resistance, the path toward retesting multi-month highs appears open, with yen crosses likely to follow the lead.
Technical Analysis (4H Chart)
Price is consolidating around 147.46 after falling from the 150.91 high.
A descending trendline from the late-July peak is being tested. A confirmed breakout would likely accelerate bullish momentum.
Key upside targets:
148.96 – immediate resistance & short-term target (previous swing high).
150.91 – major resistance at July’s high.
Stop-loss at 146.43 safeguards against deeper retracements.
The structure reflects a series of bullish continuation patterns (flags, breakouts, retracements).
Fundamental Analysis
Current Bias: Bullish
USD Strength: Strong US data and anticipation of Trump’s “major” economic announcement are lifting the dollar.
JPY Weakness: Despite better-than-expected Japan Eco Watchers Survey, the BoJ’s ultra-loose stance continues to suppress yen demand.
Rate Differentials: Still heavily in USD’s favor, sustaining upward pressure on USD/JPY.
Risk Sentiment: Even with mild geopolitical tensions, USD’s safe-haven appeal is preventing JPY from benefiting.
Risks:
Disappointing US political announcements.
Hawkish surprises from the BoJ.
Sharp swings in risk sentiment favoring the yen.
Key News/Events Ahead:
Trump’s economic policy reveal.
US CPI & PPI releases.
BoJ policy signals or commentary.
Leader/Lagger Dynamics:
USDJPY is the leader for yen crosses, often setting the tone for GBPJPY, AUDJPY, and CHFJPY.
Summary:
USDJPY’s bullish outlook is reinforced by the combination of favorable fundamentals and a technical setup pointing toward a breakout. A move above 147.80–148.00 could open the door to 148.96 in the short term and 150.91 in the medium term. With yen crosses closely tied to USDJPY’s movements, this pair’s breakout could spark broader JPY weakness across the board, making it a pivotal chart to watch in the days ahead.

USDJPY Looks Bearish, Your thoughts ?USDJPY Looks Bearish, It has been falling hard after touching resistances. Now it will continue to glide. Check your support and resistances and open positions accordingly. Wait for Price Again and strong solid breakouts to enter the market.
Disclaimer:
The content presented in this IMAGE is intended solely for educational and informational purposes. It does not constitute financial, investment, or trading advice.
Trading foreign exchange (Forex) on margin involves a high level of risk and may not be suitable for all investors. The use of leverage can work both for and against you. Before deciding to participate in the Forex market, you should carefully consider your investment objectives, level of experience, and risk tolerance.
There is a possibility that you may incur a loss of some or all of your initial investment, and therefore, you should not invest money that you cannot afford to lose. Be fully aware of all the risks associated with foreign exchange trading, and seek advice from a licensed and independent financial advisor if you have any doubts.
Past performance is not indicative of future results. Always trade responsibly.

USD/JPY Robbery Route | Enter at Dip, Exit Before Police💥USD/JPY Forex Money Heist Plan 🎯 — Ninja Robbery at 146.000💥
🌟 Hi! Hola! Ola! Bonjour! Hallo! Marhaba! 🌟
Dear Market Bandits, Money Makers & Risky Robbers 🤑💰💸✈️
Welcome to another Thief Trader-style operation. We've cracked open the USD/JPY vault (aka "The Gopher" 💹), and here's the blueprint to pull off this forex heist like true professionals. 💼🎭💵
🚨 Strategy Overview
This isn't just a trade – it’s a well-researched, precision-timed robbery mission based on technicals, macro analysis, sentiment, and the bigger global picture.
Expect action near critical zones – especially the moving average barricade, where police (aka risk) is waiting. Stay sharp.
🔓 Entry Point – Unlock the Vault
📈 Watch for bullish pullbacks near 146.000.
Whether it's a dip, zone test, or wick bounce — you’re looking to layer buy limit orders like a seasoned thief using DCA tactics.
Enter on swings or any bullish confirmation.
Heist Window is Open.
🛑 Stop Loss – Escape Route
📍 SL near 143.000 (1D swing low) — adjust based on your capital and position size.
💡 Don’t go blind — SL is your backup plan, not an optional accessory.
Custom-fit it based on how many entries you’re stacking.
🎯 Target – Vault Exit Point
🏁 151.000 or exit before resistance heat catches on.
No greedy thieves here — precision exit is key.
Lock profits, vanish in style. 🕶️💼💸
🧲 Scalpers Take Note
Only long side raids are valid. Scalping against the trend? That's walking into a trap.
Use trailing SLs and protect your loot.
Small bag or big vault — play your game smart. 🎯💰
📢 Fundamental Boosters
USD/JPY’s bullish run isn’t random — it’s backed by:
📊 Macro shifts,
📈 COT reports,
🧠 Sentiment drivers,
📉 Intermarket trends,
And a whole mix of thief-level intel 🔍
🧭 Dive deeper before acting. The map’s been provided. 🔗🌍
🗞 News Traps Ahead – Move Cautiously
🚫 Avoid new trades during major releases
🔁 Use trailing SLs on open positions
💡 Position management is a thief’s best defense. Risk management keeps you in the game. 🎯🧠
🔥💖 Support the Heist Crew
Smash that ❤️🔥 Boost Button to keep our robbery engine running.
Each boost = strength for our crew.
💬 Share the love, spread the intel, and trade like a rogue with brains. 🤝💵
👀 Stay tuned for more high-profile FX heists from Thief Trader.
Until next time — loot wisely, vanish clean. 🐱👤💨

USDJPY Weakening or a Correction to the Uptrend✏️ OANDA:USDJPY is approaching the old Break out support zone. The convergence zone of the 2 EMA lines. If there is a sweep to the support zone at the beginning of the week, it will be an opportunity to buy to continue the bullish wave structure. When this 146.200 zone is broken, the uptrend will be broken and we have to wait for new momentum to determine the next trend.
📉 Key Levels
Support: 146.200-143.200
Resistance: 150.800-154.500
Buy zone 146.300 (Support & Trendline)
Buy zone 143.200 Strong support zone
Target 154.500
Leave your comments on the idea. I am happy to read your views.

DeGRAM | USDJPY will retest the support level📊 Technical Analysis
● USDJPY is riding an ascending channel after a bullish breakout above the long-term descending trendline and successful retests of the 144.9–146.6 zone as support.
● Price is carving higher highs and higher lows, with the current bullish pennant pointing to a measured move toward the 150.8 resistance if 147.2 is breached on strong momentum.
💡 Fundamental Analysis
● The yen remains under pressure as US labor data stays firm and Fed officials hint at fewer cuts, reinforcing US-Japan rate divergence.
● BOJ’s dovish tone in recent speeches and widening trade deficit further weigh on JPY.
✨ Summary
Buy 145.2–146.2; confirmation >147.2 targets 150.8. Invalidation below 142.8 support zone.
-------------------
Share your opinion in the comments and support the idea with like. Thanks for your support!

USD/JPY) support boost Bullish Trend Read The captionSMC Trading point update
Technical analysis of USD/JPY on the 4-hour timeframe, based on a rejection from a key support zone and signs of trend continuation toward a higher target.
---
Technical Breakdown:
1. Support Level:
Price has bounced from a clearly defined support zone around 146.00 – 146.50, which has held multiple times in the past.
This zone is acting as a strong demand area where buyers are stepping in.
2. Bullish Rejection + Structure:
A bullish candle has formed from the support area, signaling potential reversal.
The drawn projection suggests higher highs and higher lows forming — indicating bullish continuation.
3. EMA (200):
Price has respected the 200 EMA (blue line), bouncing off it — a strong confluence for bullish trend continuation.
EMA is slightly upward sloping, indicating a longer-term bullish bias remains intact.
4. RSI (14):
RSI is rising from oversold territory (42.09), indicating a bullish momentum shift.
A potential bullish divergence might be forming (price made lower low, RSI made higher low).
5. Target Point:
Price is projected to reach 150.904, giving a potential move of ~2.91% (426 pips) from current levels.
---
Trade Idea Summary:
Bias: Bullish
Entry Zone: 146.90 – 147.30 (current levels or slight pullback)
Stop Loss: Below the support zone (~145.90)
Take Profit (TP): 150.900 (key resistance / previous high)
Risk-to-Reward Ratio: Attractive, based on the size of the support zone vs. projected move
Mr SMC Trading point
---
Key Insights:
Strong confluence between price structure, support zone, and 200 EMA bounce.
Favorable risk-reward ratio for swing or intraday traders.
Best confirmation would come from a bullish engulfing candle or break above minor resistance near 147.80.
Please support boost 🚀 this analysis)

USDJPY Strong Breakout!
HI,Traders !
#USDJPY made a bearish
Breakout of the rising support
Line and the breakout is
Confirmed so we will be
Expecting a further bearish
Move down !
Comment and subscribe to help us grow !

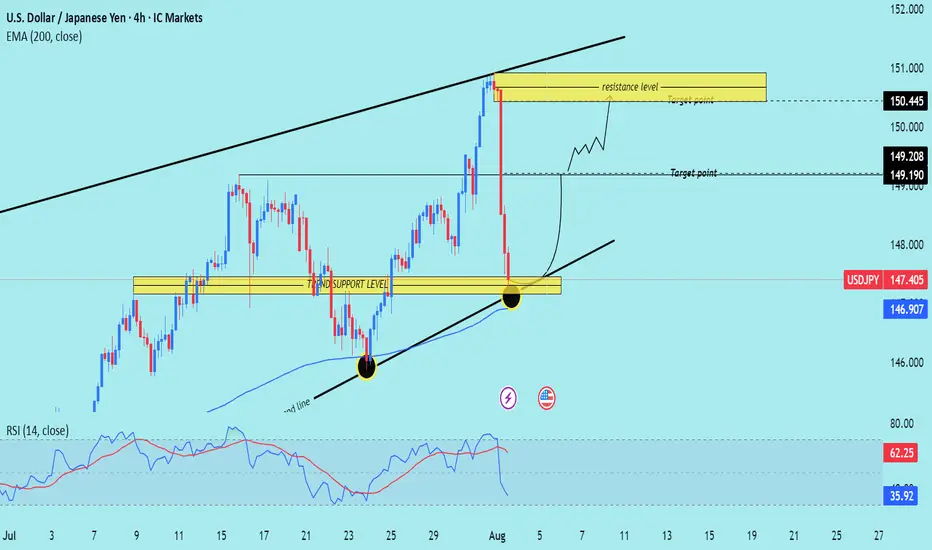
USD/JPY) Bullish trend analysis Read The captionSMC Trading point update
Technical analysis of USD/JPY on the 4-hour timeframe, using a combination of trendline support, key horizontal levels, and EMA 200 confluence to identify a potential bounce.
---
Technical Breakdown:
1. Market Structure:
USD/JPY experienced a sharp decline from the resistance zone near 150.445, but price is now testing a strong confluence support area:
Horizontal support zone
Rising trendline
200 EMA (146.907)
2. Support Confluence Zone:
Marked as "trend support level", this zone has historically acted as a springboard for bullish moves.
Recent price action shows a wick rejection at this zone, indicating buying pressure.
3. Resistance/Target Zones:
Target 1: 149.190 – 149.208
Target 2: 150.445 (major resistance zone)
4. EMA 200:
Price is reacting just above the 200 EMA, strengthening the bullish case for a bounce.
5. RSI (14):
RSI has dipped to 35.92, near oversold territory, suggesting the downside may be exhausted.
Prior bounce from similar RSI levels led to strong upward moves.
6. Projected Path:
The chart outlines a potential bullish recovery, targeting a climb back into the upper channel and retesting previous highs.
Mr SMC Trading point
---
Trade Idea Summary:
Bias: Bullish (Reversal from trendline + support zone)
Entry Zone: Current level near 147.40–146.90 (support confluence)
Targets:
TP1: 149.190
TP2: 150.445
Invalidation: Daily close below trendline and 200 EMA (~146.70 or lower)
Indicators: RSI supports a bounce; EMA and trendline confirm structure
Please support boost 🚀 this analysis)
DeGRAM | USDJPY fixed above the descending channel📊 Technical Analysis
● Dollar-yen has punched through the 16-month descending channel top and twice retested it as support (false-break tags), carving a rising trend line that now guides price away from 144.90.
● Inside the break zone a smaller pennant is forming; a 4 h close above 147.18 completes the pattern and activates the channel-height target at 150.80 near the November swing cap.
💡 Fundamental Analysis
● US 2-yr yields pushed to a three-month high after hotter CPI core-services and Barkin’s “inflation progress has stalled”, while the BoJ July minutes flagged only “gradual” QT—widening the policy gap and reviving carry demand for yen shorts.
✨ Summary
Long 145.2-146.2; pennant break >147.18 targets 150.80. Bias void on a 4 h close below 142.80.
-------------------
Share your opinion in the comments and support the idea with like. Thanks for your support!

USD/JPY on the 1D timeframeBased on the chart I provided for USD/JPY on the 1D timeframe, here is the target analysis:
📉 Downtrend Analysis:
The chart is showing a descending channel, indicating a bearish trend.
Price has been respecting the upper and lower bounds of the channel.
Two target zones are marked with labels “TakeProfit”, suggesting projected bearish targets.
🎯 Identified Targets:
1. First Target Zone (TakeProfit):
📍 Around 152.00
This is the first expected support area where price may bounce or consolidate.
2. Second Target Zone (TakeProfit):
📍 Around 146.50 – 146.00
This level aligns with historical support and volume profile concentration.

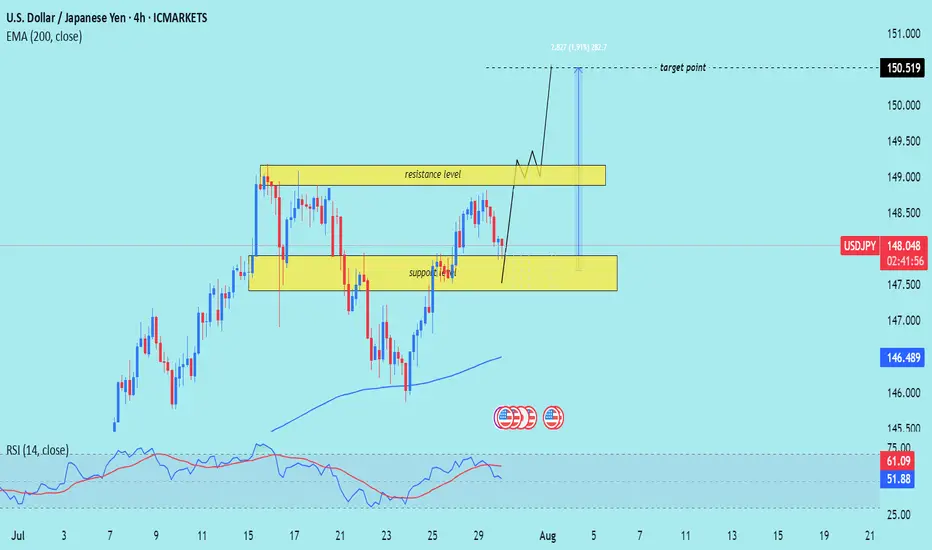
USD/JPY) Bullish Trend Read The captionSMC Trading point update
Technical analysis of USD/JPY on the 4-hour timeframe, with a focus on a support-resistance structure and trend
---
Technical Breakdown:
1. Market Structure:
Price is moving in a clear uptrend, making higher highs and higher lows.
A recent pullback into a support zone suggests potential for a bullish continuation.
2. Key Zones:
Support Zone: Around 147.00–147.50, highlighted in yellow — the area where price recently bounced.
Resistance Zone: Around 148.800–149.300, which price is expected to break through.
Target Point: Clearly marked at 150.519, aligning with the prior high and a projected bullish extension.
3. EMA (200):
The 200 EMA (blue) is at 146.489, far below current price — signaling strong bullish momentum.
4. RSI (14):
RSI is at 61.14, showing bullish momentum without being overbought — supportive of further upside.
No divergence is noted, which supports trend continuation.
5. Projection (Drawn Path):
The chart suggests price may bounce from support, break through resistance, and rally toward 150.519, possibly after a retest of the resistance-turned-support.
Mr SMC Trading point
---
Trade Idea Summary:
Bias: Bullish
Entry Zone: Near 147.00–147.50 (support)
Confirmation: Bullish candlestick pattern or strong bounce
Target: 150.519
Invalidation: Break and close below 146.489 (200 EMA) or sustained move below support zone
---
Please support boost 🚀 this analysis)
USDJPY Cooking Something – Here's Where I’ll BiteTHE BATTLE OF MY BLUE LINES 📉
The big picture of USDJPY is BUY possible up to 149.35.
I see H1 send me love note to BUY (range) but 15m reject it by forming SELL range.
Conflict? No! This means there is temporary reversal (BEARISH).
Two top BLUE LINES (147.75/85) are where I can SELL my love story. I will first wait H4 to Kiss either of the line. Since 15m SELL range already formed, I ’ll jump in like a love-struck fool (AGGRESSIVE).
TP: Middle BLUE LINE (147.21) = Dating spot for Buyers.
Middle BLUE LINES (147.21, 147.00)
If H4 price come and KISS (touches and leave wick) in either of these, I’m rushing to 15m to catch that BUY breakout.
If H4 price come and CUDDLE (close by body),I’ll cozy up to SELL (after confirmation) and ride it all the way down to 146.42, the Bottom BLUE LINE. 📉
In Bottom BLUE LINE (146.42) = Buyers Chilling Zone
If H4 price come and KISS (touches and leave wick), I’m rushing down to 15m to catch that BUY breakout — love at first touch!
If H4 price come and CUDDLE (close by body), my trading heartbreak season will start!
WISH ME LUCK.!!!

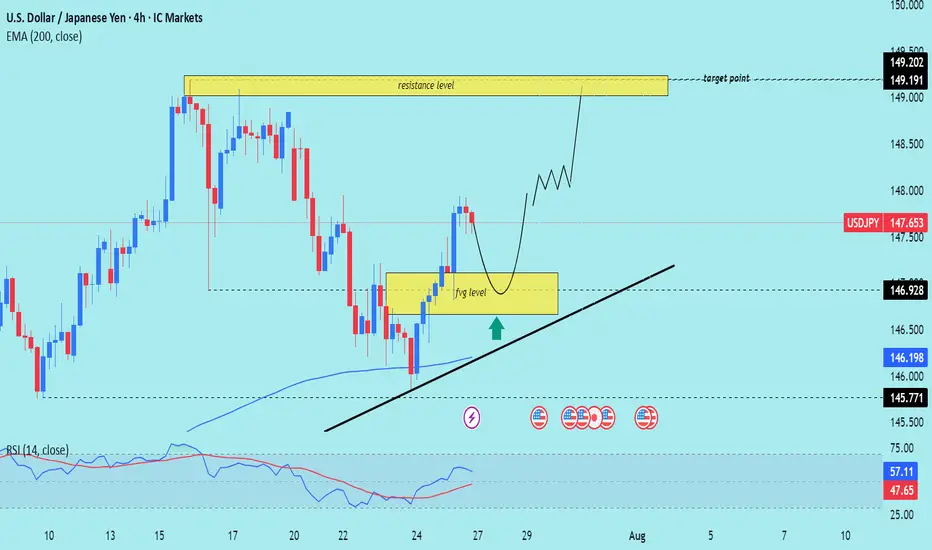
USD/JPY) Bullish Analysis Read The captionSMC Trading point update
Technical analysis of USD/JPY on the 4-hour timeframe, signaling a potential rally toward the 149.191–149.202 resistance zone. Here's the full breakdown
---
Technical Analysis – USD/JPY (4H)
1. Fair Value Gap (FVG) Support
Price recently filled a Fair Value Gap (FVG) level (yellow box) and is now pulling back toward it.
The FVG zone is expected to act as a support and potential entry point for buyers (marked by the green upward arrow).
2. Uptrend Structure
Price is moving within an ascending trendline, suggesting bullish market structure.
The current retracement is seen as a higher low setup, aligning with bullish continuation logic.
3. 200 EMA as Support
The 200 EMA at 146.198 is providing dynamic support.
Confluence between the EMA, FVG, and ascending trendline strengthens the bullish bias.
4. Resistance Target Zone
The projected target zone is between 149.191–149.202, which aligns with a previous high and key resistance level.
This zone is highlighted as the final take-profit area.
5. RSI Momentum
RSI is at 57.11, showing positive momentum but not yet overbought — which supports further upside.
RSI remains above 50, maintaining bullish momentum.
Mr SMC Trading point
---
Summary
Bias: Bullish
Current Price: 147.653
Support Zone (FVG): 146.20–146.92 (approx)
Trendline Support: Uptrend line intact
200 EMA: Acting as dynamic support (146.198)
Resistance Target: 149.191–149.202
RSI: 57.11 – healthy bullish momentum
plesse support boost 🚀 this analysis)
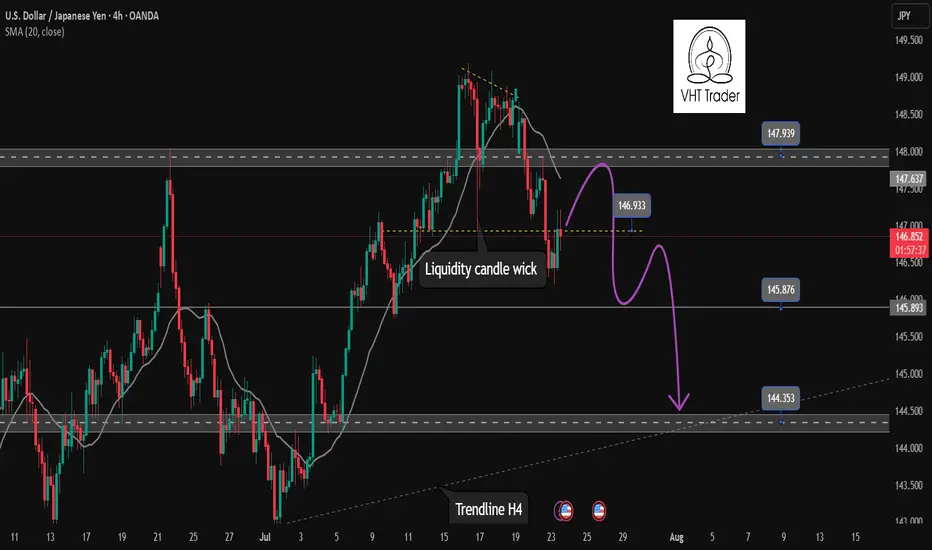
Continuation of downtrend. Waiting for confirmation SELL USDJPY✏️ OANDA:USDJPY is starting a corrective downtrend. Yesterday's New York session's selling pressure surpassed the buying liquidity zone around 147,000. This further confirms the possibility of the pair continuing its downward correction. Some recovery waves in today's Asia-Europe session are considered a good opportunity to SELL towards the target of 144,300 (trailline zone of the h4 frame). Pay attention to the important breakout price zone of 145,900.
📉 Key Levels
Support: 145,900-144,300
Resitance: 147,000-147,800
SELL trigger: Rejection from 147,000
SELL 147,700 (Strong resistance + SMA 20)
Target 144,400
SELL DCA: Break 145,900
Leave your comments on the idea. I am happy to read your views.
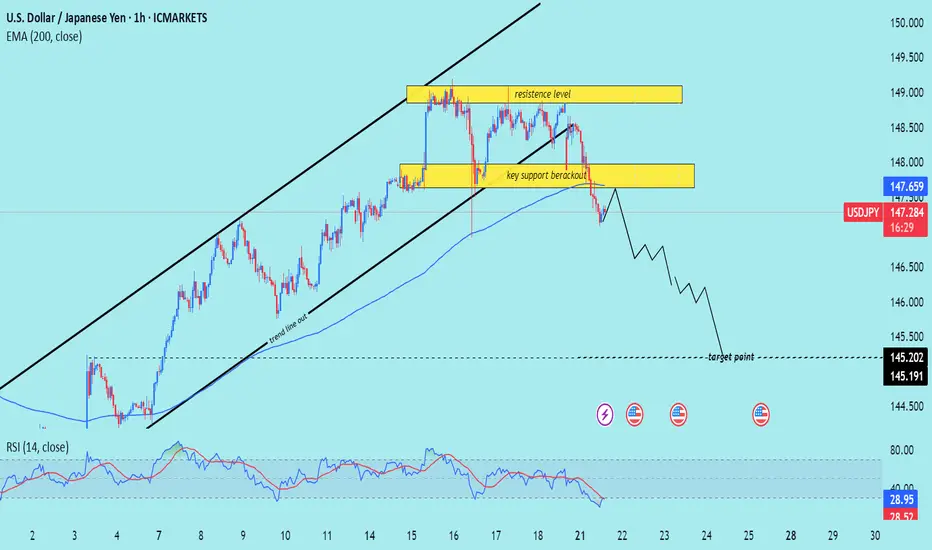
USD/JPY) bearish Trend Read The captionSMC Trading point update
Technical analysis of USD/JPY on the 1-hour timeframe, signaling a potential drop toward the 145.200 – 145.191 target zone. Here's the detailed breakdown:
---
Technical Analysis – USD/JPY (1H)
1. Rising Channel Breakdown
Price has broken below an ascending channel, confirming a trend line breakout and signaling a trend shift from bullish to bearish.
The trend line cut and rejection from the upper resistance zone support the bearish reversal.
2. Key Support Breakout
A crucial horizontal support zone around 147.80–148.00 was broken.
The break-and-retest of this area (yellow box) acts as a confirmation of bearish momentum continuation.
3. Bearish Momentum Below EMA
Price is trading below the 200 EMA (147.659) — a strong signal of downward bias on this timeframe.
The EMA has flipped from dynamic support to resistance.
4. RSI Oversold but Bearish
RSI is at 29.41, in oversold territory, which may hint at a short-term bounce.
However, the broader structure suggests more downside potential before a deeper retracement.
5. Target Projection
Projected target zone is between 145.200–145.191, aligning with previous structure lows and likely liquidity zone.
Mr SMC Trading point
Summary
Bias: Bearish
Current Price: 147.307
Key Resistance: 147.80–148.60 zone
Structure: Rising channel break + key support breakout
200 EMA: Above price (bearish signal)
RSI: 29.41 – oversold but momentum remains bearish
Target: 145.200–145.191
Please support boost 🚀 this analysis)
USDJPY Bearish Breakout!
HI,Traders !
#USD-JPY was trading along
The rising support line but
Now we are seeing a bearish
Breakout so we are bearish
Biased and we will be expecting
A further bearish move down !
Comment and subscribe to help us grow !

USDJPY Support & Resistance Levels🚀 Here are some key zones I've identified on the 15m timeframe.
These zones are based on real-time data analysis performed by a custom software I personally developed.
The tool is designed to scan the market continuously and highlight potential areas of interest based on price action behavior and volume dynamics.
Your feedback is welcome!

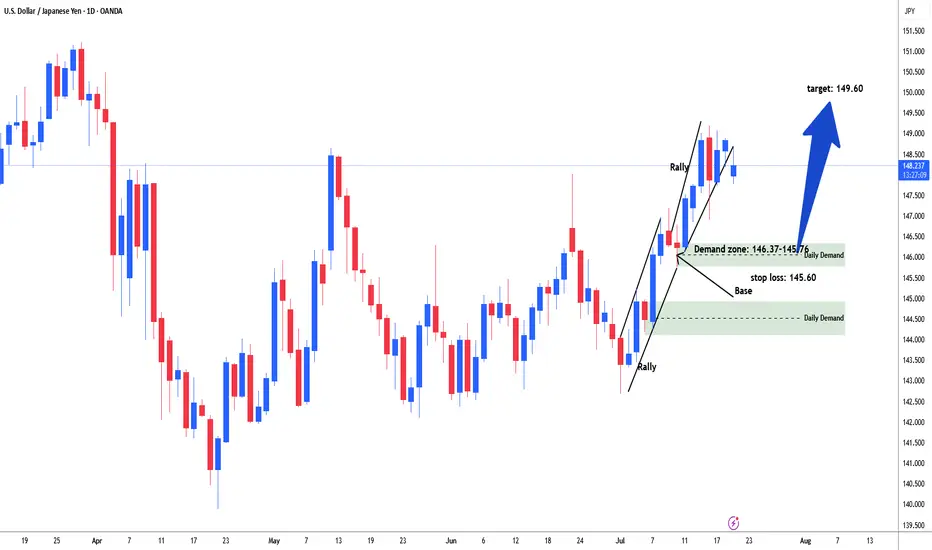
USDJPY Possible long for 149.60#usdjpy started rally from the start of the month of July. Price consolidate in range between 142.85-10. Then started rally. price again consolidate in range between 147.15-145.76 area. Market build energy and institutional add further longs and broke above the daily resistance line 148.60. Need to sell off / retracement to test demand zone range 146.37-145.78 area to test and filled remaining institutional orders for long. Buying area 146.37-145.76. stop loss: 145.60. Target: 149.60
#USDJPY: Price is currently accumulating ! Wait For DistributionAt present, the USDJPY currency pair appears to be in an accumulation phase, as evidenced by the absence of significant price movement throughout the current week. Several factors contribute to this trend.
Firstly, several significant economic events are scheduled for this week, particularly tomorrow and Friday. These developments hold substantial implications for the future trajectory of the USDJPY pair. Consequently, there exists a possibility that the price may experience a decline prior to initiating a bullish trend.
Secondly, there are two primary areas where the price could reverse its course. The extent to which the USD reacts to the economic data will serve as an indicator of the potential reversal zones.
It is imperative that you conduct your own analysis before making any financial decisions. This chart should be utilised solely for educational purposes and does not guarantee any specific outcome.
Regarding the stop loss, as this is a swing trade, it is advisable to employ a larger stop loss if the price reaches entry zones. The take profit level can be determined based on your entry type and analysis.
We wish you the best of luck in your trading endeavours and emphasise the importance of trading safely.
Kindly share this analysis with others through likes, comments, and social media platforms. If you have any questions or require further assistance, please do not hesitate to comment below. We are here to provide support.
Team Setupsfx_
❤️🚀
USD/JPY 4-Hour Chart Analysis4-hour chart displays the price movement of the U.S. Dollar against the Japanese Yen (USD/JPY) from June to August 2025. The chart shows a significant upward trend in July, followed by a correction. Key levels are highlighted, including support at 147.031 and resistance at 150.130, with the current price at 148.809. The chart suggests a potential bullish continuation, as indicated by the upward arrow and green box, targeting higher levels above 150.000.

USDJPY H1 Support & Resistance Levels🚀 Here are some key zones I've identified on the 15m timeframe.
These zones are based on real-time data analysis performed by a custom software I personally developed.
The tool is designed to scan the market continuously and highlight potential areas of interest based on price action behavior and volume dynamics.
Your feedback is welcome!

USD/JPY 4-Hour Forex Chart4-hour performance of the U.S. Dollar (USD) against the Japanese Yen (JPY) from late June to mid-July 2025, sourced from FOREX.com. The current exchange rate is 147.436, with a 1.178 (+0.81%) increase. Key levels include a sell price of 147.393 and a buy price of 147.479. The chart shows a recent upward trend with a resistance zone highlighted between 147.436 and 148.092, and support around 146.598. Candlestick patterns indicate volatility, with notable price movements around early July.
