US DOLLAR H4 | Bullish Reversal Off Pullback SupportThe price has bounced off our buy entry level at 12.52, which is a pullback support that aligns with the 78.6% Fibonacci retracement.
Our stop loss is set at 12.47, which is a swing low support.
Our take profit is set at 12.59, which is a pullback resistance that aligns with the 61.8% Fibonacci retracement.
High Risk Investment Warning
Stratos Markets Limited fxcm.com Stratos Europe Ltd fxcm.com
CFDs are complex instruments and come with a high risk of losing money rapidly due to leverage. 69% of retail investor accounts lose money when trading CFDs with this provider. You should consider whether you understand how CFDs work and whether you can afford to take the high risk of losing your money.
Stratos Global LLC fxcm.com Losses can exceed deposits.
Please be advised that the information presented on TradingView is provided to FXCM (‘Company’, ‘we’) by a third-party provider (‘TFA Global Pte Ltd’). Please be reminded that you are solely responsible for the trading decisions on your account. Any information and/or content is intended entirely for research, educational and informational purposes only and does not constitute investment or consultation advice or investment strategy. The information is not tailored to the investment needs of any specific person and therefore does not involve a consideration of any of the investment objectives, financial situation or needs of any viewer that may receive it. Past performance is not a reliable indicator of future results. Actual results may differ materially from those anticipated in forward-looking or past performance statements. We assume no liability as to the accuracy or completeness of any of the information and/or content provided herein and the Company cannot be held responsible for any omission, mistake nor for any loss or damage including without limitation to any loss of profit which may arise from reliance on any information supplied by TFA Global Pte Ltd.
Stratos Trading Pty. Limited fxcm.com
Trading FX/CFDs carries significant risks. FXCM AU (AFSL 309763), please read the Financial Services Guide, Product Disclosure Statement, Target Market Determination and Terms of Business at fxcm.com
Usdollarlong

USDOLLAR H1 | Bullish ContinuationThe price is falling towards our buy entry level at 12.58, which is a pullback support that lines up with the 38.2 Fibonacci retracement.
Our stop loss is set at 12.54, which is a pullback support that is slightly above the 61.8% Fibonacci retracement.
Our take profit is set at 12.67, which is a pullback resistance.
High Risk Investment Warning
Stratos Markets Limited fxcm.com Stratos Europe Ltd fxcm.com
CFDs are complex instruments and come with a high risk of losing money rapidly due to leverage. 69% of retail investor accounts lose money when trading CFDs with this provider. You should consider whether you understand how CFDs work and whether you can afford to take the high risk of losing your money.
Stratos Global LLC fxcm.com Losses can exceed deposits.
Please be advised that the information presented on TradingView is provided to FXCM (‘Company’, ‘we’) by a third-party provider (‘TFA Global Pte Ltd’). Please be reminded that you are solely responsible for the trading decisions on your account. Any information and/or content is intended entirely for research, educational and informational purposes only and does not constitute investment or consultation advice or investment strategy. The information is not tailored to the investment needs of any specific person and therefore does not involve a consideration of any of the investment objectives, financial situation or needs of any viewer that may receive it. Past performance is not a reliable indicator of future results. Actual results may differ materially from those anticipated in forward-looking or past performance statements. We assume no liability as to the accuracy or completeness of any of the information and/or content provided herein and the Company cannot be held responsible for any omission, mistake nor for any loss or damage including without limitation to any loss of profit which may arise from reliance on any information supplied by TFA Global Pte Ltd.
Stratos Trading Pty. Limited fxcm.com
Trading FX/CFDs carries significant risks. FXCM AU (AFSL 309763), please read the Financial Services Guide, Product Disclosure Statement, Target Market Determination and Terms of Business at fxcm.com

USDOLLAR H1 | Potential Bullish ReversalThe price is falling towards our buy entry level at 12.51, which is a pullback support.
Our stop loss is set at 12.46, which is a swing low support.
Our take profit is set at 12.59, which is a pullback resistance that is slightly below the 50% Fibonacci retracement.
High Risk Investment Warning
Stratos Markets Limited fxcm.com Stratos Europe Ltd fxcm.com
CFDs are complex instruments and come with a high risk of losing money rapidly due to leverage. 69% of retail investor accounts lose money when trading CFDs with this provider. You should consider whether you understand how CFDs work and whether you can afford to take the high risk of losing your money.
Stratos Global LLC fxcm.com Losses can exceed deposits.
Please be advised that the information presented on TradingView is provided to FXCM (‘Company’, ‘we’) by a third-party provider (‘TFA Global Pte Ltd’). Please be reminded that you are solely responsible for the trading decisions on your account. Any information and/or content is intended entirely for research, educational and informational purposes only and does not constitute investment or consultation advice or investment strategy. The information is not tailored to the investment needs of any specific person and therefore does not involve a consideration of any of the investment objectives, financial situation or needs of any viewer that may receive it. Past performance is not a reliable indicator of future results. Actual results may differ materially from those anticipated in forward-looking or past performance statements. We assume no liability as to the accuracy or completeness of any of the information and/or content provided herein and the Company cannot be held responsible for any omission, mistake nor for any loss or damage including without limitation to any loss of profit which may arise from reliance on any information supplied by TFA Global Pte Ltd.
Stratos Trading Pty. Limited fxcm.com
Trading FX/CFDs carries significant risks. FXCM AU (AFSL 309763), please read the Financial Services Guide, Product Disclosure Statement, Target Market Determination and Terms of Business at fxcm.com

USDOLLAR H4 | Bullish Bounce?The price is falling towards our buy entry whcih is a pullback support that aligns with the 38.2% Fibonacci retracement.
Our stop loss is set at 12.71, which is a pullback support that aligns with the 38.2% Fibonacci retracement.
Our take profit is set at 12.77, which is an overlap resistance.
High Risk Investment Warning
Stratos Markets Limited (

Potential bullish rise?US Dollar Index (DXY) has reacted off the pivot and could rise to the 1st resistance which is alightly above the 127.2% Fibonacci extension.
Pivot: 98.60
1st Support: 998.40
1st Resistance: 99.09
Disclaimer:
The opinions given above constitute general market commentary and do not constitute the opinion or advice of IC Markets or any form of personal or investment advice.
Any opinions, news, research, analyses, prices, other information, or links to third-party sites contained on this website are provided on an "as-is" basis, are intended to be informative only, and are not advice, a recommendation, research, a record of our trading prices, an offer of, or solicitation for, a transaction in any financial instrument and thus should not be treated as such. The information provided does not involve any specific investment objectives, financial situation, or needs of any specific person who may receive it. Please be aware that past performance is not a reliable indicator of future performance and/or results. Past performance or forward-looking scenarios based upon the reasonable beliefs of the third-party provider are not a guarantee of future performance. Actual results may differ materially from those anticipated in forward-looking or past performance statements. IC Markets makes no representation or warranty and assumes no liability as to the accuracy or completeness of the information provided, nor any loss arising from any investment based on a recommendation, forecast, or any information supplied by any third party

DXY H4 | Bullish Bounce Off Key SupportThe price is falling towards our buy entry level at 97.78, which is an overlap support that aligns with the 61.8% Fibonacci retracement.
Our stop loss is set at 97.76, which is an overlap support that aligns with the 61.8% Fibonacci retracement.
Our take profit is set at 98.34, which is a multi swing high resistance.
High Risk Investment Warning
Stratos Markets Limited (

USDOLLAR H1 | Bullish Bounce Off Overlap SupportThe price is falling towards our buy entry, which is an overlap support that aligns with he 50% Fibonacci retracement.
Our stop loss is set at 12.72, which is an overlap support that aligns with the 50% Fibonacci retracement.
Our take profit is set at 12.70, which is an overlap support.
High Risk Investment Warning
Stratos Markets Limited (

USDOLLAR H1 | Bullish BreakoutBased on the H1 chart analysis, we can see that the price has bounced off our buy entry, which is a pullback support.
Our stop-loss is set at 12.694, which corresponds to a pullback support that aligns with the 61.8% Fibonacci retracement.
Our take profit is set at 12.730, which aligns with the 61.8% Fibonacci retracement as a pullback resistance.
High Risk Investment Warning
Stratos Markets Limited (

USDOLLAR H4 | Bullish Reversal Off 127.2% Fib SupportBased on the H4 chart analysis, the price has bounced off our buy entry level at 12.67, a pullback support that aligns with the 127.2% Fibonacci retracement.
Our take profit is set at 12.72, a pullback support that aligns with the 127.2% Fibonacci retracement.
Our stop loss is set at 12.65, which is an overlap support.
High Risk Investment Warning
Stratos Markets Limited ( fxcm.com/uk ), Stratos Europe Ltd ( fxcm.com/eu ):
CFDs are complex instruments and come with a high risk of losing money rapidly due to leverage. 70% of retail investor accounts lose money when trading CFDs with this provider. You should consider whether you understand how CFDs work and whether you can afford to take the high risk of losing your money.
Stratos Global LLC ( fxcm.com/en ): Losses can exceed deposits.
Please be advised that the information presented on TradingView is provided to Tradu (‘Company’, ‘we’) by a third-party provider (‘TFA Global Pte Ltd’). Please be reminded that you are solely responsible for the trading decisions on your account. Any information and/or content is intended entirely for research, educational and informational purposes only and does not constitute investment or consultation advice or investment strategy. The information is not tailored to the investment needs of any specific person and therefore does not involve a consideration of any of the investment objectives, financial situation or needs of any viewer that may receive it. Past performance is not a reliable indicator of future results. Actual results may differ materially from those anticipated in forward-looking or past performance statements. We assume no liability as to the accuracy or completeness of any of the information and/or content provided herein and the Company cannot be held responsible for any omission, mistake nor for any loss or damage including without limitation to any loss of profit which may arise from reliance on any information supplied by TFA Global Pte Ltd.
Stratos Trading Pty. Limited ( fxcm.com/au ):
Trading FX/CFDs carries significant risks. FXCM AU (AFSL 309763), please read the Financial Services Guide, Product Disclosure Statement, Target Market Determination and Terms of Business at fxcm.com/au

Bullish reversalUS Dollar Index (DXY) has bounced off the pivot and could rise to the 1st resistance.
Pivot: 98.24
1st Support: 97.90
1st Resistance: 98.76
Disclaimer:
The opinions given above constitute general market commentary and do not constitute the opinion or advice of IC Markets or any form of personal or investment advice.
Any opinions, news, research, analyses, prices, other information, or links to third-party sites contained on this website are provided on an "as-is" basis, are intended to be informative only, and are not advice, a recommendation, research, a record of our trading prices, an offer of, or solicitation for, a transaction in any financial instrument and thus should not be treated as such. The information provided does not involve any specific investment objectives, financial situation, or needs of any specific person who may receive it. Please be aware that past performance is not a reliable indicator of future performance and/or results. Past performance or forward-looking scenarios based upon the reasonable beliefs of the third-party provider are not a guarantee of future performance. Actual results may differ materially from those anticipated in forward-looking or past performance statements. IC Markets makes no representation or warranty and assumes no liability as to the accuracy or completeness of the information provided, nor any loss arising from any investment based on a recommendation, forecast, or any information supplied by any third party

Bullish reversal setup?US Dollar Index (DXY) is falling towards the pivot and could bounce to the 1st resistance.
Pivot: 97.96
1st Support: 97.55
1st Resistance: 98.74
Disclaimer:
The opinions given above constitute general market commentary and do not constitute the opinion or advice of IC Markets or any form of personal or investment advice.
Any opinions, news, research, analyses, prices, other information, or links to third-party sites contained on this website are provided on an "as-is" basis, are intended to be informative only, and are not advice, a recommendation, research, a record of our trading prices, an offer of, or solicitation for, a transaction in any financial instrument and thus should not be treated as such. The information provided does not involve any specific investment objectives, financial situation, or needs of any specific person who may receive it. Please be aware that past performance is not a reliable indicator of future performance and/or results. Past performance or forward-looking scenarios based upon the reasonable beliefs of the third-party provider are not a guarantee of future performance. Actual results may differ materially from those anticipated in forward-looking or past performance statements. IC Markets makes no representation or warranty and assumes no liability as to the accuracy or completeness of the information provided, nor any loss arising from any investment based on a recommendation, forecast, or any information supplied by any third party

Are U.S. Dollar Bears getting exhausted?Still holding on to my EUR/USD short positions since late June/early July and it’s been quite a game of patience at this point but as I have been analyzing the U.S. Dollar for the past few months, from a purely technical analysis perspective, I’m currently still seeing the U.S. Dollar potentially carving out a bottom here and make a run to re-visit the 100 - 102 price zone.
I know markets are highly anticipating a Federal Reserve rate cute in September but with inflation still sticking around, it may not be such a sure thing just yet.
All eyeballs and ears will be on tap for Powell’s speech on Friday.
Technical analysis signals:
• Descending Broadening/Expanding Wedge (Bullish Pattern)
• MACD Histogram showing a sign of potential bearish exhaustion

Bullish continuation setup?US Dollar Index (DXY) could fall to the pivot which acts as a pullback support that lines up with the 38.2% Fibonacci retracement and could bounce to the 1st resistance, which is a multi-swing high resitance.
Pivot: 99.80
1st Support: 99.53
1st Resistance: 100.35
Disclaimer:
The opinions given above constitute general market commentary and do not constitute the opinion or advice of IC Markets or any form of personal or investment advice.
Any opinions, news, research, analyses, prices, other information, or links to third-party sites contained on this website are provided on an "as-is" basis, are intended to be informative only, and are not advice, a recommendation, research, a record of our trading prices, an offer of, or solicitation for, a transaction in any financial instrument and thus should not be treated as such. The information provided does not involve any specific investment objectives, financial situation, or needs of any specific person who may receive it. Please be aware that past performance is not a reliable indicator of future performance and/or results. Past performance or forward-looking scenarios based upon the reasonable beliefs of the third-party provider are not a guarantee of future performance. Actual results may differ materially from those anticipated in forward-looking or past performance statements. IC Markets makes no representation or warranty and assumes no liability as to the accuracy or completeness of the information provided, nor any loss arising from any investment based on a recommendation, forecast, or any information supplied by any third party.

Potential bullish rise?US Dollar Index (DXY) has bounced off the pivot and could rise to the 1st resistance.
Pivot: 99.41
1st Support: 98.61
1st Resistance: 101.92
Disclaimer:
The opinions given above constitute general market commentary and do not constitute the opinion or advice of IC Markets or any form of personal or investment advice.
Any opinions, news, research, analyses, prices, other information, or links to third-party sites contained on this website are provided on an "as-is" basis, are intended to be informative only, and are not advice, a recommendation, research, a record of our trading prices, an offer of, or solicitation for, a transaction in any financial instrument and thus should not be treated as such. The information provided does not involve any specific investment objectives, financial situation, or needs of any specific person who may receive it. Please be aware that past performance is not a reliable indicator of future performance and/or results. Past performance or forward-looking scenarios based upon the reasonable beliefs of the third-party provider are not a guarantee of future performance. Actual results may differ materially from those anticipated in forward-looking or past performance statements. IC Markets makes no representation or warranty and assumes no liability as to the accuracy or completeness of the information provided, nor any loss arising from any investment based on a recommendation, forecast, or any information supplied by any third party.

Bullish momentum to extend?The US Dollar Index (DXY) is declining toward the pivot level, which serves as an overlap support zone, and may rebound toward the 1st resistance.
Pivot: 98.29
1st Support: 97.14
1st Resistance: 101.91
Disclaimer:
The above opinions given constitute general market commentary, and do not constitute the opinion or advice of IC Markets or any form of personal or investment advice.
Any opinions, news, research, analyses, prices, other information, or links to third-party sites contained on this website are provided on an "as-is" basis, are intended only to be informative, is not an advice nor a recommendation, nor research, or a record of our trading prices, or an offer of, or solicitation for a transaction in any financial instrument and thus should not be treated as such. The information provided does not involve any specific investment objectives, financial situation and needs of any specific person who may receive it. Please be aware, that past performance is not a reliable indicator of future performance and/or results. Past Performance or Forward-looking scenarios based upon the reasonable beliefs of the third-party provider are not a guarantee of future performance. Actual results may differ materially from those anticipated in forward-looking or past performance statements. IC Markets makes no representation or warranty and assumes no liability as to the accuracy or completeness of the information provided, nor any loss arising from any investment based on a recommendation, forecast or any information supplied by any third-party.

Bullish bounce off pullback support?The US Dollar Index (DXY) is falling towards the pivot, which is a pullback support and oculd bounce to the swing high resistance/
Pivot: 98.97
1st Support: 98.62
1st Resistance: 99.43
Disclaimer:
The above opinions given constitute general market commentary, and do not constitute the opinion or advice of IC Markets or any form of personal or investment advice.
Any opinions, news, research, analyses, prices, other information, or links to third-party sites contained on this website are provided on an "as-is" basis, are intended only to be informative, is not an advice nor a recommendation, nor research, or a record of our trading prices, or an offer of, or solicitation for a transaction in any financial instrument and thus should not be treated as such. The information provided does not involve any specific investment objectives, financial situation and needs of any specific person who may receive it. Please be aware, that past performance is not a reliable indicator of future performance and/or results. Past Performance or Forward-looking scenarios based upon the reasonable beliefs of the third-party provider are not a guarantee of future performance. Actual results may differ materially from those anticipated in forward-looking or past performance statements. IC Markets makes no representation or warranty and assumes no liability as to the accuracy or completeness of the information provided, nor any loss arising from any investment based on a recommendation, forecast or any information supplied by any third-party.

Bullish reversal?The US Dollar Index (DXY) is reacting off the pivot which aligns with the 50% Fibonacci retracement and could bounce from this level to the major resistance.
Pivot: 98.55
1st Support: 98
1st Resistance: 99.53
Disclaimer:
The above opinions given constitute general market commentary, and do not constitute the opinion or advice of IC Markets or any form of personal or investment advice.
Any opinions, news, research, analyses, prices, other information, or links to third-party sites contained on this website are provided on an "as-is" basis, are intended only to be informative, is not an advice nor a recommendation, nor research, or a record of our trading prices, or an offer of, or solicitation for a transaction in any financial instrument and thus should not be treated as such. The information provided does not involve any specific investment objectives, financial situation and needs of any specific person who may receive it. Please be aware, that past performance is not a reliable indicator of future performance and/or results. Past Performance or Forward-looking scenarios based upon the reasonable beliefs of the third-party provider are not a guarantee of future performance. Actual results may differ materially from those anticipated in forward-looking or past performance statements. IC Markets makes no representation or warranty and assumes no liability as to the accuracy or completeness of the information provided, nor any loss arising from any investment based on a recommendation, forecast or any information supplied by any third-party.

Bullish bounce?The US Dollar Index (DXY) is falling towards the pivot which is a pullback support and could bounce to the 1st resistance.
Pivot: 98.54
1st Suport: 96.63
1st Resistance: 101.95
Disclaimer:
The above opinions given constitute general market commentary, and do not constitute the opinion or advice of IC Markets or any form of personal or investment advice.
Any opinions, news, research, analyses, prices, other information, or links to third-party sites contained on this website are provided on an "as-is" basis, are intended only to be informative, is not an advice nor a recommendation, nor research, or a record of our trading prices, or an offer of, or solicitation for a transaction in any financial instrument and thus should not be treated as such. The information provided does not involve any specific investment objectives, financial situation and needs of any specific person who may receive it. Please be aware, that past performance is not a reliable indicator of future performance and/or results. Past Performance or Forward-looking scenarios based upon the reasonable beliefs of the third-party provider are not a guarantee of future performance. Actual results may differ materially from those anticipated in forward-looking or past performance statements. IC Markets makes no representation or warranty and assumes no liability as to the accuracy or completeness of the information provided, nor any loss arising from any investment based on a recommendation, forecast or any information supplied by any third-party.

mrmoney limited DXY position/swing trading ideaprice has reacted from our monthly support level giving us pin bar which created a double bottom on the weekly time frame looking for mor bullish move for the time being except price reacts on our resistance level

Bullish bounce?The US Dollar Index (DXY) is falling towards the pivot and could bounce to the 1st resistance, which is a pullback resistance.
Pivot: 97.96
1st Support: 97.49
1st Resistance: 98.77
Disclaimer:
The above opinions given constitute general market commentary, and do not constitute the opinion or advice of IC Markets or any form of personal or investment advice.
Any opinions, news, research, analyses, prices, other information, or links to third-party sites contained on this website are provided on an "as-is" basis, are intended only to be informative, is not an advice nor a recommendation, nor research, or a record of our trading prices, or an offer of, or solicitation for a transaction in any financial instrument and thus should not be treated as such. The information provided does not involve any specific investment objectives, financial situation and needs of any specific person who may receive it. Please be aware, that past performance is not a reliable indicator of future performance and/or results. Past Performance or Forward-looking scenarios based upon the reasonable beliefs of the third-party provider are not a guarantee of future performance. Actual results may differ materially from those anticipated in forward-looking or past performance statements. IC Markets makes no representation or warranty and assumes no liability as to the accuracy or completeness of the information provided, nor any loss arising from any investment based on a recommendation, forecast or any information supplied by any third-party.

USD/HUF: A Contrarian View on a Historical TrendUSD/HUF
"History doesn't repeat itself, but it often ryhmes."
This is an idea based on personal analysis and is not financial advice. The content reflects my current market perspective on USD/HUF, which has been a challenging trade for me personally. Your own due diligence is essential.
My analysis suggests that the Hungarian Forint's recent strength may be nearing a seasonal and technical reversal. A confluence of historical patterns, a contrarian market sentiment, and technical indicators point to a potential bottoming process for USD/HUF in the coming weeks.
Analysis & Rationale
Seasonality & Historical Context
Seasonal Pattern: Historically, the period from the second half of September to the first half of October has often marked a significant low for USD/HUF. This pattern was particularly evident in years with similar price action, such as 2008, 2011, and 2021.
Macro Correlation: Interestingly, these years were followed by major financial crises (2009 housing bubble, 2012 EU debt crisis, and the 2022 COVID-19 related market disruptions). While history doesn't repeat, it often "rhymes," and the current global economic backdrop warrants caution.
Political Precedent: The price action from 2017 is also highly relevant. During his first term, President Trump's administration had a stated goal of decreasing the dollar's value, which created a similar environment to today's market.
Market & Technical Breakdown
Market Sentiment: A strong contrarian signal is the overwhelming consensus among local Hungarian financial outlets. They are widely praising the Forint's strength and predicting long-term gains against major currencies, which can often precede a reversal.
Technical Indicators: While I primarily use price action, a look at key indicators supports a bullish reversal. The RSI, Stochastic, MACD, and Williams %R are all in a range indicating an oversold condition.
Smart Money Concepts (SMC): From an SMC perspective, price has moved into a monthly Fair Value Gap (FVG) positioned beneath a short-term low (the blue gap on the chart). There is also a weekly FVG (the red gap) below it, which could be the ultimate target before a significant reversal.
Trading Plan
The current price action is that of a "falling knife." Given the upcoming FED interest rate decision, I would advise caution. I am personally waiting for Thurseday to consider adding to my existing position.
While historical data suggests the ultimate low could be a few months away, a dollar-cost averaging (DCA) strategy at these price levels is a reasonable approach in my opinion.
"Be fearful when others are greedy, and greedy when others are fearful."

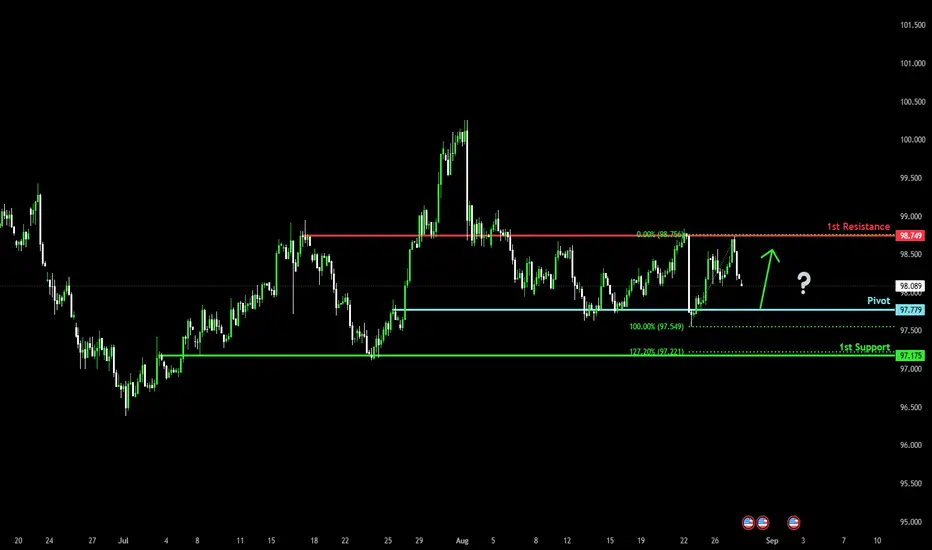
Bullish Bounce off Key Support?US Dollar Index (DXY) is falling towards the pivot and oculd bounce to the 1st resistance.
Pivot: 97.77
1st Support: 97.17
1st Resistance: 98.74
Risk Warning:
Trading Forex and CFDs carries a high level of risk to your capital and you should only trade with money you can afford to lose. Trading Forex and CFDs may not be suitable for all investors, so please ensure that you fully understand the risks involved and seek independent advice if necessary.
Disclaimer:
The above opinions given constitute general market commentary, and do not constitute the opinion or advice of IC Markets or any form of personal or investment advice.
Any opinions, news, research, analyses, prices, other information, or links to third-party sites contained on this website are provided on an "as-is" basis, are intended only to be informative, is not an advice nor a recommendation, nor research, or a record of our trading prices, or an offer of, or solicitation for a transaction in any financial instrument and thus should not be treated as such. The information provided does not involve any specific investment objectives, financial situation and needs of any specific person who may receive it. Please be aware, that past performance is not a reliable indicator of future performance and/or results. Past Performance or Forward-looking scenarios based upon the reasonable beliefs of the third-party provider are not a guarantee of future performance. Actual results may differ materially from those anticipated in forward-looking or past performance statements. IC Markets makes no representation or warranty and assumes no liability as to the accuracy or completeness of the information provided, nor any loss arising from any investment based on a recommendation, forecast or any information supplied by any third-party.
Bullish bounce off pullback support?The US Dollar Index (DXY) is falling towards the pivot and could bounce to the 1st resistance, which acts as a swing high resistance.
Pivot: 97.19
1st Support: 96.36
1st Resistance: 100.07
Risk Warning:
Trading Forex and CFDs carries a high level of risk to your capital and you should only trade with money you can afford to lose. Trading Forex and CFDs may not be suitable for all investors, so please ensure that you fully understand the risks involved and seek independent advice if necessary.
Disclaimer:
The above opinions given constitute general market commentary, and do not constitute the opinion or advice of IC Markets or any form of personal or investment advice.
Any opinions, news, research, analyses, prices, other information, or links to third-party sites contained on this website are provided on an "as-is" basis, are intended only to be informative, is not an advice nor a recommendation, nor research, or a record of our trading prices, or an offer of, or solicitation for a transaction in any financial instrument and thus should not be treated as such. The information provided does not involve any specific investment objectives, financial situation and needs of any specific person who may receive it. Please be aware, that past performance is not a reliable indicator of future performance and/or results. Past Performance or Forward-looking scenarios based upon the reasonable beliefs of the third-party provider are not a guarantee of future performance. Actual results may differ materially from those anticipated in forward-looking or past performance statements. IC Markets makes no representation or warranty and assumes no liability as to the accuracy or completeness of the information provided, nor any loss arising from any investment based on a recommendation, forecast or any information supplied by any third-party.
