DOLLAR INDEX - H4 - BULLISH CONTINUATION Dollar index - H4 - I see further upside for dollar long as this h4 demand zone holds well. Main trend for dollar is bullish for weeks to come so only looking to buy dollar on dips or continuation setups.
Usdollarlong

US Dollar Index - BullishOn the monthly timeframe, the Dollar index completed its fourth correction in the previous quarter with a clear flat ABC correction at 50% of wave (iii) and price made a perfect rebound from the ascending support. We could potentially expect a further upside to 2.618 ($120.394.) of the Fib retracement or around 2.0 ($108.684), the area where the ascending resistance lies. Invalidation for this bullish scenario is at the end of the fourth wave terminus ($88.3).

DXY fully powered upDXY blasted its further breath in the last few hours and managed to break the 93.18 level which was deemed to be a level that many considers a reversal/head & shoulders/correction were needed.
The end of the US session left DXY with nearly no wick on the highs of literally on most time frames last candle - telling all US pairs that "I'm not done yet"....
Looking into the RSI, it's close but not yet reaching to over bought level.
Given the fact it's successfully broken through the historical key resistance level around 93.180, I expect a quick retest (because current price is not far away), and then decide which direction to move on. For the moment, I am surely bias it will continue going further up.
93.430 is another immediate level of resistance, if it breaks, undoubtedly it will revisit 93.726 and this time if it does revisit, I expect it to break it too and move up above the mini uptrend channel (within the weekly uptrend channel)
Another reversal scenario : considering the rising wedge (to be confirmed in the next moves), it may possibly change the tone and go downward, I'm bias on bullish dollar, just be aware of its possibility.
Next week may as well just be consolidation week, you never know.
Note: I do not trade DXY but use it heavily for analysis of other pairs.

Possible to continue going up this weekJourney to the upside resumes. On monthly chart it's huge June engulfing green candle is showing it's power of support to the upside. On weekly, it continued to create higher lows despite of past 2 week's of downtrend movement. On daily, it was near the edge of breaking out from newly formed uptrend channel, but managed to bounce back up in the past few days.
The September bounce reversal point was roughly at 0.382 fib retracement of this year's gain (low Jan to high August), so if DXY can maintain it's position, break through 92.655 and stay above, I believe we'll see a green week and potentially more.
Entry: 92.520 or 92.685
SL: 92.291
TP :ultimate at 93.723; reasonable at 93.173
however 92.865 is an immediate resistance, with next at 93.173 and ultimately at 93.723 - If it does reach 93.723 which is very challenging, a deep retracement should happen immediately after breaking it.
Expected: 1 week

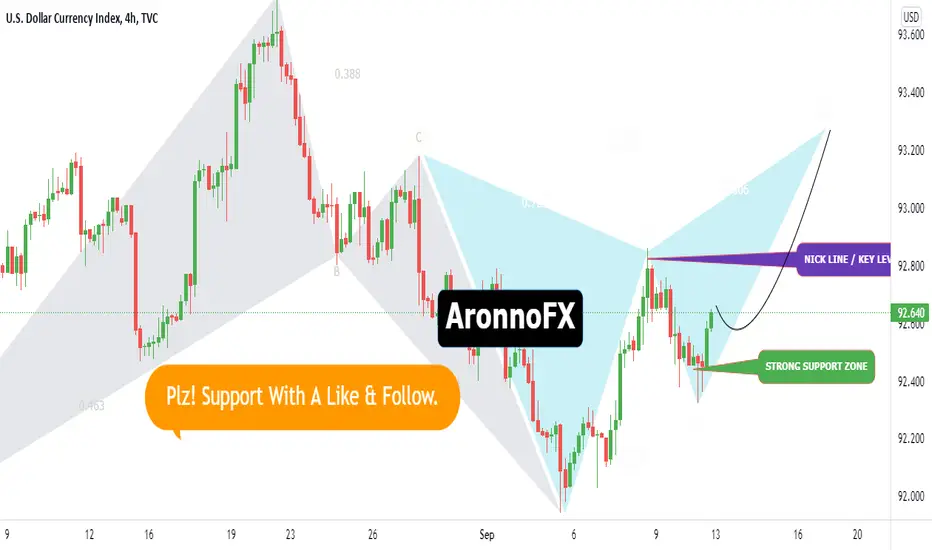
DXY create bearish butterfly pattern. So, BUY NOW....
DXY chart Hopefully create bearish butterfly pattern. So market goes
to 92.800 and 92.850 Neckline zone. If break out 92.900 resistance zone
then market huge buy to 93.000 & 93.270 zone. If the market break out 92.350
support level then then market goes down to 92.000 support zone.
AronnoFX will not accept any liability for loss or damage as a result of
reliance on the information contained within this channel including
data, quotes, charts and buy/sell signals
If you like this idea, do not forget to support with a like and follow.
Traders, if you like this idea or have your own opinion about it,
write in the comments. I will be glad.
USDOLLAR:NEW BULLISH IMPUSE COMING ? LONG VIEW + TARGETS 🔔The Dollar, finally after the release of the NPF last Friday seems to be starting to breathe today after the last sessions in which the price has fallen inexorably. We can also see that EUR/USD today started the session with the USD in recovery, link in the description. As for this chart, we can technically analyze that the price has been in a rising trend for some time, just look at the rising lows and highs that appears today a rebound on a dynamic support / trendline, the price that has moved above the 200 average and that the stocastic seems to come out of the oversold zone with divergence. Bearish volumes seem to be decreasing. We await a new bullish impulse.

Simple technical bounce neededDXY has suffered from continuous loss in the past few days and broken previous up trend channel which was formed not long ago and seems to heading back down again.
Currently it is on a level that's previously proven to be so so strong as support, including the sudden drop happened on 13th, Aug which got supported back up from current position, will history happen again?
I believe so, and if it happens, it can be considered as double bottom as shown in the chart. It is also supported by a mini falling wedge formed since last Friday's drop.
NOTE: I do not trade DXY but use it for other pairs. the trade panel is for demonstration only - although it may work. :)
RISK: If it breaks, there's a sink hole to be seen. weekly analysis can be found below.
The chart above is only for today analysis. Cheers
GL

US-DOLLAR possible RALLY!Hey tradomaniacs,
So... the market was waiting for Powell and got the so called "Nothing Burger".
Powells Key-Notes:
1️⃣ Clear progress towards foll employment.
2️⃣ Could be appropriate to begin with tapering this year.
„My view is that the „substantial further progress“ test has been met for inflation. There has also been clear progress toward maximum employment. At the FOMC’s recent July meeting, I was of the view, as were most participants, that if the economy evolved broadly as anticipated, it could be appropriate to start reducing the pace of asset purchases this year.“
3️⃣ Dovish: The timing and pace of the coming reduction in asset purchases will not be intended to carry a direct signal regarding the timing of interest rate liftoff.
4️⃣ Inflation has reached 2 percent and is on track to moderately exceed 2 percent for some time.
So what did we get here? Well the market with a drastic sell-off of the US-Dollar and indicies rallied due to the hope that liquidity will still be provided, probably because the market has expected to see tapering until Q1 of 2022 and has priced that in.
However, for me personally all this is not really a dovish, more like a mixed statement that has dissapointed US-Bulls as things are not progressing as fast as expected. If data from the U.S. are good this week we could see more US-DOLLAR bulls taking action to push price up.
I will keep it slow this today as we get to see the Non-Farm-Payrolls, which will probably have a very strong impact in the market as market-players will evaluate the probabillity of more hawkish statements in the future.
We have often see strong moves after these vacuous statements which then got reversed quickly within a few days, which is why I want to observe price-action first also because the dovish news have pushed many pairs into resistance-zones and so good spots to follow the current trends.
Example: AUD/USD 👉https://www.tradingview.com/x/FqcCdCbO/
LEAVE A LIKE AND A COMMENT - I appreciate every support! =)
Peace and good trades
Irasor
Wanna see more? Don`t forget to follow me

potential DXY movementsI made some significant loss this week so I decided to check my DXY analysis seriously before the big US events...
In general, if the market moves healthily, it should really move towards what I initially thought - maybe I was just waiting too impatiently this week!
On weekly chart like previously spotted, the beautifully formed W chart on the weekly should sustain some stable uptrend movement for the DXY overall in the coming weeks (since mid June), and currently it simply is at the point where it hit the previous high and made a higher high (93.724) , so facing the resistance it decided to have a correction moment.
On daily it dropped sharply this week and broke previous key level on my chart 92.92 - and then started dancing around this figure and has not yet managed to float above 93 again.
Downward movement - there's a mini rising wedge alike formation and the current price is close to the lower edge, with a bit more room to move down further around 92.7 which around another previous support zone as well as 20MA daily. So this area should provide some nice spring affect letting DXY to move upward agressively - providing tomorrow/Friday's news are positive to the dollar.
Further downside could also be a potential if DXY is getting really seriously bearish, that is to the point of 92.177 which I don't think it will happen. I do however believe that once it reaches to the higher high again, it will make another high around 93.866 (and higher) then drop for another fall, and that fall could be significant one. (therefore finger cross NOT to happen right now this week!!)
My current other pairs analysises are based on the possibility that DXY will start bouncing back up from today regardless of the news impact as in many cases people react int the market using news events simply as catalyst.
NOTE: I do not trade DXY.
Haven't close any of losing trades yet (except those being stopped out...)

DXY (US-DOLLAR) at crucial ZONE!Hey t radomaniacs,
DXY trying to break the trendline 👉
snapshot
The US-DOLLAR is moving very slowly and is dancing at the 4-H-Trendline after an attempt to break through.
Watch this level carefully as this is the quiet before the storm.🙏
LEAVE A LIKE AND A COMMENT - I appreciate every support! =)
Peace and good trades
Irasor
Wanna see more? Don`t forget to follow me

Possible consolidation moves this weekDXY had its final victory on Friday after a roller coaster alike days of moves last week.
What I think is that it has reached to a temporary level of bottom and now should continue up after a few days of consolidation before heading further north for at least next few weeks.
For this week I don't see any major economical data that can influence the US movement, so the market response should be mild and an easy consolidation phase. DXY at the moment requires a bit of correction by the look of its RSI on lower time frames.
The correction should be not significant but may hit the daily 20MA which is around 92.48. And If dollar gets weaker, it can hit to the bottom of the bullish pennant formation which is roughly around 91.92.
GL and safe trading

possible going upDXY had a weak week last week till the last day which saved it from sinking further.
The RSI on weekly is still intact above 50 (51.3+), daily is on the way back to 49 so there' might be some good long momentum to be expected in the next day or few more.
The immediate resistance is very strong, at 92.530, which is not only multiple weeks lows and highs (hence having become a very strong resistance), but also it is close to 20MA on daily chart.
My expectation is that it will resume going up for a bit more time hitting on the resistance, and then going down and up but above 91.8
There's lots of US economy data releases this week, so anything can happen.
Scenario 1: it rises up above 92.53, that opens the door for it rise back up again to challenge previous high of 93.2 and 93.43;
Scenario 2: it going back down and revisit 91.8, 91.5 and abysmal bottom.
Note: I don't trade DXY. It's my base analysis for other pairs.
GL and safe trading for this week.

my last long debateI am having nasty red figures across my accounts this week, - having dropped my last week's analysis and been wrong on DXY directions since the beginning.... And it got worsened by the negative US economy data day by day
This is a simple analysis based on Fibs and historical support/demand zones.
If us dollar still can't find buyer at this level (91.83) it will then fall to 91.65 without doubt. And that would mean a super negative return for me this week, not good! :D ^_^ (Note: I don't trade DXY)
Tomorrow's Friday, and also the last day of July, so let's see whether black magic exists...
GL

analysis revisit - still going upI expected DXY to go up yesterday impatiently having discovered that it had not breached the daily 20MA in the past week, only a few hours before it got breached ruthlessly. :D But not yet convincingly broken.
Today I'm watching closely on DXY again as there'll be many dances throughout the day.
My personal opinion on this one is to stick with what I spot yesterday and consider it going up regardless of the FOMC statement, if it does mention anything about tapering we can expect an acceleration and thats all.
I have redrawn the trend lines as above. Not necessary to explain again here.
Just that - Let's trade carefully with good risk assessment, be responsible to your money and yourself.

going upseems there's no more down beating drum for DXY (as far as I believe).
it stayed above 20MA on daily in the past whole week whenever it got the chances but simply didn't break through. On 4H it also showed similar act against 100MA.
it has now reached to the very edge of the lower end of newly formed rising channel so I expect it to rise if no major news event hits on it.
GL

Shoot up Depends on this afternoon's US data, it may either break the trend or support it back up significantly
It's near the edge of previously formed ascending triangle and close to a formation of W pattern on daily chart. If US data is not that bad, I expect the trend line not to be breached.
Note: I do not trade DXY. GL.

rise back up or consolidation for several daysIt's a nice W on weekly chart, and completed a 0.5 fib retracement/correction in a day against weekly gains. I expect the DXY to go back up very quickly within this week. It may drop a bit to 92.168 again but I wish it not lower which invalidates my analysis.
I also expect it to be a quiet Monday and if goes further may experience consolidation for further few days, but hopefully it jump back up above 92.407 and resume it's recovery.
Note: I do not trade DXY and only review it for other tradng pairs. GL all.

ranging or going up?I use DXY only for analysing other pairs. Yesterday's impulsive rise did not break 91.905 which is high of the ranging zone, so I suspect the consolidation will continue (may be up to Thursday). It can go down if falls below 91.663 again and breach 91.500 which I doubt seriously consider the recent two failures of attacking the 91.530 area. So that leaves me to only believe dollar will go stronger in the week ahead. It's also tough for it to break 91.905 though, but if it does break, I'll have to welcome it at 92.143 and say sorry to pound and euro (I was bullish on Euro and GBP, now have to follow the trend although still believe the glory will be back in the coming weeks)
Note: In the range, higher lows and lower highs have been created although not convincing, that to me is another confirmation of dollar going up, but we never know what happens till the moment when it happens :D :D

DOLLAR INDEX DXY - H4 - SLOWLY BUT SURELY WE RISEDollar Index - H4 - Steady and consistent uptrend on the hourly timeframe on DXY. We're expecting a dip early on next week then a strong rally later on in the week.

USDOLLAR aka DJGday Guys. It's Friday.
Today we analyze USDOLLAR Index. The main reason we analyzing this pair, because we would like to know the current condition of USD Currency performance.
We see on the USDOLLAR or DJ at the moment, it was created an Extreme Demand Zone (EDZ) on May 10 at 11655. This the starting point bullish trend slowly build-up which is we getting confirmation that EDZ was tested and rejected three times on May 18, 21 & 25 at 11659. From here we getting more confirmation of the bullish trend.
Zoom in to Hourly Timeframe, We see a choppy Range EDZ at 11674 and ESZ at 11756 but clearly showing that bullish trend still in control. Currently, the price was inside of the LRZ, and the price movement creating a beautiful HiLow market structure.
What we projecting here is, the price will continue bullish which is the first target will be 11723 at MRZ, the next 11742 at URZ, and the Third at 11761 ESZ.
If this happens, most likely USD getting stronger and stronger. Based on recent NFP, fundamentally data release May data higher than April data. Here we able to see that the US economy is improving slowly.
If the USD gets stronger what gonna happen with XAUUSD, GBPUSD, EURUSD, USDJPY, USDCHF, USDCAD, AUDUSD, NZDUSD?
Let's see what happens next. Cheers
* Educational and Learning purposes only. No Buy/Sell recommendation. This is not investment advice.


after pullbackprice has broken strong resistance zone which turned our support
after the retracement, i expect a nice move to the upside

