USDT.D is poised for a quick collapseAltcoin season is just around the corner, with all the new USDT being printed to pump altcoins and BTC realizations to further spill over to other assets. USDT.D is waiting for a huge collapse and fall into the 2% area. Let the altseason begin!
Horban Brothers.
USDT-D

USDT going under water.Check USDC reports backed by black rock. If you are holding USDT please please convert them into USDC. Check my bio to know more.

Bitcoin is on critical level be careful Bitcoin is currently testing a critical resistance level, which is a price point where it often encounters significant selling pressure. This level acts as a barrier, and if the price successfully breaks above it, it could signal strong bullish momentum in the market. Such a breakout would likely attract more buyers, leading to notable upward price movements. On the other hand, if the resistance holds, Bitcoin might face a pullback or consolidation. Therefore, it’s essential to monitor the price action closely at this level, as it could indicate the next significant move in Bitcoin's trend.

RAYUSDT is breaking out!RAYUSDT is breaking out!
The current price is $5.66, with a target price of $7.90, representing a potential gain of 40%+. The Bullish Flag pattern has confirmed a breakout, indicating a strong upward momentum. This setup suggests that RAYUSDT is poised for a significant price surge. The breakout above the flag's resistance level confirms the bullish trend. We're confident in our analysis, and this could be a lucrative trading opportunity. Keep a close eye on RAYUSDT, as it's ready to moon! Get ready to ride the bullish wave!

ARBUSDT is poised for a massive breakout!ARBUSDT is poised for a massive breakout!
The current price is $0.89, with a target price of $2.20, representing a potential gain of 150%+. The Support Resistance retesting is now completed, indicating a strong bullish reversal. This setup suggests that ARBUSDT is ready to surge towards our target price. The retest of the support level has confirmed the strength of the bullish trend. We're confident in our analysis, and this could be a lucrative trading opportunity. Keep a close eye on ARBUSDT, as it's preparing for a potential price explosion!. Get ready to ride the bullish wave!

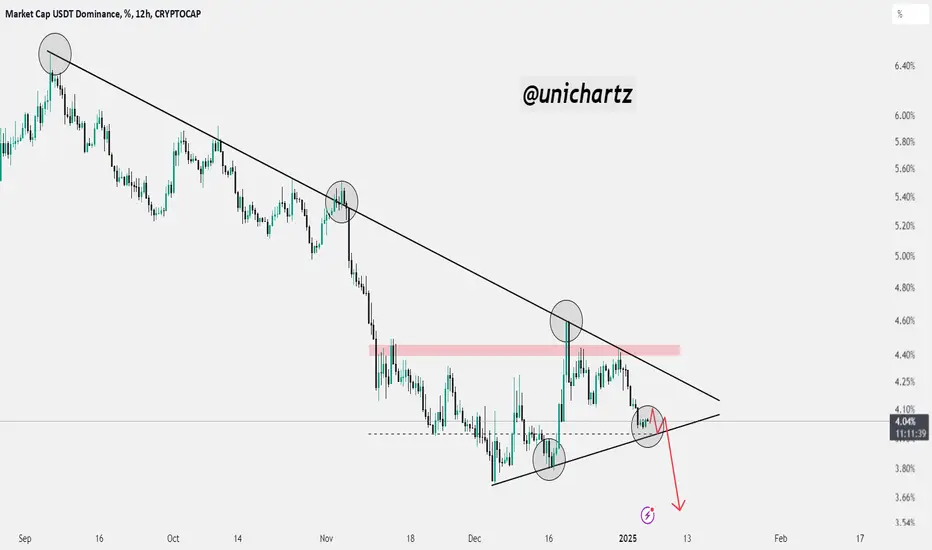
USDT Dominance at Make-or-Break Zone – Watch for Altcoin Moves!The chart shows a clear descending triangle pattern in the USDT dominance (USDT.D), with the dominance steadily declining and forming lower highs along a downward trendline.
This indicates weakening demand for stablecoins, which often correlates with increased risk appetite in the market as investors shift their funds from stablecoins to altcoins.
"JTO/USDT Breakout Imminent: 60% Upside Potential"The JTO/USDT chart shows a symmetrical triangle, signaling a potential breakout. If bullish, the target is a 60% gain at 5.04 USDT. Watch for volume confirmation to validate the move. Key levels are support at 2.95 USDT and resistance at 3.25 USDT. To manage risk, set a stop-loss below the lower trendline.

Dogegov ($DOGEGOV): Awaiting Entry for Promising GainsI spend time researching and finding the best entries and setups, so make sure to boost and follow for more.
Dogegov ( GATEIO:DOGEGOVUSDT ): Awaiting Entry for Promising Gains
Trade Setup:
- Entry Price: $0.11540 (Pending Activation)
- Stop-Loss: $0.08127
- Take-Profit Targets:
- TP1: $0.16975
- TP2: $0.25723
Fundamental Analysis:
Dogegov ( GATEIO:DOGEGOVUSDT ) is a new crypto project that blends meme coin appeal with governance utility. This unique positioning sets it apart in the market, providing both community engagement and real-world use cases. As a newly launched token, GATEIO:DOGEGOVUSDT benefits from early adopter enthusiasm and growing interest from retail investors.
Tokenomics Overview:
- Total Supply: 10 billion $DOGEGOV tokens.
- Unique Features: Governance mechanisms that allow holders to vote on project upgrades and decisions.
- Initial Distribution: Focused on decentralized exchange (DEX) liquidity pools to ensure smooth trading.
Technical Analysis (Daily Timeframe):
- Current Price: $0.11826
- Moving Averages:
- 20-EMA: $0.11000
- 50-EMA: $0.10500
- Relative Strength Index (RSI): Currently at 62, signalling strong bullish momentum.
- Support and Resistance Levels:
- Support: $0.11500
- Resistance: $0.12000
The price action suggests GATEIO:DOGEGOVUSDT is consolidating around key levels, with a potential pullback to $0.11540 to activate the entry. A breakout above $0.12000 could confirm bullish momentum toward the take-profit targets.
Market Sentiment:
Community engagement on platforms like Twitter and Discord indicates growing interest in $DOGEGOV. Early adoption enthusiasm is driving trading volume, with sentiment leaning bullish as the project gains traction.
Risk Management:
The stop-loss at $0.08127 minimizes downside risk, while TP1 offers a **47% return**, and TP2 provides an impressive **123% potential upside**. This setup is designed for traders seeking both short- and mid-term gains.
Key Takeaways:
- GATEIO:DOGEGOVUSDT combines meme coin appeal with governance functionality, providing a unique opportunity in the crypto market.
- The trade setup offers excellent risk-to-reward ratios, making it ideal for traders looking to capture the early stages of a promising project.
- Waiting for the entry at $0.11540 ensures optimal positioning for the expected move.
When the Market’s Call, We Stand Tall. Bull or Bear, We’ll Brave It All!
*Disclaimer: This analysis is for informational purposes only and does not constitute financial advice. Traders should conduct their own due diligence before making investment decisions.*

An additional argument for the alt season.Hi. I'll duplicate someone else's observation that a ‘bad cross’
of EMA 200 and EMA 50 has formed on the weekly chart of
the total dominance of USDT and USDC. And it was back in December.
This is a very good argument for TOTAL3 to start getting its share
of capitalisation in 2025.
Gosh, how many conditions are required. Market, political, sentiment, etc.

Support around 97461.86 is the key
Hello, traders.
If you "Follow", you can always get new information quickly.
Please click "Boost" as well.
Have a nice day today.
-------------------------------------
When USDT is moving sideways, USDC seems to be leading the coin market in the short term by gapping up.
For the altcoin bull market to start, BTC dominance must remain below 55.01 or show a downward trend.
USDT dominance is expected to touch around 2.84 at the most.
If it touches around 2.84 and starts to rise, the coin market is expected to turn into a downtrend.
If USDT dominance rises above 4.97, a sharp decline is expected in the coin market.
After that, the trend of the coin market is expected to be determined depending on whether it is supported or resisted around 4.97.
-
(NAS100USD 1D chart)
The point to watch is whether NAS100USD can rise above the support zone and be maintained.
The high point boundary zone is likely to be applied as a resistance zone, but if it breaks through upward, it is likely to create a new upward wave.
--------------------------------------
(BTCUSDT 1D chart)
If it receives support near 97461.86, it is expected to turn into a short-term uptrend.
However, USDT must show a gap-up trend.
If not, it will fall again.
You should also check if the BW and DOM indicators rise above 0 and if the candle's Body color turns green.
Confirming support is a tedious and difficult task that requires checking the movement for at least 1-3 days.
-
The point of interest is whether it can receive support near 101947.24 around January 10, the next volatility period.
If it falls, it is important to see whether it supports the important support and resistance area of 93576.0-94742.35.
-
Thank you for reading to the end. I hope you have a successful transaction.
--------------------------------------------------
- Big picture
I used TradingView's INDEX chart to check the entire range of BTC.
(BTCUSD 12M chart)
Looking at the big picture, it seems to have been in an upward trend since 2015.
In other words, it is a pattern that maintains a 3-year upward trend and faces a 1-year downward trend.
Accordingly, the upward trend is expected to continue until 2025.
-
(LOG chart)
Looking at the LOG chart, you can see that the upward trend is decreasing.
Accordingly, the 46K-48K range is expected to be a very important support and resistance range from a long-term perspective.
Therefore, I expect that we will not see prices below 44K-48K in the future.
-
The Fibonacci ratio on the left is the Fibonacci ratio of the uptrend that started in 2015.
That is, the Fibonacci ratio of the first wave of the uptrend.
The Fibonacci ratio on the right is the Fibonacci ratio of the uptrend that started in 2019.
Therefore, this Fibonacci ratio is expected to be used until 2026.
-
No matter what anyone says, the chart has already been created and is already moving.
It is up to you how to view and respond to it.
Since there is no support or resistance point when the ATH is updated, the Fibonacci ratio can be appropriately utilized.
However, although the Fibonacci ratio is useful for chart analysis, it is ambiguous to use it as a support and resistance role.
The reason is that the user must directly select the important selection points required to create the Fibonacci.
Therefore, it can be useful for chart analysis because it is expressed differently depending on how the user specifies the selection point, but it can be seen as ambiguous for use in trading strategies.
1st: 44234.54
2nd: 61383.23
3rd: 89126.41
101875.70-106275.10 (when overshooting)
4th: 134018.28
151166.97-157451.83 (when overshooting)
5th: 178910.15
-----------------

what can we find about USDT's dominance?CRYPTOCAP:USDT.D
✅ Tether Dominance has also reacted to the 4.40 supply range once again and has broken its short-term uptrend line 👏👏
✅ Currently, with the breakdown of the 4% support, it can move towards the major support of 3.73 again, and with its breakdown, a new downward leg for Tether Dominance will begin 👌
✅ The major supply range for Tether Dominance is currently between 4.40 and 4.60 👍
⚠️ Disclaimer:
This is not financial advice. Always manage your risks and trade responsibly.
👉 Follow me for daily updates,
💬 Comment and like to share your thoughts,
📌 And check the link in my bio for even more resources!
Let’s navigate the markets together—join the journey today! 💹✨


The breakdown in USDT.DThe breakdown in USDT dominance (USDT.D) suggests a potential market sentiment shift favoring altcoins. A declining USDT typically indicates money flowing out of stablecoins like USDT and into riskier assets, including altcoins. With the bearish breakout targeting 3.71%, this could signal increased buying interest in altcoins as investors move capital into the broader crypto market. However, traders should monitor key support levels for confirmation and watch for potential reversals in USD that could impact altcoin momentum.

USDT.D Update. USDT dominance (USDT.D) appears to form a descending triangle or wedge pattern, with two converging trendlines indicating a potential breakdown.
The upper trendline is descending, indicating consecutive lower highs.
The lower trendline is relatively flat, but rising slightly.
USDT.D is approaching the lower trendline, indicating potential support.
The path drawn indicates a potential breakdown below the lower trendline.
Downward continuation is anticipated in the orange zone (3.40%–3.10%).
Resistance: ~4.20%
Support: ~3.90% and orange zone around 3.40%–3.10%
If USDT dominance falls, it usually suggests that traders move capital from stablecoins (USDT) to riskier assets like Bitcoin or altcoins, indicating a potential bullish sentiment in the broader crypto market.
Let me know if you’d like further assistance or adjustments!
DYOR. NFA

SOL situationCOINBASE:SOLUSD
It has currently reached the ceiling of its descending channel, which can grow to the following levels as a mineral step if it breaks the ceiling of the channel and the resistance of $210:
230, 245, 264
⚠️ Disclaimer:
This is not financial advice. Always manage your risks and trade responsibly.
👉 Follow me for daily updates,
💬 Comment and like to share your thoughts,
📌 And check the link in my bio for even more resources!
Let’s navigate the markets together—join the journey today! 💹✨

DOGE going to the moon? BINANCE:DOGEUSDT had a good floor on the 0.30 demand range on the daily time frame and has now broken its short-term downtrend line and, with the 0.35 resistance broken, it can continue to grow in the short term to the following levels:
0.38, 0.42, 0.46
Dogecoin has had a good price and time correction and can move towards the historic high of 0.74 by breaking the 0.48 resistance 👌
⚠️ Disclaimer:
This is not financial advice. Always manage your risks and trade responsibly.
👉 Follow me for daily updates,
💬 Comment and like to share your thoughts,
📌 And check the link in my bio for even more resources!
Let’s navigate the markets together—join the journey today! 💹✨

XRP ShortThe last two shorts I've taken on this coin have given me profit to walk away with before stopping me from taking the bigger swing I am looking for. I am happy to keep shorting until my target is met. This coin may have a future, but not right now IMO.
In short, I haven't lost yet.
This is just chop. Dubai isn't sending this to the moon and more adoption pumps are coming on the way down
I will stick to my narrative until the market says otherwise
Stay safe in this bear market and enjoy it. We won't get one like this for a very long time, if ever.
PS. Leave your immaturity to yourself, you won't get a response from me just because you don't agree or you're upset that I'm speaking the truth and won't be invested like you want to so I can lose along with 90% of the market.

Next Volatility Period: Around January 10
Hello, traders.
If you "Follow", you can always get new information quickly.
Please click "Boost" as well.
Have a nice day today.
-------------------------------------
(USDT 1D chart)
USDT is maintaining a gap downtrend.
The gap downtrend is a sign that funds have flowed out of the coin market.
(USDC 1D chart)
I think that the price defense is being done in the short term because USDC is maintaining a gap uptrend.
If USDT continues to maintain a gap downtrend and USDC moves sideways or gaps down, the coin market may fall significantly, so be careful when trading.
-----------------------------------------
(BTCUSDT 1D chart)
USDT is showing an upward trend while maintaining a gap downtrend.
It is likely that this is the last upward movement before the downtrend, so you should think about how to respond to the downtrend.
In order to turn into a short-term uptrend over time, it needs to be supported in the 95863.11-97461.86 range or higher.
If not, it will eventually fall.
-
USDT is one of the important stablecoins that support the coin market.
Since USDT is a stablecoin used worldwide, it is a fund that has a big impact on the coin market.
-
93576.0, 94742.35 are important support and resistance points.
Therefore, if the price can be maintained around 93576.0-94742.35, the coin market is expected to show a large increase when USDT shows a gap increase.
If it falls below the 92792.05 point and shows resistance,
1st: 87.8K ~ 89K
2nd: M-Signal on the 1W chart
You should check for support near the 1st and 2nd above.
-
Even if it rises above the 93576.0-94742.35 section and shows support, it must rise above the 101947.24-106133.74 section, which is the high point boundary section, to continue the upward trend.
If not, it will fall again, and at this time, the 93576.0-94742.35 section will play an important role as support and resistance.
-
As I mentioned earlier, the key is whether it can develop into a movement to form a bottom section.
To do that, it needs to meet the HA-Low indicator.
Since the next volatility period is expected to be around January 10 (January 9-11), we need to see if the HA-Low indicator is generated after the volatility period.
-
Thank you for reading to the end.
I hope you have a successful trade.
--------------------------------------------------
- Big picture
I used TradingView's INDEX chart to check the entire section of BTC.
(BTCUSD 12M chart)
Looking at the big picture, it seems to have been maintaining an upward trend following a pattern since 2015.
In other words, it is a pattern that maintains a 3-year bull market and faces a 1-year bear market.
Accordingly, the bull market is expected to continue until 2025.
-
(LOG chart)
Looking at the LOG chart, you can see that the upward trend is decreasing.
Accordingly, the 46K-48K range is expected to be a very important support and resistance range from a long-term perspective.
Therefore, we expect that we will not see prices below 44K-48K in the future.
-
The Fibonacci ratio on the left is the Fibonacci ratio of the uptrend that started in 2015.
In other words, it is the Fibonacci ratio of the first wave of the uptrend.
The Fibonacci ratio on the right is the Fibonacci ratio of the uptrend that started in 2019.
Therefore, it is expected that this Fibonacci ratio will be used until 2026.
-
No matter what anyone says, the chart has already been created and is already moving.
How to view and respond to this is up to you.
When the ATH is updated, there are no support and resistance points, so the Fibonacci ratio can be used appropriately.
However, although the Fibonacci ratio is useful for chart analysis, it is ambiguous when used as support and resistance.
This is because the user must directly select the important selection points required to create Fibonacci.
Therefore, since it is expressed differently depending on how the user specifies the selection points, it can be useful for chart analysis, but it can be seen as ambiguous when used for trading strategies.
1st : 44234.54
2nd : 61383.23
3rd : 89126.41
101875.70-106275.10 (Overshooting)
4th : 134018.28
151166.97-157451.83 (Overshooting)
5th : 178910.15
-----------------

$SOL Price UpdateSolana is eyeing a massive 120% rally to $425, surpassing its $258.42 resistance! The current price is $193.59 +2.26%.
Will it hit a new ATH? Let us know!

WIF/USDT: DOUBLE TARGET SETUP - 160% POTENTIAL MOONSHOT
Technical Analysis:
- Current price: 1.917 USDT
- Strong support level forming at trendline confluence
- Significant volume spike indicating potential reversal
Entry Strategy:
✅ Strategic Entry: 1.500 USDT
- Key historical support zone
- Trendline support confluence
- Oversold conditions on multiple timeframes
Target Projections:
🎯 Target 1: 2.930 USDT (95% ROI)
- Major resistance level
- Previous market structure
- Key psychological level
🎯 Target 2: 3.918 USDT (161% ROI)
- All-time high retest zone
- Major fibonacci extension level
- Huge potential reward zone
Risk Management (CRITICAL):
⚠️ Stop Loss: -5% below entry
- Clear invalidation point
- Protected by major support
- 1:19 and 1:32 Risk-Reward ratios
Key Catalysts:
- Major trend line support holding since August
- Volume profile suggesting accumulation
- Multiple timeframe alignment
- Clear market structure for upside
Trading Plan: 🚨
1. Scale in near 1.500 USDT
2. First take-profit at 2.930 (50% position)
3. Trail stops after first target
4. Hold remainder for moonshot target
⚠️ Important Notes:
- High-conviction multi-target setup
- Patience required for entry
- Volume confirmation essential
- Scale-in approach recommended
🔔 Remember:
- DYOR (Do Your Own Research)
- Never risk more than you can afford
- Set proper position sizes
- Follow your trading plan
#Crypto #WIF #TechnicalAnalysis #SpotTrading #CryptoGems #MoonShot 🚀
Would you like me to break down any specific aspect of this analysis further?

Dreams that we measure with logic 2025; USDT.D BTCUSDT BTC.D Logic says; Coordinates to avoid wandering anxiety; Knowledge, experience and analysis.
Feeling says; Whatever logic says...
USDT.D
D-W; Bearish Flg - Inverted Cup and Handle ( The downward movement is confirmed in my
opinion)
BTCUSDT
D-W; Bullish Flag (The upward movement is confirmed in my opinion)
BTC.D
Bitcoin Dominance has just pulled back to its bearish flag trendline, and will fall.
Altcoins will kiss the moon and pass it.

Whether the bottom section will be formed is the key
Hello, traders.
If you "Follow", you can always get new information quickly.
Please also click "Boost".
Have a nice day today.
Happy New Year.
-------------------------------------
(USDT 1D chart)
USDT appears to have turned into a gap downtrend.
If it does not rise quickly, the coin market is expected to show a sharp decline.
(USDC 1D chart)
Fortunately, USDC is maintaining a gap uptrend, so there seems to be a possibility of price defense to some extent.
However, since USDC has a lower influence on the coin market than USDT, if USDT maintains a gap downtrend, the coin market is expected to eventually show a decline.
What we need to do is check the stop loss point of the coin (token) we currently hold rather than increasing new transactions and think about how much we should cut loss.
(BTCUSDT 1D chart)
The point to watch is whether the movement of BTC is as updated last time.
If the HA-Low indicator is created, it means that the current wave is finished and a new wave is starting, so whether there is support is an important key.
There is a possibility that the HA-Low indicator will fall after being created and show a stepwise downtrend, but the fact that the HA-Low indicator was created means that it is ultimately forming a bottom section, so it is a time to buy.
-
Thank you for reading to the end.
I hope you have a successful transaction.
--------------------------------------------------
- Big picture
I used TradingView's INDEX chart to check the entire section of BTC.
(BTCUSD 12M chart)
Looking at the big picture, it seems to have been following a pattern since 2015.
In other words, it is a pattern that maintains a 3-year bull market and faces a 1-year bear market.
Accordingly, the bull market is expected to continue until 2025.
-
(LOG chart)
Looking at the LOG chart, we can see that the increase is decreasing.
Accordingly, the 46K-48K range is expected to be a very important support and resistance range from a long-term perspective.
Therefore, we do not expect to see prices below 44K-48K in the future.
-
The Fibonacci ratio on the left is the Fibonacci ratio of the uptrend that started in 2015.
That is, the Fibonacci ratio of the first wave of the uptrend.
The Fibonacci ratio on the right is the Fibonacci ratio of the uptrend that started in 2019.
Therefore, this Fibonacci ratio is expected to be used until 2026.
-
No matter what anyone says, the chart has already been created and is already moving.
It is up to you how to view and respond to it.
Since there is no support or resistance point when the ATH is updated, the Fibonacci ratio can be appropriately utilized.
However, although the Fibonacci ratio is useful for chart analysis, it is ambiguous to use it as a support and resistance role.
The reason is that the user must directly select the important selection points required to create the Fibonacci.
Therefore, it can be useful for chart analysis because it is expressed differently depending on how the user specifies the selection point, but it can be seen as ambiguous for use in trading strategies.
1st: 44234.54
2nd: 61383.23
3rd: 89126.41
101875.70-106275.10 (when overshooting)
4th: 134018.28
151166.97-157451.83 (when overshooting)
5th: 178910.15
-----------------

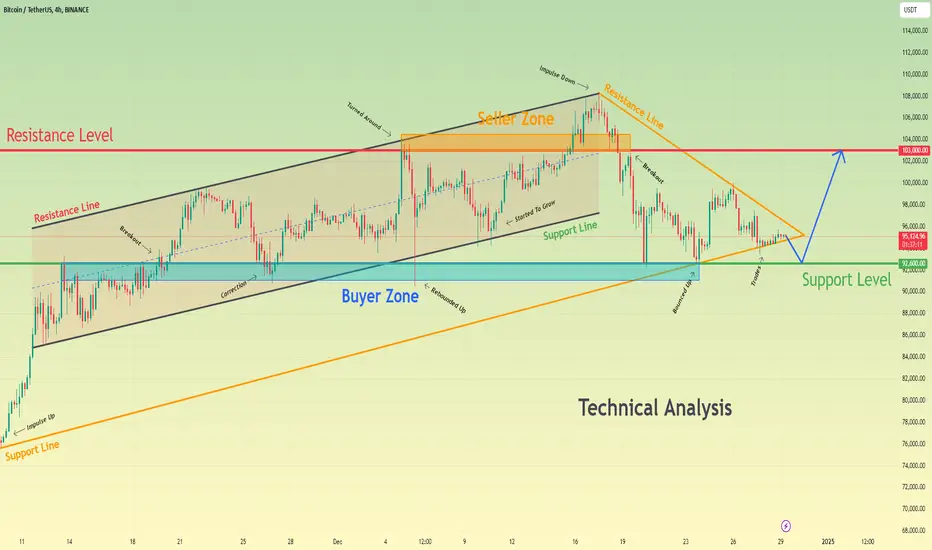
Bitcoin can exit from pennant and then start to grow to 103KHello traders, I want share with you my opinion about Bitcoin. Looking at the chart, we can see how the price started to trades inside the pennant, where it rebounded from the support line and rose almost to the support level, which coincided with the buyer zone. In the pennant pattern, BTC started to grow inside the upward channel, where it broke the 92600 level and then rose to the channel's resistance line, after which made a correction. Next, the price continued to grow and later rose to the resistance level, which coincided with the seller zone and then made a correction movement to the buyer zone. After this, the price continued to move up inside the channel, where it soon reached the 103000 resistance level and broke it. Next, BTC reached the channel's resistance line, which coincided with the resistance line of the pennant, and made a strong impulse down to the support line of the pennant, exiting from the channel and breaking the resistance level. After this movement, the price turned around and started to grow near the support line of the pennant and now I think that BTC can exit from the pennant and fall to the support level. Then it will turn around and start to grow to a 103000 resistance level, which is my TP. Please share this idea with your friends and click Boost 🚀