usdt.dHello, I am Mehdi.
According to the previous analysis, the market has continued to the range we are waiting for. In this area, we should wait for the formation of a pattern to continue the path.
Therefore, it is recommended to keep an eye on the market with a 70% profit margin.
USDT-D

usdt.d 30minHello friends
I am Mehdi, according to the Tether Dominance chart and the full targeting of the previous analysis in the 4-hour timeframe
According to the new analysis, I think the price is expected to reach the range of 4.49
1 Because the 4.57 level was broken with a strong candle in the 4-hour timeframe and now the price is rejecting this level
2 We are at the 382 fibo level
3 RSI divergence
Thank you for supporting me by liking and commenting and sharing this analysis

usdt.d 4hHello friends
I am Mehdi and I wanted to say that if you are currently in profit compared to the position we announced
It is better to have a save profit and move the stop loss to the entry point
I would appreciate it if you support me with likes and comments

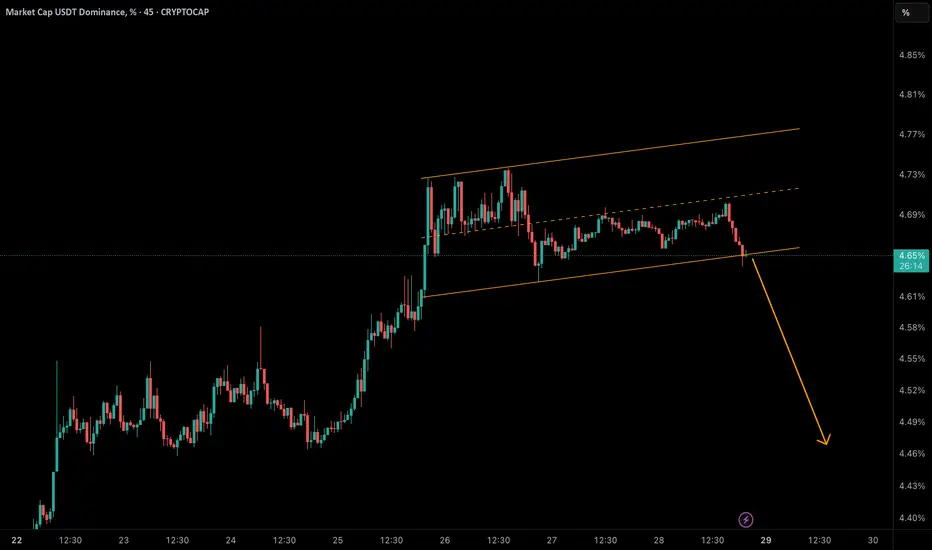
USDT Dominance at a Critical Breakout Point!USDT dominance has touched the bottom of its rising channel near 4.65%.
• 🔻 A breakdown below this support could trigger a correction toward 4.58% → 4.50% → 4.45%.
• 🟢 But if buyers defend this zone and reclaim 4.70%, we may see another push toward 4.75% – 4.77%.
📈 Why it matters: Falling USDT dominance often signals liquidity flowing back into crypto & altcoins, potentially sparking short-term rallies.
USDT Dominance Eyes Continuation After Double BottomUSDT dominance (USDT.B) on the daily timeframe has shown a strong shift in momentum. After breaking the trendline, price action confirmed a double bottom formation, pushing dominance steadily upward. Right now, there’s a small chance of a retracement around the 4.56% area, where order flow could reset before continuation.
Technically, the chart has already posted two lower highs, forming a bullish setup that favors another higher low before moving higher. If dominance keeps climbing, the crypto market may face strong selling pressure—Bitcoin and altcoins could bleed in the coming week.
However, the invalidation point sits below 4.2%. A breakdown from that level would signal weakness, potentially giving relief to Bitcoin and altcoins for an upward move.
👉 Keep an eye on 4.56% for a possible bounce and 4.2% as a key invalidation. The next few sessions may decide whether USDT dominance continues its bullish leg or offers crypto traders a breather.

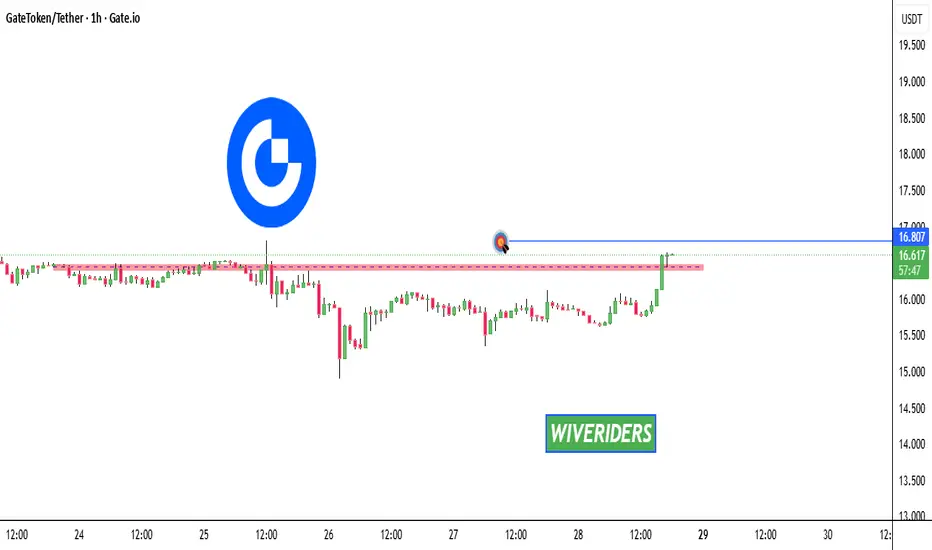
GT Market Update📊 GT Market Update
GT has broken out of the red resistance zone 🔴
The first target is now the green line level 🎯
#USDT.D (4H Chart)#USDT.D
(4H Chart)
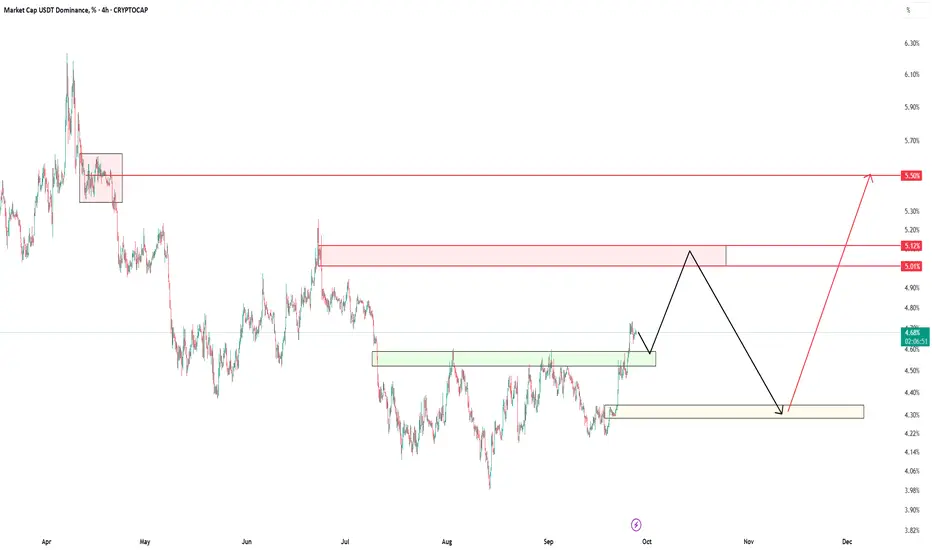
🔹️ USDT Dominance Analysis 🔹️
USDT dominance usually moves in the opposite direction of Bitcoin — when Bitcoin rises, this index tends to fall, and vice versa.
🟢 Green Box (Current Support)
The current support level for USDT dominance is in the green box: 4.60 – 4.50%.
We expect the price to move toward this level first, and after touching it, head toward the red box.
🟥 Red Box (Main Resistance)
The red box is at 5.00 – 5.12%.
This is the first and most important resistance level ahead.
After reaching this level, a correction is expected back toward the yellow box.
🟡 Yellow Box (Key Support)
The yellow box sits at 4.30%, which is a strong support area.
Once this level is tested, a major bullish move in USDT dominance is expected, targeting around 5.50%.
🎯 Final Target
When USDT dominance reaches 5.50%, the crypto market will likely be near its price bottoms.
💡 These bottoms could approximately align with Bitcoin around $85,000 and Ethereum around $3,000.
🆔 @RasoolAhmadi
usdt.d 4husdt.d 4h
🔎 A few notes from the chart:
The chart is located on the PRZ (Potential Reversal Zone) or the harmonic pattern completion zone.
The candles have reached an important resistance zone after rising.
At PRZ, we usually expect a reversal (return to the bottom), especially when it overlaps with Fibonacci levels and the trend line.
It is characteristic that a green rectangle (probably a sell position) has been drawn on the chart, which indicates that we expect a decline.
📌 Conclusion:
Due to the harmonic structure + PRZ support, the probability of a price reversal and a downward move is higher ✅

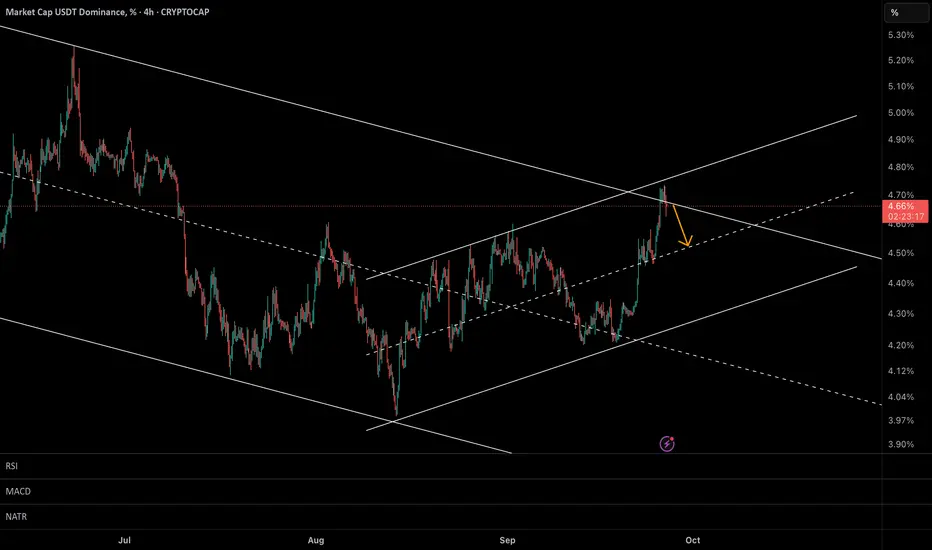
USDT Dominance at a Critical Turning Point–Will Correction BeginIn my previous analysis, I highlighted that USDT dominance had likely completed a 5-wave Elliott structure around 4.60%–4.65%, suggesting that a corrective ABC decline could follow.
That call played out accurately, with dominance stalling right at the projected resistance zone.
🔎 Current Update:
• Price has now hit the top of the larger descending channel as well as the upper boundary of the short-term rising channel → creating a confluence resistance near 4.70%.
• This level remains a high-probability reversal zone.
📊 Scenarios:
• 🔻 Bearish (More Likely):
Rejection from 4.65%–4.70% could confirm the corrective ABC pattern, targeting 4.30%–4.20% next.
👉 This would signal capital rotation back into crypto & altcoins.
• 🟢 Bullish (Alternative):
A confirmed breakout above 4.70% would open the door toward 4.90%, extending pressure on the crypto market.
⸻
📌 Conclusion:
Given the technical confluence, the odds still favor a pullback in USDT dominance, which could give altcoins some room to breathe in the coming sessions.
M-USDT SHORTHello friends 💖
💁♂️ I have chosen a cryptocurrency to put on my watchlist
👉 M-USDT
It may be a good opportunity for a short position
I suggest you have this currency on your watchlist and enter with the structure and trigger at the right place
I think the price of this currency has grown too much and we should wait for a price correction gradually
In any case, I will not enter without seeing the structure and I will not take a short position on this currency
💁♂️ Signs of trend weakness:
The slope of the tops is decreasing
The tops are getting closer
The chart's movement angle is also decreasing and becoming negative
Lower tops are forming
Lower bottoms are forming
⚠️ None of the analysis is a recommendation to buy or sell, but simply my personal opinions on the charts. You can use the charts and choose any that interest you and take a position if you wish.

BTC 110K Low time frame can be the return for Bitcoin📊 Market update low time frame
If there is good news, then BTC should confirm in 4H max.
If btc is able to gain 110K on the low time frame, there is a good chance we can go with BTC to a new uptrend, which could also mean good news for most of the altcoins.
All eyes are on the 10K in the coming time frame for a confirmation.
BTC can make a downtrend move to get volume with a spike to a low time frame, as we know from BTC.
IF BTC moves lower, the low time frame can change to 109800
110K can be the reason for 113K, and a confirmed main trend means a positive BTC
We will follow it step by step.

ETHUSD - Expect a bounce ... now? lets go above ATHLong time no see !
I was in vacations with the cult of the CME Gap that I joined
Soooo, Eth took some logic profits, it was a quasi straight line from 2400 to 4800 (not mentionning that its coming before from under 1500), a 10% correction is totally ok
we are actually in the middle of the last CME GAP, its filling daddy
Dec 2024 high
100 MA 4H
0.5 fib resistance from last low
0.236 is 4K so we still have room to be in denial if it dips more
as you can see thats a lot of convergences, not even talking about BTC, BTC.D, USDT.D, GOLD and all the other tickers aligning perfectly for the big ritual of the big last leg of the big bull run (B.R.B.L.L.B.B.R.) (I know how to make it since those vacations)
Sooo SL is slightly under first bullish Order Block that u can see in this chart @ around 3440, yes sry I can't mess with the levs even with this perfect entry opportunity
TP1 : 7000
TP2 : 9000
TP3 : 11000 (0.618 fib extension)
Will update the TPs if momentum changes
XX
not advise

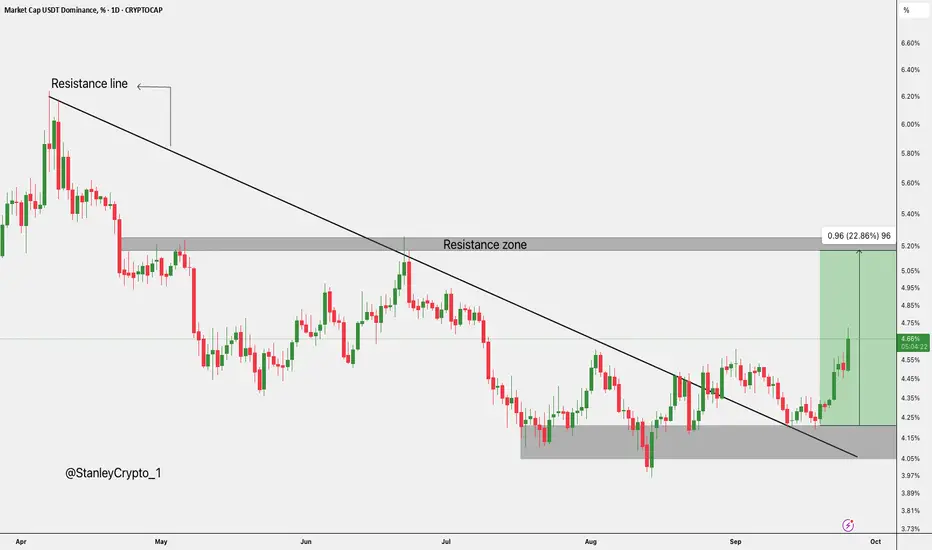
$USDT Dominance: 22% Breakout Potential.CRYPTOCAP:USDT dominance has finally broken free after months of consolidation. It’s now pushing toward the resistance zone around 5% to 5.2%, with a potential 22% upside.
If it holds above that trendline, we could see even more upside in the near future. It’s looking like a solid breakout.
See if it keeps up!
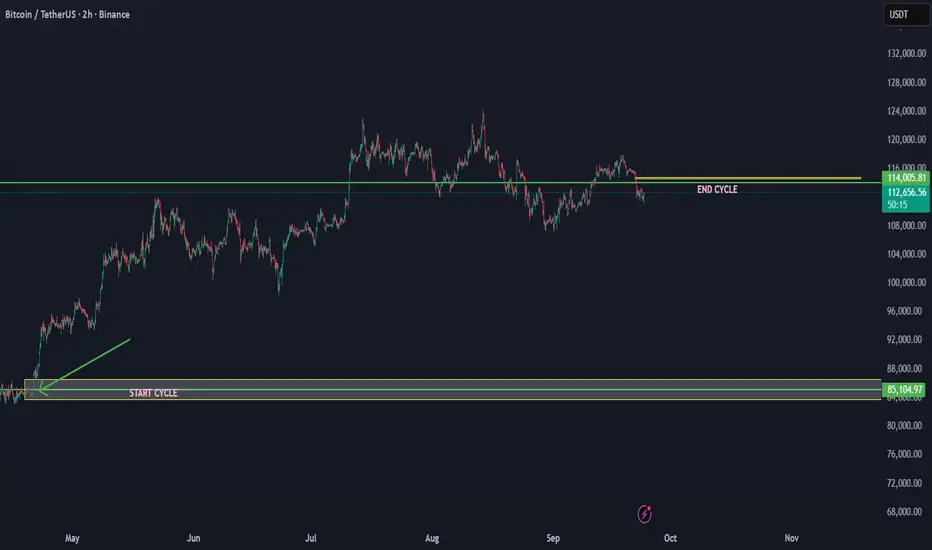
AFTER END OF CYCLE BTC CAN RETURN BELOW 110K - 90K📊 BTC/USDT Market Update
Current Price: ~$113,509
Cycle Recap: From the $84,000 low to the $114,000 high, BTC has completed what looks like an end of cycle phase (as marked on chart).
We did explain here the end of the cycle
There is a high chance in the coming time that BTC will break down below 110K and enter the correction zone.

USDT Dominance Hits Channel Top – Correction Ahead?USDT dominance has reached the top of its channel, completing a potential 5-wave Elliott structure. This suggests that a corrective ABC pattern may follow.
• 🟢 Key Resistance: 4.60% – 4.65%
• 🔻 Expected Correction: toward 4.20% – 4.30%
• 📈 Market Impact: A decline in USDT dominance often means capital flowing back into crypto & altcoins.
If this scenario plays out, we could see altcoins breathing again in the short term.

humaStarting a positive move. Smart buy
863 million at point 1
and
sell at 50%
at number 3
from here about 35%

STABLECOIN SUPERCYCLE CAN SEND AAVE TO $5,000We have a #HVF forming that is yet to breakout.
The fundamental driver is of course stablecoin growth. Namely the ones that the United States allow to dominate in this space. Permissioned quasi CBDC's like USDT and USDC.
So what is AAVE if you don't know;
Aave (AAVE) is a decentralized finance (DeFi) protocol enabling users to lend, borrow, and earn interest on crypto assets without intermediaries through automated liquidity pools.
Liquidity Markets – Users deposit assets into pools to earn yield or borrow against collateral.
Flash Loans – Pioneered uncollateralized loans executable within a single blockchain transaction.
Community Governance – AAVE token holders vote on protocol upgrades, risk parameters, and expansions.
So there we have it ... congrats to hodler's of this protocol that was once called ETHLend.
Theres still plenty meat left on the bone for these next few years.

The BTC cycle that started at 84K is projected end at 114K This is a cycle update for BTC/USDT. Based on the cycle data, the cycle that started at 84K has ended at 114K. This indicates that we are now entering a new major trend breakdown in the cycle. It can take time, but when there is a new uptrend cycle, we will add.
This time frame and action made the end of the cycle that started from 84K
This could mean that btc can enter below 110K in the coming time. We have seen more times in the history of BTC that by the cycle end, the trend breaks down in steps.
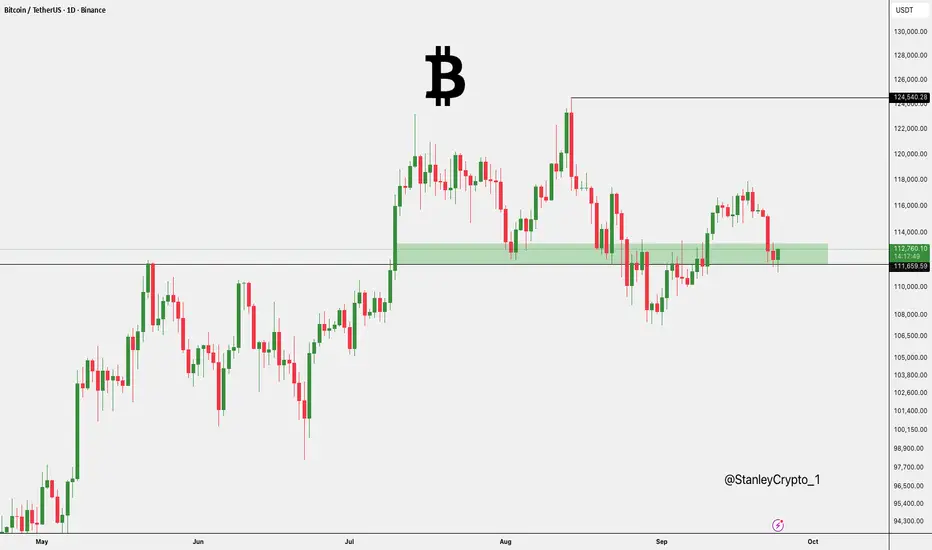
$BTC Testing Key Support.CRYPTOCAP:BTC is holding support around $111,600–$113,500.
If this zone holds, the price could push toward $124,500; however, a breakdown may trigger a deeper correction.
DYOR, NFA
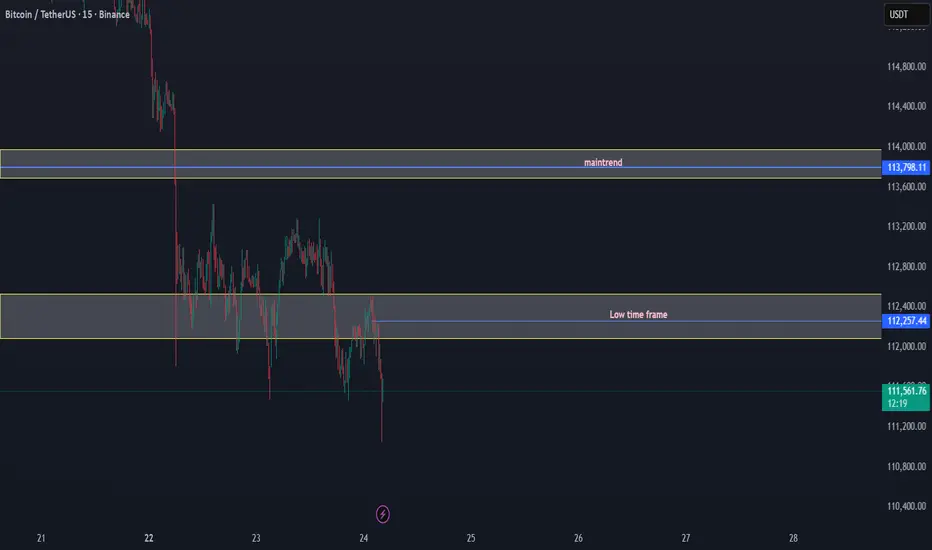
BTC/USDT Breakdown: Loss of Key Levels Confirms Bearish Structur📉 BTC/USDT Market Update
Bitcoin has broken down key structural levels, confirming a bearish outlook in the short to mid-term.
✅ Low Time Frame Support Lost: The $112,083 – $112,531 demand zone has failed to hold, indicating that buyers are losing control on lower time frames.
✅ Main Trend Zone Rejected: The $113,798 – $114,000 supply area acted as strong resistance, and BTC was unable to reclaim this key trend level.
✅ Momentum: Current price action shows continuation to the downside, with sellers stepping in aggressively after repeated failed attempts to sustain higher levels.
Bias: Bearish
As long as BTC trades below $113,800, the market structure favors sellers. Further downside pressure may target the $111,000 – $110,800 range in the near term.
⚠️ Key Levels to Watch:
Resistance: $113,800 – $114,000 (Main trend rejection zone)
Support: $111,000 – $110,800 (Next liquidity pool)
USDT Dominance Hits Major Resistance – What’s Next for Crypto?📊 On the 4H timeframe, USDT dominance (USDT.D) is approaching the 4.60% – 4.70% resistance zone, a level that has repeatedly triggered strong rejections in the past.
🔹 Primary Scenario
A rejection from this resistance is the more likely outcome. If confirmed, it could signal a bullish move for Bitcoin and altcoins as capital flows back into risk assets.
🔹 Alternative Scenario
If USDT.D manages to break and hold above 4.70%, this would indicate risk-off behavior in the market, potentially leading to increased selling pressure on crypto assets.
⚖️ Summary:
• 🔻 Rejection at resistance → Positive signal for crypto rally
• 🔺 Break & hold above 4.70% → Warning of further downside in crypto

BTC Update📊 CRYPTOCAP:BTC Update
After forming a bearish Head & Shoulders pattern, BTC moved down and is now testing a new support level. ⚠️
If this support breaks, the next move could be a breakout of the blue support zone, with the first target at the green line level. 📉

Hype's path to $55BYBIT:HYPEUSDT.P is currently forming a wedge shape pattern, is it indicating that it will break out and follow Path A, the blue path? I'm not so sure, I am sure we'll hit $55 either way.
If we take the red path, Path B, we'll come down to some heaviy support which could give us the fuel needed to get to $55
Out of all of the oscillators I was using, all except the chop zone on the daily mind you, were in bearish mode. So logically one would choose the red Path B right?
I can't wait to see how this plays out, shall we dip some and buy some more BYBIT:HYPEUSDT.P on Path B or experience more of a continuation of the current trendline to $55?
Let me know what you think in the comments, that'ls all for today, let's go HYPE!!! straight to $55!
