USDT DOMINANCE UPDATE (4H)As I mentioned in my previous analysis, USDT.D has pumped strongly into a major supply zone and faced a perfect rejection.
Currently, it looks like we’re setting up for a minor upward retracement before moving towards lower levels.
Key Level to Watch:
4.36% – 4.40% should be considered as the optimal buy zone.
USDT-D

USDT DOMINANCE UPDATEThe market is currently entering a well-anticipated minor bearish phase. Many altcoins have formed bearish price action patterns, and several indicators are signaling that a stronger downward movement may be imminent.
So far, the USDT.D chart has been very reliable, and its daily bearish outlook remains intact. Of course, the market cannot always stay bullish — a correction here is both expected and necessary to maintain balance.
As mentioned in my previous analysis, many alts are already starting to weaken. USDT dominance looks ready to break down a key trendline, which could trigger even more sell-offs. Keep an eye on the 4.50% level — this should be the first area to consider taking profits from short positions.
Bonus: This weekend, a significant amount of staked ETH will be unlocked. Once released, selling pressure is likely, which could lead to a sharp correction in ETH.
Good luck.

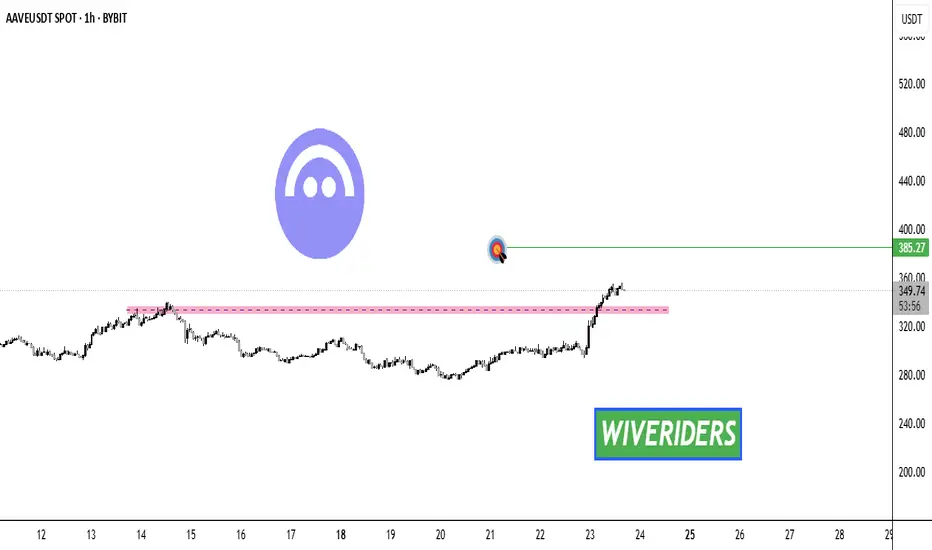
AAVE Breakout Alert! 🚨 CRYPTOCAP:AAVE Breakout Alert! 🚨
CRYPTOCAP:AAVE has broken out of the red resistance zone 🔴✅
The first target is the green line level 🎯
This breakout confirms bullish momentum and could drive further upside if buyers maintain control 💪

#XRP How Long To Reach 3.31 ?#XRP
The price is moving within a descending channel on the 1-hour frame, adhering well to it, and is heading for a strong breakout and retest.
We have a bearish trend on the RSI indicator that is about to be broken and retested, supporting the upside.
There is a major support area (in green) at 2.80, which represents a strong basis for the upside.
For inquiries, please leave a comment.
We are in a consolidation trend above the 100 Moving Average.
Entry price: 2.90
First target: 3.30
Second target: 3.14
Third target: 3.31
Don't forget a simple matter: capital management.
When you reach the first target, save some money and then change your stop-loss order to an entry order.
For inquiries, please leave a comment.
Thank you.

BONKUSDT 4H✅ BONK/USDT — 4H (Binance) | Aug 21, 2025 — Professional Technical Analysis
🔎 Chart Context
• Pair: BONK/USDT
• Exchange: Binance
• Timeframe: 4H
• Current price: 0.00002198
• Price is in a mid-term downtrend, making lower highs and lower lows after rejection from 0.00002877 and 0.00002826.
📊 Key Observations
1. Market Structure
• BONK peaked at 0.00002877 and 0.00002826, then entered a steady decline.
• The current swing low is 0.00002275, with price attempting a short-term bounce.
• Trend remains bearish until the market reclaims higher supply zones.
2. Support & Demand Zones
• 0.00002339 – 0.00002198: Current support block, where buyers are trying to defend.
• 0.00001900 – 0.00001800: Deeper demand zone; main liquidity magnet if current support fails.
3. Resistance & Supply Zones
• 0.00002411 – 0.00002480: Local supply + fair value gap (FVG), likely to act as rejection zone.
• 0.00002740 – 0.00002877: Strong resistance cluster from last highs.
4. Fair Value Gap (FVG)
• FVG sits above 0.00002480 — price may push into this imbalance before resuming the downtrend.
• This is a typical retracement target before continuation lower.
📈 Bullish Scenario (Short-Term Relief Only)
• Price defends 0.00002275–0.00002198.
• A short-term bounce targets:
• TP1: 0.00002411
• TP2: 0.00002480 (FVG fill)
• For a trend reversal, BONK needs a 4H close above 0.00002550 — otherwise, upside remains corrective only.
📉 Bearish Scenario (Higher Probability)
• BONK rejects from 0.00002411–0.00002480 FVG zone.
• Price resumes decline toward:
• TP1: 0.00002200 (recent low)
• TP2: 0.00001900–0.00001800 (major liquidity target)
• Breakdown below 0.00001800 would open deeper extension into 0.00001650.
⚡ Trading Plan
• Short Setup (Preferred):
• Entry: 0.00002411 – 0.00002480 (FVG rejection)
• TP1: 0.00002200
• TP2: 0.00001900
• Stop: Above 0.00002550
• Long Setup (Countertrend, Risky):
• Entry: 0.00002200 – 0.00002198 (demand defense)
• TP: 0.00002450
• Stop: Below 0.00002150
✅ Conclusion
BONK/USDT on 4H remains in a bearish corrective structure, with the most probable path being a short-term bounce into 0.00002480 FVG, followed by a continuation lower toward 0.00001900–0.00001800 demand zone. Only a reclaim above 0.00002550 would shift momentum back in favor of bulls.

ETH, BTC, DXY & USDT.D cross market breakdownEverything explained in the video. Please let me know if there was anything I may have missed!

USDT Dominance – Breakout, Retest & Ready for Next MoveUSDT Dominance has just broken above its descending trendline and successfully retested it as support. After this pullback, the chart suggests a continuation to the upside within the ascending channel.
🔹 Technical Highlights:
• Breakout from the falling trendline confirmed.
• Retest completed around 4.35% → holding as support.
• Price action remains within a short-term ascending channel.
• Next upside target: 4.55% – 4.60% (marked as point G).
📊 Market Implication:
Rising USDT Dominance usually means liquidity flows out of riskier assets (altcoins) into stablecoins. If this uptrend continues, altcoins could face further downward pressure while traders seek safety.
✅ Conclusion:
As long as dominance holds above 4.30–4.35%, the bullish scenario remains intact. A push toward 4.55% is likely the next move.

SHIBUSDT (Daily)🔎 Chart Context
• Pair: SHIB/USDT
• Exchange: MEXC
• Timeframe: 1D (Daily)
• Date: 21 August 2025
This chart shows SHIB trading within a large consolidation range after a significant bearish move earlier in 2025.
📊 Key Observations
1. Macro Structure
• SHIB has been in a sideways range between 0.00001000 (support) and 0.00001597 (resistance) since March 2025.
• The chart highlights this rectangular range, showing repeated liquidity sweeps on both sides.
• Current price: ~0.00001283, sitting in the lower half of the range.
2. Support Zones
• 0.00001160 – 0.00001080 zone: Main demand block, tested multiple times (April, July).
• 0.00001004 – 0.00001028: Deeper liquidity sweep levels; losing this zone risks breakdown.
• These zones are critical for SHIB’s bullish survival.
3. Resistance Zones
• 0.00001362 – 0.00001597 zone: Upper supply boundary of the consolidation.
• 0.00001765 (FVG): Marked upside liquidity gap; a breakout from range would likely target this.
• Beyond that, 0.00001853 – 0.00002000 is the next strong supply zone.
4. Liquidity Behavior
• Below: resting liquidity around 0.00001160 and 0.00001004.
• Above: liquidity pools at 0.00001597 and 0.00001765, making these the primary bullish targets.
• The chart projects both scenarios:
• Bullish breakout above the range toward 0.00001765.
• Bearish breakdown below 0.00001160 toward 0.00001004 or lower.
📈 Bullish Scenario (Higher Probability if 0.00001160 holds)
• SHIB defends 0.00001160 demand and reclaims 0.00001362 mid-range resistance.
• Momentum carries price to:
• TP1: 0.00001597 (range high)
• TP2: 0.00001765 (FVG fill / liquidity sweep)
• TP3 (extension): 0.00001850 – 0.00002000 major supply zone.
• This requires holding above 0.00001160 and rejecting downside liquidity sweeps.
📉 Bearish Scenario (Lower Probability but Risk)
• Price loses 0.00001160 demand with strong volume.
• Next targets:
• 0.00001080 → 0.00001028 (short-term supports)
• 0.00001004 liquidity sweep (major downside magnet)
• A daily close below 0.00001000 confirms a macro bearish breakdown, exposing 0.00000900 and below.
⚡ Trading Plan
• Long Setup (Preferred if support holds):
• Entry: 0.00001160 – 0.00001230 demand zone.
• TP1: 0.00001362
• TP2: 0.00001597
• TP3: 0.00001765
• Stop: Below 0.00001080 or conservative below 0.00001000.
• Short Setup (Only if breakdown confirmed):
• Entry: Retest of 0.00001160 from below.
• TP: 0.00001004 liquidity sweep.
• Stop: Above 0.00001260.
✅ Conclusion
SHIB/USDT Daily is in a consolidation phase between 0.00001000 – 0.00001597.
The most probable scenario is a range-bound accumulation, with bias turning bullish if 0.00001160 holds and price reclaims 0.00001362, targeting 0.00001597 → 0.00001765.
A breakdown below 0.00001160 shifts focus to 0.00001004 liquidity sweep, which would threaten the bullish structure.

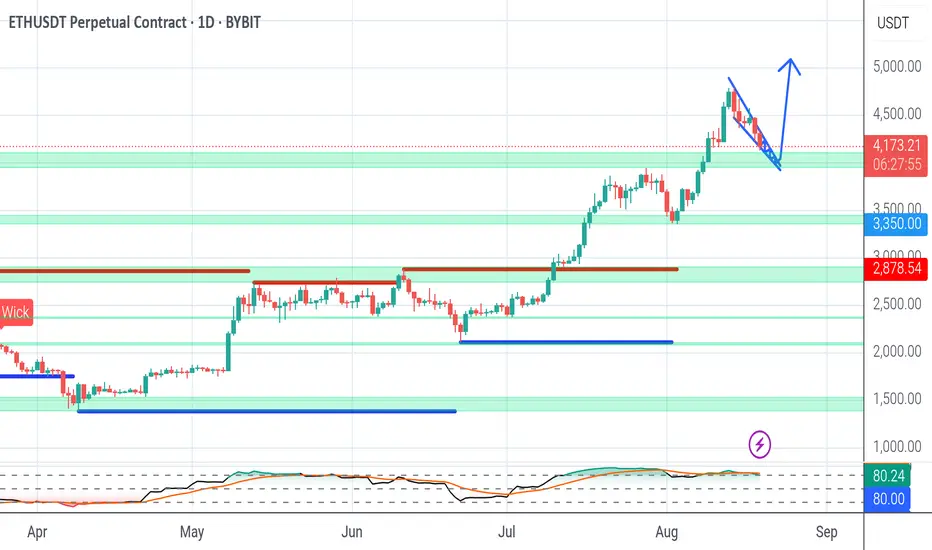
ETH daily chart possible scenarioLooks like we heading towards 3900 strong support zone in coming days and bounce toward new ATH 5k+ in couple weeks. Any thoughts?
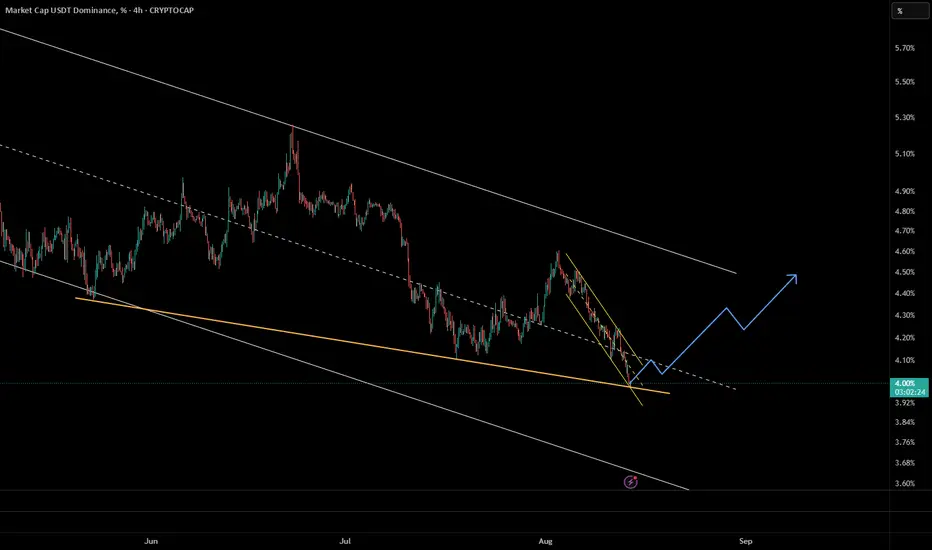
Tether Dominance: Wave B Bounce Before the Next Drop?This 1H chart of USDT Dominance shows the completion of a clear 5-wave impulsive advance, followed by a corrective decline that we can label as Wave A.
Now, signs suggest that Wave A is completed, and the market is preparing for a Wave B bounce.
🔹 Key observations:
• Wave A corrective structure has likely bottomed.
• Wave B is expected to retrace upward, targeting the descending trendline resistance.
• Once Wave B is complete, a Wave C decline is anticipated, continuing the corrective phase.
⚠️ Invalidation: A decisive breakout above the trendline would negate the corrective count and signal a potential bullish extension.
⸻
📌 Summary
Near-term outlook suggests a relief rally (Wave B) toward resistance, followed by a Wave C correction lower, as long as price respects the descending trendline.

LTC Breakout Alert!🚨 CRYPTOCAP:LTC Breakout Alert! 🚨
CRYPTOCAP:LTC is currently testing the red resistance zone 🔴
At the same time, price has formed a double bottom pattern — a bullish reversal signal ✅
If buyers push through this resistance, it could trigger a strong upside move with continuation higher 🎯

AERO Breakout Alert! 🚨 SPARKS:AERO Breakout Alert! 🚨
SPARKS:AERO is currently testing the red resistance zone 🔴
If price breaks out, the first target will be the green line level 🎯
A confirmed breakout would strengthen the bullish outlook and could fuel further continuation to the upside ✅

USDT Dominance at crucial 3.8 percent support level !USDT dominance is hanging around the 4% mark, and history shows it doesn’t spend much time below here. The 3.8% zone has been a strong bounce point—think March 11, 2024, and again late December / late January, both forming a clean double-bottom.
Right now, we could be setting up for the same pattern. If 3.8% holds, a bounce is likely, and we could see dominance climb back toward the 6–6.5% zone before rolling over.
But if it breaks decisively below 3.8%, that would be a first in years and could trigger a larger market shift—possibly a super cycle where BTC runs toward 150–200K.
Historically, late August into September often brings corrections or dumps, so I’m watching closely over the next few weeks.
Bottom line:
3.8% holds → bounce likely.
3.8% breaks → game changes completely.
What’s your take—bounce or break?

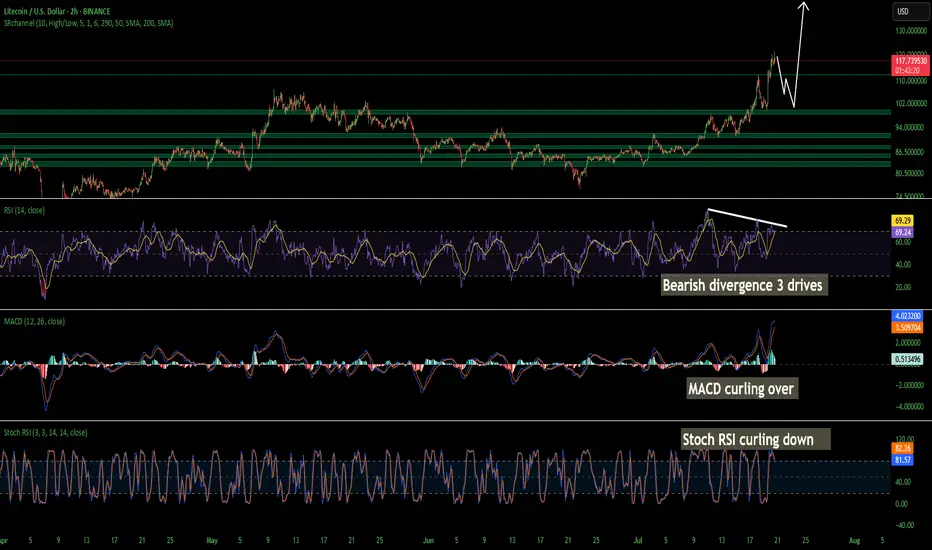
LTC Litecoin Short Term Pull Back Quick and SharpI believe Litecoin Is topping out on the 2 hour. Looks like we may come back down and tap support at around 104 but I wouldn't be surprised a wick hits 100. I have buy orders around 103-106. I am not super confident on a deeper pullback so thats why my buys are there is so i don't miss the dip. Id rather make a little less money than miss a buy in trying to nail the bottom. Litecoin is starting its breakout from a 7 year consolidation and accumulation phase. This should be pretty massive. Litecoin is going to benefit considerably from these new bills that are being signed and many of the favorites in the top 100 will soon disappear!
The time for Litecoin to shine as I have been talking about for years is now. I am almost certain that this is that time. My predictions all still hold if you would like to go read them. I was just off on timing. Timing is the hardest thing to predict especially with how wild this planet has been lately. None of this is financial advice its just my opinion.
#DOGE/USDT | Eyes Bounce from Key Support !#DOGE
The price is moving within an ascending channel on the 1-hour frame, adhering well to it, and is on its way to breaking strongly upwards and retesting it.
We have support from the lower boundary of the ascending channel, at 0.1930.
We have a downtrend on the RSI indicator that is about to be broken and retested, supporting the upside.
There is a major support area in green at 0.1895, which represents a strong basis for the upside.
Don't forget a simple thing: ease and capital.
When you reach the first target, save some money and then change your stop-loss order to an entry order.
For inquiries, please leave a comment.
We have a trend to hold above the 100 Moving Average.
Entry price: 0.2060.
First target: 0.2111.
Second target: 0.2183.
Third target: 0.2264.
Don't forget a simple thing: ease and capital.
When you reach the first target, save some money and then change your stop-loss order to an entry order.
For inquiries, please leave a comment.
Thank you.

Tether Dominance at Double Support – Is the Bull Run in Danger?The market is currently at a critical juncture – any correction from here could signal the end of the strong bullish wave we’ve been riding.
As seen in the Tether Dominance chart, price has reached two key support levels. From this zone, we anticipate a potential strong reversal in the market.
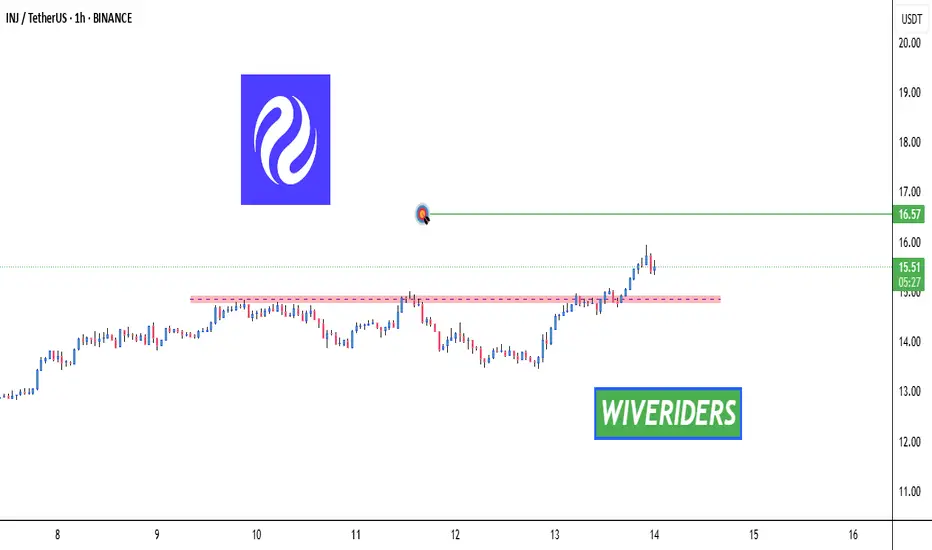
INJ Breakout Update – Bullish Momentum Building! INJ Breakout Update – Bullish Momentum Building! 🔥
INJ has successfully broken out of the red resistance zone.
🎯 First Target → Green line level now in play.
This breakout could open the door for further upside if momentum continues.
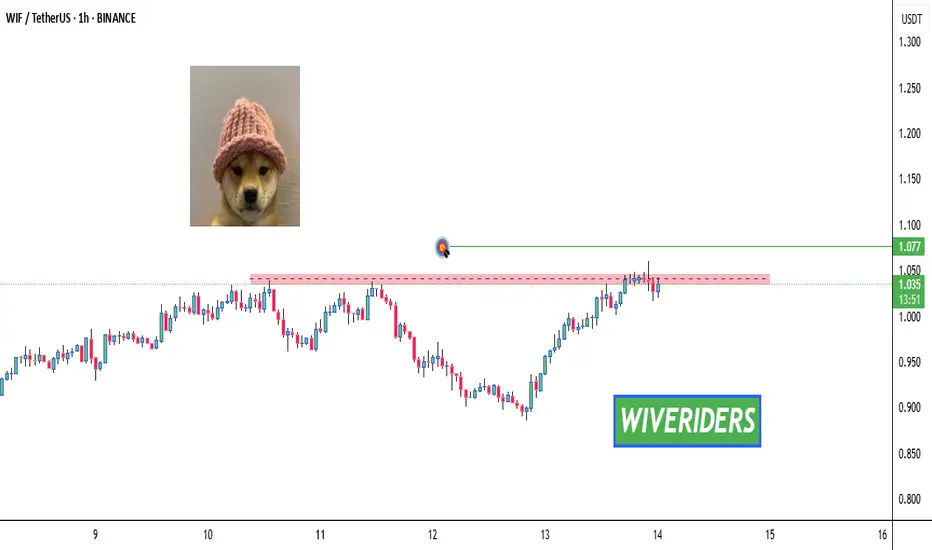
WIF Breakout Watch – Testing Key Resistance! 🚨 WIF Breakout Watch – Testing Key Resistance! 🔴⏳
WIF is testing the red resistance zone right now.
📊 If a breakout confirms, the next move could target:
🎯 First Target → Green line level
A confirmed breakout here could trigger strong bullish continuation.
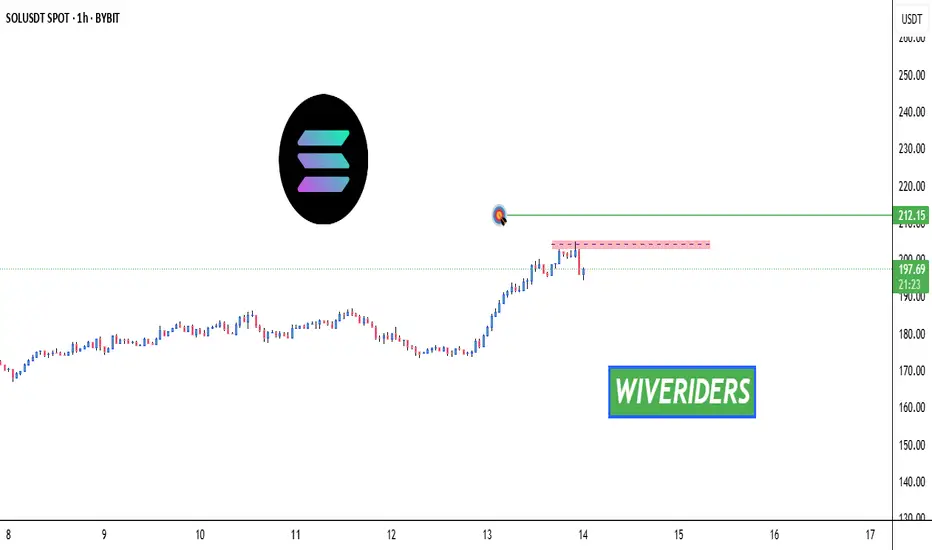
SOL Breakout Watch – Testing Key Resistance! 🚨 SOL Breakout Watch – Testing Key Resistance! 🔴⏳
SOL is testing the red resistance zone right now.
📊 If a breakout confirms, the next move could target:
🎯 First Target → Green line level
A strong breakout here could open the door for further bullish momentum.
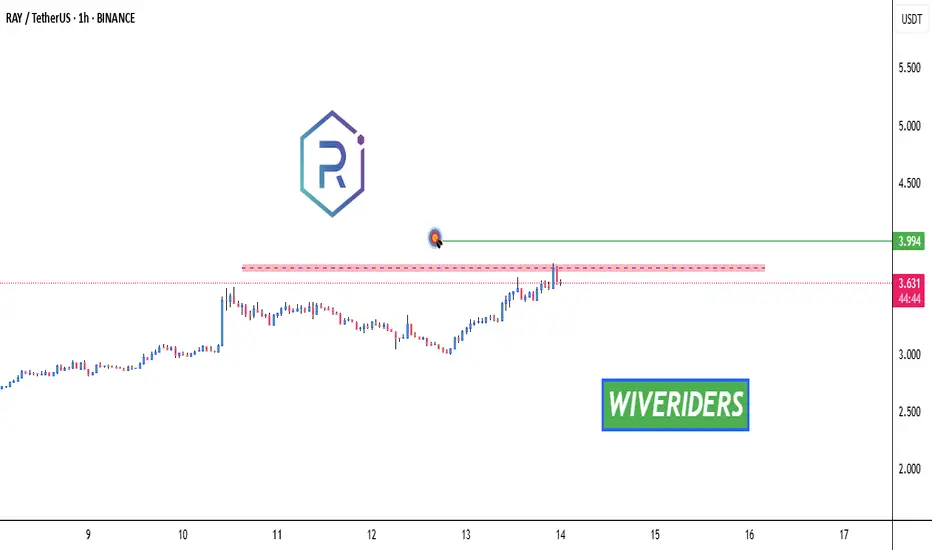
RAY Breakout Watch – Testing Red Resistance! 🚨 RAY Breakout Watch – Testing Red Resistance! 🔴⏳
RAY is currently testing the red resistance zone.
📊 If breakout confirms, the next move could target:
🎯 First Target → Green line level
A successful breakout could trigger bullish continuation.
ETHUSDT ShortThese are the key areas we are looking for on ETH 4H
Risk per entry 0.25%
Entry 1: 4250
Entry 2: 4450
TP 1: 3900 or Pivot 4050
TP 2: 3620
Full TP: 3320
SL: 4580
Always manage your own risk. None of the above is financial advice.

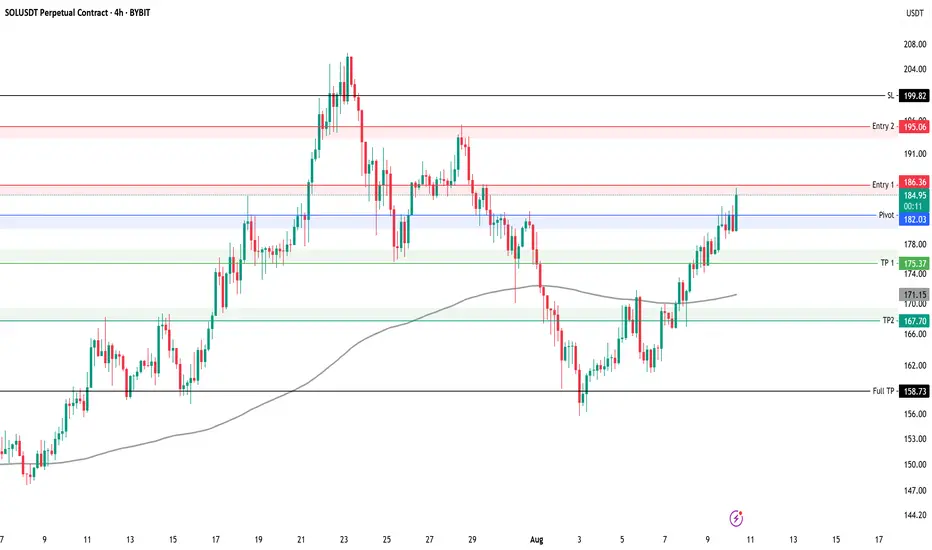
SOLUSDT Short Key levels to watch for SOLUSDT 4H
We have taken first entry on this setup using 0.5% risk
Risk per entry 0.5%
Entry 1: 186
Entry 2: 195
TP 1: 175
TP 2: 167
Full TP: 158
SL: 199
Always manage your own risk. None of the above is financial advice.