USDT Dominance – 2H Chart Analysis. USDT Dominance – 2H Chart Analysis
USDT.D is trading inside a tightening triangle structure between rising support and descending resistance, currently around 8.02%. This is a key compression zone — breakout here will likely drive the next major move in the crypto market.
Support: 7.96% – 7.70%
Resistance: 8.20%
Major Resistance: 8.64%
→ Liquidity moving into stablecoins
→ Likely pressure on BTC & Altcoins
→ Potential market pullback
→ Capital flowing back into crypto
→ Bullish momentum for BTC & Alts
→ Possible relief rally across the market
⚠️ Watch dominance closely — it often moves before price reacts.
Usdtdominance

$USDT Dominance Update. Watch this level for the next move!!USDT Dominance is currently holding a critical Fibonacci support zone between 7.64% and 7.95. This area represents a key decision point for the trend.
As long as the price remains above this Fib support, the structure favours continuation toward the 8.2%–8.9% region, which would keep pressure on BTC and altcoins as liquidity stays parked in stablecoins.
A sustained break below this zone would be the first signal that risk appetite is returning to the market.
DYOR | NFA
Please show your support and hit the like button if you like it.
Do follow me on my other socials as well to stay updated!
Cheers
PEACE

USDT.D - This is the main of reason why BTC Crash!#USDTD
One of the main reasons behind the recent BTC dump is the move in USDT.D.
When USDT dominance goes up, BTC usually goes down, and vice versa.
Over the past few weeks, USDT.D clearly broke out and moved higher, which pressured BTC and led to the drop. When BTC reached around 60k earlier, USDT.D was also hitting a major resistance zone and got strongly rejected. That rejection is what allowed BTC to bounce back toward the 71k area.
Right now, there’s still a chance USDT.D pushes a bit higher into the supply zone and then turns down. If that happens, it would be supportive for BTC and could lead to a move back toward the 80k–83k area.
The negative scenario is if USDT.D continues higher and breaks above resistance. If that plays out, BTC would likely see another strong leg down, with downside risk much lower and USDT.D potentially making new highs above 10%.
For now, everything depends on how USDT.D reacts around this resistance area.

USDT Dominance - Wyckoff AccumulationCRYPTOCAP:USDT.D could be mirroring Tesla’s 2022–2024 Wyckoff structure. From 2022 to late 2024, NASDAQ:TSLA formed a clear Wyckoff Accumulation on the weekly chart: a Selling Climax set the range, an Automatic Rally confirmed resistance, and a brief Spring in early 2023 shook out bears before prices recovered on strong volume. The stock then established a Last Point of Support, followed by a Sign of Strength breakout in late 2024, signaling institutional accumulation and the start of a new uptrend.

The key is whether the USDT and USDC gap downtrend will stop
Hello, fellow traders!
Follow us to get the latest information quickly.
Have a great day.
-------------------------------------
(USDT 1D chart)
USDT is showing a gap downtrend, leading to a decline in the coin market.
A gap downtrend in USDT or USDC can be interpreted as a sign of capital outflow from the coin market.
The key question is whether this gap-up will lead to another upward trend.
(USDC 1D chart)
USDC is also showing a gap-up trend.
It's worth paying attention to the movements of USDT, which has a significant impact on the coin market.
-
(USDT.D 1M chart)
USDT is showing a gap-down trend, leading to an increase in USDT dominance.
A rising USDT dominance is likely to lead to a downward trend in the coin market.
Therefore, it's beneficial to see a declining USDT dominance.
This means that funds are flowing into the coin market through USDT, and the inflow of USDT is used to purchase coins, causing USDT dominance to decline.
-
(BTC.D 1M chart)
As BTC dominance rises, I believe funds will flock to BTC, creating a BTC-led market.
Therefore, we expect an altcoin bull market to emerge when BTC dominance and USDT dominance coincide.
For this to occur, BTC dominance must fall below 55.01 and either remain stable or exhibit a downward trend.
-
Currently, USDT dominance is rising, while BTC dominance is falling.
I believe this movement is best interpreted as altcoins focusing on price defense.
The decline in BTC dominance indicates that funds are flocking to altcoins, while the rise in USDT dominance indicates a downward trend in the coin market.
-
Therefore,
we need to determine whether the upward trend of USDT and USDC can be sustained,
starting with the recent gap-up,
see whether the upward trend of USDT dominance has stalled,
and whether BTC dominance can support the price of BTC.
While the USDT, USDC, BTC.D, and USDT.D charts only provide a rough idea of the fund flow in the coin market, I believe this information alone is a valuable resource for individual investors who trade with limited information.
Therefore, I believe this is one of the reasons why the coin market is more transparent than any other investment market.
-
Thank you for reading to the end.
I wish you successful trading.
--------------------------------------------------

USDT Dominance: an indicator to forecast Bitcoin’s directionUSD Tether, or USDT, came into existence as a digital version of the U.S. dollar, and it succeeded. USDT is pegged to the U.S. dollar and is the top and most used stable coin in the crypto market. USDT is also being used for transferring money or other means of payment, although mostly in the crypto market. Many others tried to capture a piece of this huge market: USDC, BUSD, DAI, TUSD, and UST. We all know what happened to the last one, UST (Terra USD) depegged from the U.S. dollar and crashed.
Anyway, since USDT is the most used stable coin in the crypto market, its dominance can reveal important info about the crypto market, and mostly about the Bitcoin.
So, let's start with the plain USDT Dominance chart; it shows the percentage of the total crypto markets in the form of USD Tether. As can be seen, the USDT Dominance chart shows two ascending channels. The first is steeper than the second, and the reason for that is Tether's totalitarian nature, as back then there were no other worthy competitors, and most notably its quick acceptance by the crypto community—the traders.
Now, the second ascending channel is closer to the norm and, as such, can be used as a revealing indicator. It's easy, 1) when USDT Dominance goes down, that means most people are buying Tether, so there is a shortage of Tether in the market. 2) When USDT Dominance goes up, that means most people are selling Tether, so there is a surplus of Tether in the market. So what do these mean?
When people are buying more Tether than before, USDT Dominance decreases, and that means they are converting their fiat money, such as U.S. dollars, Euro, British Pound, Franc, etc., to Tether in order to buy crypto assets such as Bitcoin. Now, here is the important part: If more people are converting their fiat money into Tether to buy crypto coins, the demand for crypto assets will go up, and when demand goes up, so does the price.
When people are selling their crypto assets more than before, they are converting their crypto assets, such as Bitcoin, into Tether, so there is a surplus of Tether in the market, and as a result, the USDT Dominance increases. This happens when traders/people want to save profits or think the market could go into a downtrend/correction, so they sell their crypto assets and prefer to hold a stable coin like Tether.
Here, the USDT Dominance chart is compared with the Bitcoin price chart. As can be seen, when USDT Dominance went down, the Bitcoin price went up, and vice versa. So, when the Bitcoin price was decreasing, more people were selling Bitcoin and converting their crypto assets into Tether; thus, more Tether became available in the market, and as a result, the USDT Dominance went up.
The USDT Dominance chart can be used as a simple indicator to forecast Bitcoin's possible future movements.

USDT Dominance Liquidity ReachAs I predicted months ago ( October 2025), the market needed to absorb a significant amount of liquidity before a sustainable move to the upside.
At this point, most of the required liquidity has been absorbed. With proper risk management, I believe this is a good area to enter a long position with at least 70% of the intended size. With higher risk tolerance, I will personally enter the final tranche, targeting a minimum 6-month outcome.

Retest Confirmed - Bitcoin Analysis (2D)Hello everyone.
I must say that it's not very easy to say it loud but for a short period of time, the Bulls have lost the fight.
According to several factors, the next two months will be blood-colored in the entire market.
Get ready to bleed. Because your portfolio will. So will you.
Okay, but why?
Let's see;
Fundamental Factors:
-The USA is still creating more tension around the globe. Only last week, the USA has operated a huge campaign over the Caribbean Sea. And yes, if you ARE a trader, you'll follow these kinds of events because this market is not a playground for kids.
-The USA has finished its recession today but for the first time in history it took a lot of time for them to solve the problems. During the "solving" phase, the market has already calculated the fair prices for so-called "bullish news". By “bullish”, I mean reopening the USA, which is not actually bullish at all because it was never meant to be happening in the first place anyway.
-Today the USA senate has talked about another export restriction for China. This actually is the trigger for today’s red candles.
-The FED is still telling people the same story about inflation. Their utopian targets for inflation are not realistic and they know it as well. Powell has marked that there might be no rate cuts in December after all. Personal thoughts: There will be. In the short term? BEARISH.
-Another thing to consider is the ETFs. Remember what happened in the market when BTC and ETH ETFs were listed? This is what's happening at the moment. History just repeats itself again and again. Many altcoin ETFs will be approved during this month. This will trigger another event called "accumulation". Hedge funds and other customers will seek to buy the dip. Therefore, they will push the prices of ETF-listed altcoins to the bottom so they can buy at lower prices while your portfolio melts. CEXs will also help them do so by letting them manipulate the order book via fake resistance orders. Sorry, but this is how it works.
Now the fun part. Let's talk about the Technical Factors:
-For this time I'll start with USDT dominance.
There is not much to talk about but I'll leave a link so you can examine. The entire market will remain bearish as long as this parameter stays above 5.2%.
-Another thing to keep an eye on is the S&P index, which is looking very bearish due to uncertainty around the globe and for the most part the US.
-Let's get back to BTC.
In previous analysis, I already explained to you what might be coming soon and we might actually have been at the end of wave 5. Well, sadly that analysis worked. Yes, sadly because I want this market to grow.
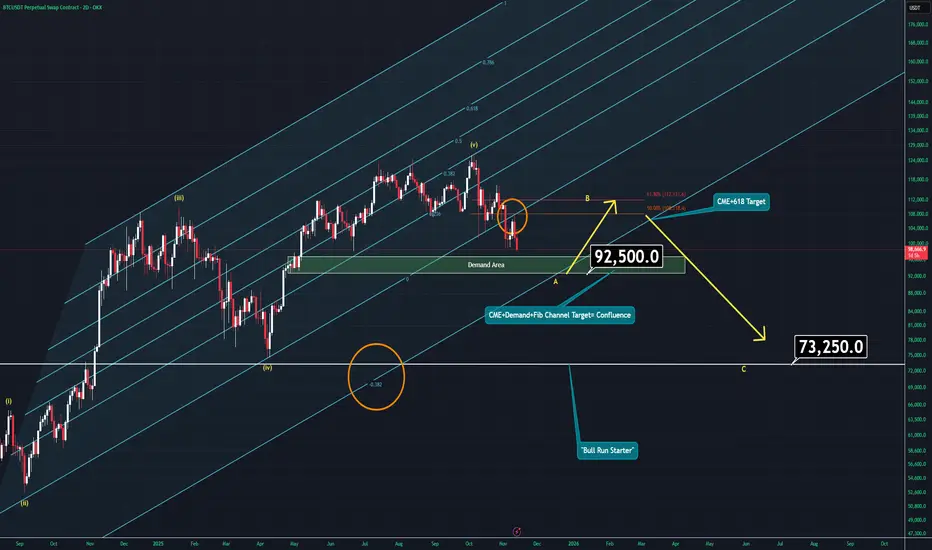
At the moment we are going to see an A-B-C correction pattern and it will take a few weeks to complete. During this era, you need to be careful about two things:
Don’t even think that getting a swing long position to hold for 2 years will work.
You will see a correction through 110K soon but it will only be wave B. So, if you're carrying long-term hedge positions, you'll need to watch for an ENGULFING daily candle in Bitcoin around 92K. That's where the CME gap was left — also a demand area and moreover, there is Fib channel confluence. Before that “engulf” happens, I'd not suggest lowering breakeven in losing positions.
The wave 5 also will be a perfect trap for newcomers and for people who don't know much about the market. Many will jump into altcoins when they're cheap, but most likely they will be cheaper around March 2026.
Bitcoin has already completed its retest after breaking the lower boundary of this Fib channel. No need to overthink it. As long as Bitcoin stays below 110K, don't look for any “BULL RUN.”
And if somehow Bitcoin reaches around 110K, wait for a weekly candle close. That will both confirm and trigger bullish momentum. Don't worry, you won't miss the move — you'll just confirm it.
Thanks for reading,
Get ready.
USDT.D at HTF Resistance — 4H Execution, Daily Bias in ContextContext
This analysis is based on the 4H chart shown. The Daily chart is not displayed, but the higher-timeframe bias is inferred from structure and location. USDT Dominance (USDT.D) is currently trading at a key HTF resistance zone, acting as a major decision point for overall crypto risk.
Higher-Timeframe Bias (Daily – Not Shown)
From a Daily perspective, USDT.D is extended into a historically sensitive resistance area.
This zone typically represents peaks in risk-off behavior rather than continuation points.
Unless Daily acceptance occurs above this zone, my macro bias remains for a pullback in dominance.
A Daily pullback in USDT.D supports sustained risk-on conditions across BTC and Altcoins.
Execution Timeframe (4H – Chart Shown)
Key HTF resistance / supply zone: 7.16% – 7.23% .
This area is treated as a rejection-or-acceptance zone, not an entry by itself.
First downside reaction / demand zone: 6.70% – 6.76% .
If this zone fails with acceptance, lower HTF magnets come into play.
Primary Scenario — Rejection from HTF Supply (Risk-On)
4H rejection from the 7.16–7.23% supply zone.
Bearish displacement away from the zone, ideally leaving imbalance / FVG.
Price should not immediately reclaim the supply; acceptance back inside invalidates weakness.
Expectation: continuation toward the green demand zone first, then potentially lower HTF levels.
Market implication: declining USDT.D = capital rotating from stables into crypto (bullish for BTC/ALTS).
Invalidation / Alternative Scenario — Acceptance Above Supply (Risk-Off)
4H candle closes and holds above 7.23% .
Successful retest of the zone as support confirms acceptance.
This opens the path for further dominance expansion.
Market implication: sustained risk-off conditions; crypto upside becomes limited or corrective.
Notes
USDT.D is used strictly as a macro risk filter, not a standalone trade signal.
Best conditions occur when BTC and Altcoin structures confirm the same directional bias.
As always, acceptance vs rejection is more important than wicks or single candles.

"Falling Knife" Stable Coins Dominance Analysis (1W)Hello everyone.
The entire crypto market is about to face a crucial decline.
There are many technical ways to show it.
I'm here today to show you one of them.
One of the best ways of examining the crypto market is checking the stablecoin dominance.
The most famous way to do it is simply looking at the USDT.D chart, which is extremely bullish right now.
The problem with that is, if stablecoin dominance is rising, it means the market is going down. Also vice versa.
We can also combine them to see more complex details to understand what is about to happen in the near future.
Right now, you're looking at the “USDT.D + USDC.D” chart, so they are combined.
The problem here is, this chart is extremely bullish on the weekly timeframe.
It means extremely bearish for the entire crypto market.
There is a very common pattern known as a “triple bottom,” which is about to break. Moreover, a broken trendline on the weekly timeframe simply means that the trend is not likely to end very soon.
We might be witnessing a very bearish market next year.
Be prepared.
Good luck.

USDT.D Signalling Crypto Crash Zone & Bear Market Revisiting this study again that I originally shared months ago as a possible 'path' to either the new ATH targets and/or the Crypto Crash & Bear Market zones...
We can see the the Blue bars from the last cycle are an important fractal to follow.
USDT.D (Tether Dominance) clearly shows the inverse relationship it has with Bitcion and TOTAL market cap, which I have hidden here.
But the Yellow line is the midpoint and can be considered the 'Mean' in the 'reversion to the mean' equation.
At the lows of the USDT.D multi-year trendline going back to 2018, when touch the trendline, crypto is rallying and hitting all time highs.
In contract, when USDT.D is pushing higher (Money flowing into Stablecoins) we see markets correcting and crashing.
I've labeled the corresponding areas, which we can see that USDT.D is now forming support above the 6.5% prior resistance, indicating a deeper crash is likely coming.
Tomorrow is a Triple Witching expiration, so expect volatility.
However, in the past these usually mark reversal points in the markets.
So we'll have to watch and see...
However, most other technical signals are flagging bearish like the Monthly MACD and mult-month Bearish Divergences on the RSI, MFI, and Stoch/RSI
Good time to be out of the markets IMO until this clarifies.
Even if we get a 'Santa Rally' I'll be selling into it, b/c the USDT.D has plenty of room to run to the upside... And we're unlikely to see liquidity return to the markets without more interest rate cuts, QE, and money printing.
All eyes are on Japan's Fed Rate meeting tomorrow, where there's rumored to be a .25 rate HIKE which also has the markets on edge.

USDT DOMINANCE Analysis (4H)We are currently observing a well-defined and complete market structure on USDT Dominance. The presence of a bullish Change of Character (CHoCH), along with a strong and decisive break of the bearish trendline, clearly suggests that buyers have stepped into the market and that selling pressure from bears is weakening.
From a technical perspective, this shift in structure indicates a potential trend reversal or at least a strong corrective move to the upside in USDT dominance. As expected in such scenarios, price is likely to pull back toward the identified support zone before continuing its movement toward the previously marked targets. This pullback can be seen as a healthy retracement and a possible opportunity for confirmation rather than immediate continuation.
An increase in USDT dominance typically signals risk-off behavior, meaning capital is flowing out of riskier assets. Therefore, if this scenario plays out, it strongly implies that Bitcoin and most altcoins may experience further downside pressure, leading to more red candles across the crypto market.
For traders, this index can be a valuable macro-level confirmation tool. It is crucial to manage risk carefully, avoid overexposure, and adjust your trading plan in alignment with USDT dominance behavior. Always wait for confirmation, respect key levels, and make sure your position sizing and risk management strategy reflect the current market conditions.
Trade smart, stay disciplined, and let the market confirm the move before committing.
If you would like us to analyze a coin or altcoin for you, first like this post, then comment the name of your altcoin below.

USDT DOMINANCE Is Still Bullish (4H)This analysis is an update to the previous one, which you can find in the related publications section.
First of all you should know that "USDT Dominance" is always moving inverse of BTCUSDT .
This index provides a good roadmap for Bitcoin and high volume altcoins.
For the next phase, the demand zone has been updated. Once price reaches this demand area, another upside move in USDT dominance is expected, which would likely put further downside pressure on the overall crypto market.
If you have a coin or altcoin you want analyzed, first hit the like button and then comment its name so I can review it for you.
This is not a trade setup, as it has no precise stop-loss, stop, or target. I do not publish my trade setups here.

USDT Dominance(USDT.D%) RoadmapUSDT.D% ( CRYPTOCAP:USDT.D ) is one of the crucial indexes in the crypto market. Alongside token analysis, it’s important to consider this metric because an increase in USDT.D% often leads to a decrease in crypto asset prices.
Currently, USDT.D% has successfully broken through its support lines and even created a fake breakout above the resistance lines.
From an Elliott Wave perspective, it appears that USDT.D% has completed its 5 impulsive waves over the past 10 to 12 days, and we can expect a corrective downward movement.
Additionally, we can observe a negative Regular Divergence(RD-) between two consecutive peaks.
I anticipate that USDT.D% will begin to decline, potentially reaching the Fibonacci support levels. This decline could lead to an increase in crypto asset prices, especially Bitcoin .
Notes: If USDT.D% drops below the support zone(6.234%-6.090%), we can expect a significant upward trend in the crypto market.
💡 Please respect each other's opinions and express agreement or disagreement politely.
📌Market Cap USDT Dominance% Analyze (USDT.D%), 8-hour time frame.
🛑 Always set a Stop Loss(SL) for every position you open.
✅ This is just my idea; I’d love to see your thoughts too!
🔥 If you find it helpful, please BOOST this post and share it with your friends.

USDT Dominance 4H Chart Update. USDT Dominance 4H Chart Update.
USDT.D is moving inside a descending channel.
Price got rejected from the upper resistance zone ~6.50–6.53%.
Structure suggests continuation to the downside toward 6.0% → 5.9%
Falling USDT dominance = bullish for the crypto market, especially alts.
Bearish USDT.Dominance if drops, expect altcoins + BNB to stay strong.
⚠️ Invalidation if USDT.D breaks and holds above 6.53%.

USDT.D Dominance analysis📊 Let’s talk about CRYPTOCAP:USDT .D (Stablecoin Dominance)
With cautious optimism, it looks like the worst phase for the crypto market may already be behind us.
👉 USDT.D tried hard, but failed to secure itself above the critical 6.5% resistance.
Right now, a potential reversal pattern is forming on the chart — and this often marks a shift in market regimes.
👉 USDT.D down = Altcoins up — a classic rule that rarely fails.
⚠️ The only concern:
The Fear & Greed Index jumped too fast — from 26 yesterday to 48 today.
Growth is healthy, but slow and steady would look much better than instant euphoria.
Because of that, we still allow one more corrective move in crypto to cool things down.
☀️ As long as USDT.D stays below 6%, chances are high that the market “spring” will arrive earlier than the calendar one 😉
🤔 Do you think this is already the start of an altcoin recovery — or is the market just teasing us again?
______________
◆ Follow us ❤️ for daily crypto insights & updates!
🚀 Don’t miss out on important market moves
🧠 DYOR | This is not financial advice, just thinking out loud

USDT Dominance Turning Bullish | Risk-Off Mode Is Back (4H)Contrary to our previous analysis the market experienced a pump and reclaimed the flip zone Because of this the current wave count for USDT Dominance appears to be more accurate and reliable
The flip zone is a critical area in trading where the behavior of buyers and sellers often changes It can either be a point where buyers give up and start selling alongside sellers or a level where sellers capitulate and buy alongside the buyers Essentially it represents a shift in market sentiment and understanding it can give us a clearer picture of potential price action
In the case of USDT Dominance the flip zone we are observing acted as a resistance level As a result sellers are likely to capitulate and join the buying side reinforcing support at this level This suggests that the price could find a solid footing here before moving higher
Our expectation is that USDT Dominance will hold support at the green flip zone and gradually move toward the target levels marked on the chart If this scenario unfolds it could increase selling pressure in the broader crypto market especially on Bitcoin and some altcoins as traders react to rising stablecoin dominance
It will be interesting to see how this plays out but for now this flip zone represents a key battleground between buyers and sellers and could dictate the near term market dynamics.

USDT dominance chart update. USDT dominance is still grinding inside the rising wedge pattern, with price forming a series of higher lows but showing signs of exhaustion near the upper boundary.
The multi‑year rising wedge has held as the dominant structure since 2022, with the latest bounce from the lower trendline now testing the 6.3–6.5% resistance zone where prior rejections have clustered.
RSI is in a bearish divergence on the weekly timeframe, which often flags the end of these dominance uptrends as capital starts rotating back into risk assets.
As long as dominance stays below 6.5% and holds the lower wedge line around 5.2–5.3%, the bias leans toward a breakdown that could signal stronger altcoin performance ahead.
A clean break below the wedge and 5.2% opens measured downside toward 4% or lower; upside risk to 6.8% remains if it pushes higher, but the pattern suggests reversal is more likely here.

USDT Dominance – Chart Update (4H). USDT Dominance – Chart Update (4H)
• USDT.D is trading below the descending trendline, indicating continued weakness.
• Price is also below the 200 MA and inside/below the Ichimoku cloud → bearish bias remains intact.
• Current consolidation near the horizontal support zone.
Resistance: 6.10% – 6.25% (trendline + MA area)
Support: 5.85% → 5.60%
As long as USDT dominance stays below the trendline, altcoins and BTC remain supportive.
A breakdown below 5.85% can trigger a strong altseason / risk-on move.
Only a strong reclaim above 6.25% would signal temporary risk-off.

USDT DOINANCE is still under the control of bears (4H)USDT Dominance (USDT.D) – ABC Correction Completed? Bearish Wave C in Play 🚨
Altcoins & Bitcoin Recovery Scenario Explained | Smart Money Levels Ahead
If you remember our previous analysis, we were tracking a classic ABC corrective structure on USDT Dominance (USDT.D). In that scenario, Wave B was developing as a Triangle / Diametric pattern, which typically represents a complex correction before the final move.
📌 Now, the structure is becoming clearer.
Based on current price action and market behavior, it appears that Wave B has officially completed, and USDT Dominance has entered Wave C.
🔻 Why Wave C Is Important for the Crypto Market
Wave C in this structure is bearish for USDT Dominance, which is bullish for risk assets:
📈 Bitcoin (BTC) has room for further recovery
🚀 Altcoins may outperform and print greener candles
💧 Capital is likely rotating out of stablecoins and into crypto
Historically, a declining USDT.D often aligns with market relief rallies, increased risk appetite, and stronger momentum across altcoin pairs.
🎯 Key Targets & Market Maker Zones
On the chart, we have identified two major downside targets that act as high-importance reaction levels:
These levels are liquidity-rich zones
Market makers may slow price, create fake breakouts, or engineer reactions
Expect volatility and potential short-term bounces around these areas
⚠️ These are not random levels — they align with structure, Fibonacci confluence, and prior demand zones.
🔴 Critical Rejection Zone (Red Area)
The red-highlighted zone represents a strong resistance / rejection area where USDT Dominance is expected to fail and reverse lower.
If price reacts as expected from this zone:
It would confirm Wave C continuation
Strengthens the bullish case for BTC & Altcoins
Adds confidence to risk-on strategies
🧠 Smart Money Perspective
From a market maker & smart money point of view:
Liquidity above has likely been collected
Distribution appears complete
The path of least resistance is downward for USDT.D
This aligns perfectly with the current recovery narrative across the crypto market.
📊 What Should Traders Watch Next?
Reaction at the red rejection zone
Momentum toward the two marked targets
Confirmation via BTC.D and Total Market Cap
Volume expansion on altcoins
Final Thoughts
Nothing is guaranteed in the market, but structure + sentiment + liquidity are pointing in the same direction for now.
Let’s see how the market reacts.
Stay patient, trade the levels, and manage risk properly.
💬 If you’re tracking USDT.D, BTC, or Altcoins, share your bias in the comments.
📌 Follow for more Elliott Wave, Smart Money, and Crypto Market Structure analysis.

USDT Dominance (4H) – Chart Update. USDT Dominance (4H) – Chart Update
USDT dominance is breaking down from support and getting rejected from the trendline.
This usually indicates capital flowing out of stablecoins into crypto assets.
If this breakdown continues, ALTCOINS & ETH can outperform
Next major support around 5.45% (marked zone)
A bounce in USDT.D can cause short-term pullbacks in alts. Until then, bias remains risk-on.
Weak USDT dominance = Bullish for the crypto market
Stay aligned with structure & manage risk.

USDT Dominance (1H) – Chart Update. USDT Dominance (1H) – Chart Update
USDT.D is trading inside a symmetrical triangle, formed by a descending resistance and rising support — indicating market indecision.
Price is hovering near the upper half of the pattern, facing rejection from the descending trendline around 6.10–6.15%.
Likely move toward the rising support, which would favor risk-on sentiment and support altcoins.
Signals risk-off, increasing chances of market pullback.
Confirms capital rotation into crypto, bullish for BTC & alts.
USDT.D is at a decision point. A confirmed breakout or breakdown will define the next short-term direction for the broader crypto market. Risk management is key until clarity emerges.

USDT Dominance vs Total Crypto Market CapIn trading and in life — there’s no need to overcomplicate things.
Just look at the chart and compare: when USDT.D falls - crypto starts to rise.
When USDT.D rises, capital flows out of altcoins into stablecoins.
After this phase, and once the market goes through a full bearish trend, altcoins eventually drop to their real bottom (probability) — the blue zone with white arrows.
As we can see now, many altcoins never recover after that — they simply don’t survive the cycle.
That’s why going forward, it makes more sense to ignore altcoins outside the top 100 and avoid investing in them if you don’t want to lose your capital.
