DXY Breakdown After Major Top – Wave v in ProgressThe DXY chart shows that the U.S. Dollar has completed a larger corrective structure and is now moving inside a new impulsive bearish phase. After forming a major top near the 110 area, the index started a clear five-wave decline, indicating strong downside momentum. The recent sideways movement looks like a corrective pause (wave iv / Y) rather than a trend reversal. As long as the price stays below the key resistance zone around 100–101, the overall structure remains bearish. This suggests the dollar is preparing for the final wave lower (wave v / 3), which could push the index toward deeper support levels. Overall, the Elliott Wave structure favours continued weakness in the U.S. Dollar in the coming months.
Stay tuned!
@Money_Dictators
Thank you :)
Usindex

The Dollar Isn’t Falling. It’s Being Repriced.The dollar didn’t weaken because of a single headline.
It weakened because two forces aligned at the same moment—policy certainty and political uncertainty.
Futures now price a full December rate cut.
That removes the dollar’s yield premium and lifts liquidity expectations.
But the bigger shift is political.
Odds have increased that Kevin Hassett could replace Jerome Powell as Fed Chair.
Markets understand the implication: potential pressure on Fed independence.
Currencies respond quickly to credibility risk.
EURUSD strengthened.
Gold firmed.
Bitcoin stabilized despite its bearish structure.
Now the technical side.
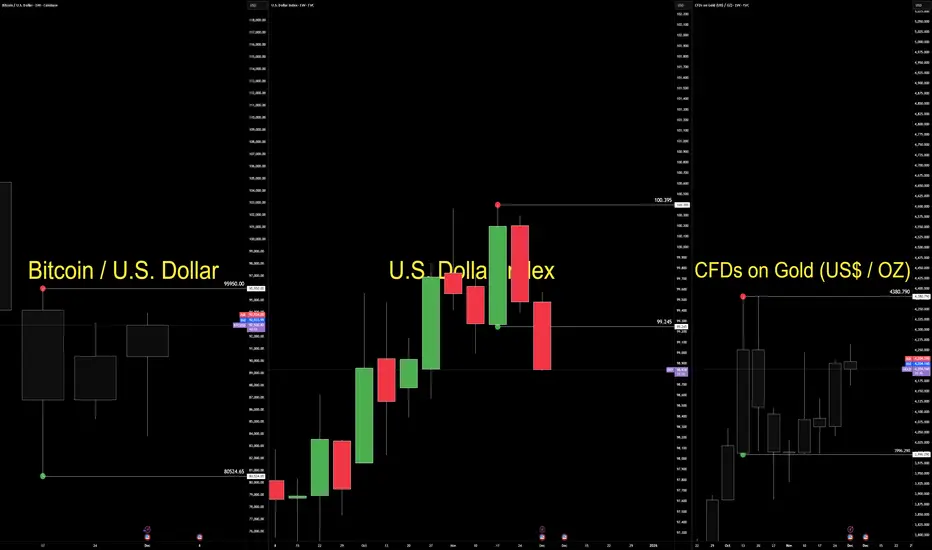
The dollar still trades inside a bullish consolidation between 99.245 and 100.395.
Structure is intact, but behaviour has shifted under the surface.
Pressure is building inside the box.
Gold holds a weekly bullish consolidation above 3996.290.
Price is absorbing quietly—typical when investors hedge independence risk.
Bitcoin remains in a weekly bearish consolidation between 95,950 and 80,524.
A rare decoupling from the debasement narrative.
The macro story supports upside, but structure has not yet released.
This environment demands a behaviour-first lens.
Market Structure maps the containment.
Geometry shows the compression.
Volume Flow reveals participation rotation.
Order Flow exposes intent before trend.
Execution depends on pressure validation, not prediction.
Today is not a trend shift.
It is a credibility repricing.
The dollar hasn’t lost structure.
It has lost premium—while gold and crypto absorb the early rotation of capital into assets less dependent on institutional stability.
When policy becomes predictable and leadership becomes political, markets adjust before headlines explain why.
— CORE5DAN
Institutional Logic. Modern Technology. Real Freedom.
Dollar Index Behavior in a Descending DiamondThe dollar index has made a very polite effort and has been fluctuating within the range I have drawn, and I think this effort will continue and continue its downward trend until the price range I have indicated in the image!
Time will tell if this claim is true!
Good luck...

Kiwi H&S and strong Dollar confirm breakdown, eyes on PCE next!The Kiwi hit multi-month lows near 0.5750 following USD strength yesterday, as the dollar index was driven by upbeat US economic data following warnings by Fed Chair just on Tuesday.
The head and shoulders (H&S) pattern on NZDUSD has broken down, targeting the golden pocket for the time being, but the PCE data could offer a breather if it cools down.
Kiwi drop was driven by :
US jobless claims crush expectations (218K vs 233K expected)
US GDP revised to 3.8% from 3.3%, fastest growth in 2 years
RBNZ cutting cycle accelerates amid economic contraction
Tariff-related risk-off sentiment hammering high-beta currencies
Technical Setup :
Head & Shoulders targeting 61.80% or lower while trading below the neckline
Current price action near 0.5750 round support reveals pressure
Upside possible but hangs on PCE, with 38-50% retracement as a resistance zone
RSI is at near-oversold levels with more room to trend lower
Bias - BEARISH :
Entry: Below 0.5775 breakdown
Target 1: 0.5720 (immediate support)
Target 2: 0.5620 (78.6% Fib retracement)
Stop Loss: 0.5830+ (failed bounce level)
Risk/Reward: 1:2+ setup
Eyes on :
Today : US PCE inflation data
Oct 9 : RBNZ meeting (50bp cut possible)
Watch DXY strength continuation towards 100.00
This content is not directed to residents of the EU or UK. Any opinions, news, research, analyses, prices or other information contained on this website is provided as general market commentary and does not constitute investment advice. ThinkMarkets will not accept liability for any loss or damage including, without limitation, to any loss of profit which may arise directly or indirectly from use of or reliance on such information.

S&P 500 Technical Analysis & Trading OutlookCurrent Price: 6,715.20 | Date: October 4, 2025
📊 MARKET OVERVIEW
The S&P 500 is trading at 6,715.20, hovering near historical resistance zones. This analysis integrates multiple technical frameworks to provide actionable insights for both intraday and swing traders.
🔍 MULTI-TIMEFRAME TECHNICAL ANALYSIS
Monthly & Weekly Perspective (Swing Trading)
Elliott Wave Analysis:
The index appears to be in a Wave 5 extension of a broader bullish impulse from the 2022 lows
Monthly chart shows potential exhaustion signals as we approach the 6,750-6,800 resistance cluster
Wave structure suggests a possible corrective phase (ABC) may initiate in Q4 2025
Ichimoku Cloud (Weekly):
Price trading above the cloud - bullish structure intact
Tenkan-sen (9): 6,682 | Kijun-sen (26): 6,591
Future Senkou Span projects resistance at 6,780-6,820
Key Support Levels (Swing):
6,620 - Kijun-sen weekly support
6,480 - 50-week EMA (critical long-term support)
6,350 - Monthly pivot & Wyckoff accumulation zone
6,180 - 200-week MA (major bull/bear line)
Key Resistance Levels (Swing):
6,750 - Psychological resistance & Gann 1x1 angle
6,820 - Ichimoku cloud projection
6,945 - Fibonacci 1.618 extension from August lows
Daily & 4-Hour Perspective
Wyckoff Analysis:
Current phase suggests late distribution (UTAD - Upthrust After Distribution)
Volume declining on recent rallies - potential weakness
Accumulation zone identified: 6,480-6,550 for re-entry
Harmonic Patterns:
Bearish Bat pattern forming on the 4H chart
PRZ (Potential Reversal Zone): 6,740-6,760
Bearish divergence on RSI confirming pattern validity
Bollinger Bands (Daily):
Price at upper band (6,735) - overextended
Band width expanding - increased volatility expected
Middle band support: 6,580
Volume Analysis:
VWAP (Anchored from September low): 6,612
Volume profile shows weak volume above 6,700
High volume node (HVN) at 6,550-6,600 - strong support
Intraday Analysis (1H, 30M, 15M, 5M)
Current Intraday Setup:
RSI (Relative Strength Index):
1H RSI: 67.8 (approaching overbought)
15M RSI: 72.3 (overbought territory)
Bearish divergence forming on 30M chart
Moving Averages:
Death Cross Warning: 50 EMA approaching 200 EMA on 4H chart
1H: 20 EMA (6,698) acting as immediate support
5M: Price oscillating around 50 EMA (6,712)
Gann Analysis:
Gann Square of 9: Next resistance at 6,728 (45° angle)
Time cycle suggests potential reversal window: October 7-9, 2025
Price/Time square approaching - expect volatility spike
Candlestick Patterns (Recent):
Evening Star formation on 4H chart (bearish reversal)
Long upper wicks on 1H chart - rejection at resistance
Doji formation on daily - indecision
🎯 TRADING STRATEGIES
INTRADAY TRADING SETUP (Next 5 Trading Days)
Bearish Scenario (Higher Probability - 65%):
Entry Zones:
Primary Short Entry: 6,725-6,735 (upon rejection)
Secondary Short Entry: 6,750-6,760 (if breakout fails - bull trap)
Stop Loss:
Above 6,775 (invalidation level)
Profit Targets:
TP1: 6,680 (20 EMA support - 1H)
TP2: 6,650 (VWAP anchor)
TP3: 6,620 (Kijun-sen weekly)
TP4: 6,580 (Daily BB middle band)
Risk-Reward Ratio: 1:3 minimum
Confirmation Signals:
Break below 6,700 with increased volume
RSI crosses below 50 on 1H chart
MACD bearish crossover on 30M
Bullish Scenario (Lower Probability - 35%):
Entry Zones:
Long Entry: 6,680-6,690 (upon bounce from 20 EMA)
Aggressive Long: 6,650-6,660 (VWAP retest)
Stop Loss:
Below 6,635
Profit Targets:
TP1: 6,720 (resistance retest)
TP2: 6,750 (psychological level)
TP3: 6,780 (Ichimoku cloud resistance)
Confirmation Signals:
Volume surge on bounce
RSI bullish divergence on 15M
Break above 6,720 with strong momentum
SWING TRADING SETUP (2-4 Week Outlook)
Primary Strategy: SELL ON RALLY
Phase 1 - Distribution (Current):
Expect choppy price action between 6,680-6,750
Ideal swing short entry: 6,735-6,760
Stop loss: 6,820
Target: 6,480-6,550 (Accumulation zone)
Time horizon: 2-3 weeks
Phase 2 - Accumulation (Upcoming):
Watch for bullish reversal patterns in 6,450-6,550 zone
Potential H&S inverse or double bottom formation
Long entry upon confirmation
Target: 6,850-6,950 (Next impulse wave)
Time horizon: 4-8 weeks
⚠️ RISK FACTORS & MARKET CONTEXT
Trap Alert:
Bull Trap Risk: HIGH above 6,750
Weak volume at resistance suggests false breakout potential
Head and Shoulders pattern forming on 4H chart
Bear Trap Risk: MODERATE below 6,650
Strong support zone with high volume profile
Potential quick reversal if broken
Geopolitical & Macro Factors:
Fed policy uncertainty - rate decision impact expected mid-October
Q3 earnings season beginning - volatility spike likely
Geopolitical tensions may trigger safe-haven flows
Seasonal October volatility historically present
Volume Volatility Assessment:
Current State: Declining volume on rallies (bearish)
Expected: Volume spike at 6,750 resistance or 6,650 support
Strong Trend Confirmation: Sustained volume >15% above 20-day average
🎯 TRADING PLAN SUMMARY
For Next Week (Oct 4-11, 2025):
Monday-Tuesday: Expect resistance at 6,725-6,735. Look for short opportunities on rejection.
Wednesday-Thursday: Gann time cycle window - increased volatility. Watch for break of 6,700 or 6,750.
Friday: Weekly close crucial - below 6,680 confirms bearish bias; above 6,750 invalidates short setup.
Optimal Strategy:
Sell rallies into 6,730-6,750 resistance
Wait for confirmation - don't chase
Manage risk strictly - volatile market conditions
Scale into positions - don't enter full size immediately
💡 TRADER'S EDGE
Pattern to Watch: The confluence of:
Bearish Bat harmonic completion
RSI divergence
Wyckoff distribution phase
Weak volume at resistance
Gann time/price square
Creates a HIGH-PROBABILITY SHORT SETUP at 6,735-6,760
Critical Levels This Week:
Bull Control: Hold above 6,700
Bear Control: Break below 6,650
Decision Zone: 6,675-6,725
📝 DISCLAIMER
This analysis is for educational purposes only. Trading involves substantial risk of loss. Always use proper risk management, never risk more than 1-2% of your capital per trade, and consider your own risk tolerance and trading plan. Past performance does not guarantee future results.
Stay disciplined. Trade the plan. Manage your risk.

EUR USD and DOLLAR UPDATE
The Dollar Index (DXY) is grinding through a daily order block and has just pierced 97.882.
Technical
If we close above 97.882, that confirms a break and opens continuation toward higher liquidity zones. With tomorrow’s heavy macro news, the setup has volume behind it for a potential massive move.
Macros
U.S. government shutdown is weighing on confidence and trimming growth forecasts (each week may shave 0.1–0.2pp off GDP).
The Fed remains cornered — markets price in rate cuts, but policy credibility is under scrutiny.
Safe-haven flows are mixed: gold at records, dollar stabilizing after Supreme Court support for Fed’s Cook.
Data releases are being delayed by the shutdown, which adds uncertainty and volatility.
EURUSD
We’re short and holding.
4-month rangebound structure remains
Be aware
Dollar strength is being fueled by technical break + macro volume. EURUSD is vulnerable if DXY confirms above 97.882.
But with policy risk and shutdown uncertainty, expect volatility spikes and liquidity hunts around tomorrow’s big data.

U.S. Dollar Index (DXY) Weekly 2025Summary:
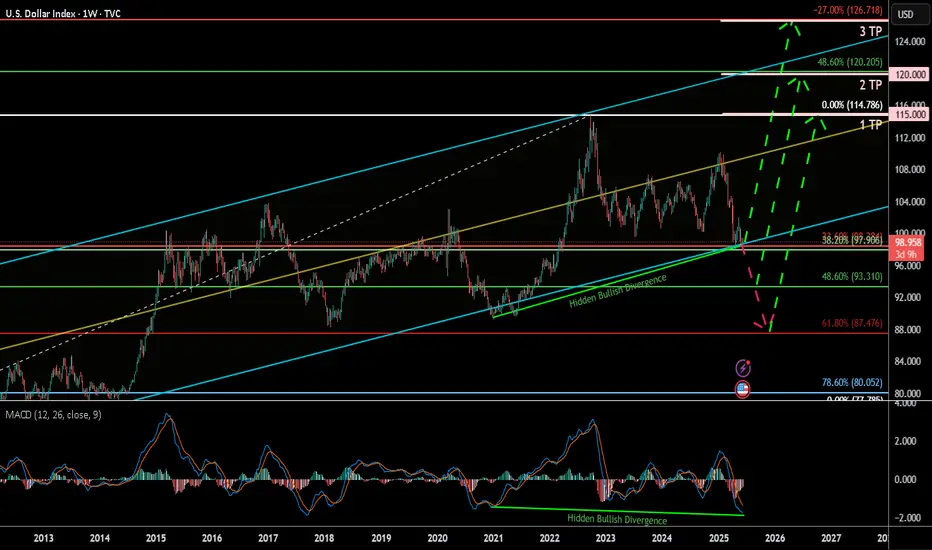
The U.S. Dollar Index (DXY) has corrected down to the key 38.60% Fibonacci retracement zone and is currently showing signs of a potential bullish reversal, bolstered by a clear hidden bullish divergence on the MACD. This may signal a renewed rally toward key upside targets, especially if the 93.3–99.9 support Zone holds.
Chart Context:
Current Price: 98.864
Key Fib Support: 38.60% @ 99.906, 48.60% @ 93.310, 61.80% @ 87.476
Support Zone: 93.3–99.9 USD
Hidden Bullish Divergence: Observed both in 2021 and now again in 2025 on the MACD
Trendline Support: Long-term ascending trendline holding since 2011
Fib Extension Targets (Trend-Based):
TP1: 115.000
TP2: 120.000
TP3: 126.666
Key Technical Observations:
Fibonacci Confluence: DXY is bouncing from a strong Fib cluster between 93.310 and 99.906, historically acting as a reversal zone.
Hidden Bullish Divergence: Suggests potential upside despite price weakness.
Downtrend Retest: Price may revisit 93.3–87.4 before confirming full reversal.
Breakout Pathway: Green dashed arrows outline the likely recovery trajectory toward 114–126 range.
Indicators:
MACD: Showing hidden bullish divergence and potential signal crossover.
Trendline Support: Holding intact from 2021 low.
Fib Levels: Used for retracement and trend-based extension.
Fundamental Context:
Interest Rate Outlook: If U.S. inflation remains controlled and Fed signals future hikes or sustained high rates, DXY strength may persist.
Global Liquidity & Recession Risk: If risk aversion returns, the dollar may rise as a safe haven.
Geopolitical Risks: Conflicts, trade tensions, or BRICS dedollarization efforts may create volatility.
Our Recent research suggests the Fed may maintain higher-for-longer rates due to resilient labor markets and sticky core inflation. This supports bullish USD bias unless macro shifts rapidly.
Why DXY Could Continue Strengthening:
Robust U.S. economic performance & monetary policy divergence
U.S. GDP growth (~2.7% in 2024) outpaces developed peers (~1.7%), supporting stronger USD
The Fed maintains restrictive rates (4.25–4.50%), while the ECB pivots to easing, widening the policy and yield gap .
Inflation resilience and Fed hawkishness
Labor markets remain tight, keeping inflation “sticky” and delaying expected rate cuts; market-implied cuts for 2025 have been pushed into 2026
Fed officials (e.g. Kugler) emphasize ongoing tariff-driven inflation, suggesting rates will stay elevated.
Safe-haven and yield-seeking capital flows
With global risks, capital favors USD-denominated assets for yield and stability
Why the Dollar Might Face Headwinds
Fiscal expansion & trade uncertainty
Ballooning U.S. deficits (~$3.3 trn new debt) and erratic tariff policy undermine confidence in USD
Wall Street’s consensus bearish position.
Major banks largely expect a weaker dollar through 2025–26. However, this crowded bearish sentiment poses a risk of a sharp rebound if data surprises occur
barons
Tariff policy risks
Trump's new tariffs could dampen dollar demand—yet if perceived as fiscal stimulus, they could unexpectedly buoy the USD .
Synthesis for Our Biases
A bullish DXY thesis is well-supported by:
Economic and policy divergence (U.S. growth + Fed vs. peers).
Hawkish Fed commentary and sticky inflation.
Safe-haven capital inflows.
Conversely, risks include:
Deteriorating fiscal/trade dynamics.
Potential Fed pivot once inflation shows clear decline.
A consensus that could trigger a short squeeze or reversal if overstretched.
Philosophical / Narrative View:
The dollar remains the world’s dominant reserve currency. Periodic dips often act as strategic re-accumulation phases for institutional capital—especially during global macro uncertainty. A return toward 120+ reflects this persistent demand for USD liquidity and safety.
Bias & Strategy Implication:
1. Primary Bias: Bullish, contingent on support at 93.3–99.9 holding.
2. Risk Scenario: Breakdown below 93.3 invalidates bullish thesis and targets 87.4–80 zones.
Impact on Crypto & Gold and its Correlation and Scenarios:
Historically, DXY has had an inverse correlation to both gold and crypto markets. When DXY strengthens, liquidity tends to rotate into dollar-denominated assets and away from risk-on trades like crypto and gold. When DXY weakens, it typically acts as a tailwind for both Bitcoin and gold.
Correlation Coefficients:
DXY vs. Gold: ≈ -0.85 (strong inverse correlation)
DXY vs. TOTAL (crypto market cap): ≈ -0.72 (moderate to strong inverse correlation)
Scenario 1: DXY Rallies toward 115–126 then, Expect gold to correct or stagnate, especially if yields rise. Crypto likely to pull back or remain suppressed unless specific bullish catalysts emerge (e.g., ETF flows or tech adoption).
Scenario 2: DXY ranges between 93–105 then Gold may consolidate or form bullish continuation patterns. Then Crypto may see selective strength, particularly altcoins, if BTC.D declines.
Scenario 3: DXY falls below 93 and toward 87 Then Gold likely to rally, possibly challenging all-time highs. Crypto could enter a major bull run, led by Bitcoin and followed by altcoins, fueled by increased liquidity and lower opportunity cost of holding non-USD assets.
Understanding DXY’s direction provides valuable insight for portfolio positioning in macro-sensitive assets.
Notes & Disclaimers:
This analysis reflects a technical interpretation of the DXY index and is not financial advice. Market conditions may change based on unexpected macroeconomic events, Fed policy, or geopolitical developments.
Will Fed rate cuts provide further upside for US500?
On the eve of the FOMC meeting, US indices traded cautiously as stronger August retail sales reignited concerns over inflation risks. Retail sales rose 0.6% MoM, beating the 0.3% consensus. Charles Schwab noted that despite weak August jobs data, consumer spending remains resilient, supporting Q3 growth.
Industrial production also surprised to the upside at 0.1% (cons. -0.1%), with manufacturing output—the largest component—up 0.2% on a rebound in autos.
US500 remains within the ascending channel, maintaining a steady uptrend. The widening gap between both EMAs suggests the potential continuation of bullish momentum. If US500 holds above both EMAs, the index may gain upward momentum toward the psychological resistance at 6700. Conversely, if US500 breaks below the 6530 support, the index could retreat toward 6340.

DXY vs. EURUSD – Pre-FOMC DivergenceDollar Index (DXY)
Yesterday’s move was fully absorbed inside a tight range, leaving the internal range high at 99.804 ahead of the Fed meeting.
Liquidity is at 98.00 stacked above that zone; market makers could easily run the stops toward the 98 handle before any larger downside move.
EURUSD
Meanwhile, EURUSD broke out of its major range, giving us a new weekly structure with a key reference low at 1.13914.
Cross-Market View
This sets up a classic divergence:
Dollar – trapped in a premium sell range, heavy liquidity overhead.
Euro – fresh upside structure.
For cross-pairs this often means sharp pullbacks or erratic price action as we approach the FOMC decision.
Trade Notes
Stay nimble and keep stops tight.

The Buck’s Getting Bucked“Rule #1: Respect Bitcoin.
Rule #2: When you think you’ve respected it enough…double it.
Big players like BlackRock manage trillions of dollars.
They usually keep their money in things like U.S. dollars and government bonds because that’s been the “safe spot” forever.
But the dollar keeps losing buying power and the U.S. keeps adding debt.
So these big funds are starting to put a small slice of their cash into Bitcoin—a digital money that nobody can print more of.
It’s not that the dollar is disappearing tomorrow.
They just want a backup that can’t be inflated away.
When companies with that much money start buying, it makes Bitcoin look less like a fad and more like the next big “store of value.”

EUR/USD Eyes 1.1790 as Fresh U.S. Dollar Data Weakens GreenbackThe dollar softened in early Thursday trade after fresh U.S. macro data signaled cooling inflation and reinforced expectations for a Fed rate cut later this year.
At the same time, the European Central Bank held rates steady and avoided a strongly dovish tone, allowing the euro to regain momentum.
US CPI Surprise: Latest print came in below forecasts, pushing Treasury yields lower and pressuring the dollar.
Fed Rate-Cut Odds: FedWatch now shows increased probability of a 25-bp cut at the next meeting.
ECB Hold: ECB kept policy unchanged and stressed data-dependence, which markets interpret as neutral rather than dovish.
Higher-time-frame structure shows the next clean liquidity pocket near 1.1790–1.1800.
Next Target: 1.17902 if daily orderflow sees bullish momentum, we have euro news ahead also!

US stocks hold near record highs on strong 2Q earnings
Despite elevated valuation pressures, US equities remain near all-time highs. While tariff concerns persist, resilient US economic data continues to support the market's upward momentum.
United Airlines reported a 1.7% YoY increase in 2Q revenue, citing easing geopolitical and macroeconomic uncertainties and a double-digit rebound in corporate demand. Meanwhile, earnings and share performance among mega-cap stocks have also been strong.
Netflix (NFLX) beat market expectations with 2Q revenue of $11.08 billion and EPS of $7.19. At the same time, Nvidia (NVDA) reached a fresh all-time high on renewed optimism over a potential resumption of exports to China.
After testing the support at 6285, US500 rebounded and approached its previous high again. The index holds above EMA21, suggesting the continuation of bullish momentum. If US500 remains above both EMA21 and the support at 6285, the index could breach the 6320 high. Conversely, if the US500 breaks below the support at 6285, the index could retreat further toward 6200.

US Dollar Index (DXY) – Testing Long-Term Channel SupportBy MJTrading:
Chart Overview:
The US Dollar Index has now approached a major technical confluence zone that could define the next directional move. Price is pressing into the Danger Zone near the lower boundary of a multi-year descending channel, with an Ultimate Oversell Target sitting just below.
🔹 Key Technical Highlights:
Long-Term Down Channel (Daily & Weekly):
The DXY has respected this structure for several years.
Price is currently challenging the lower boundary, a zone where reactions often occur.
Danger Zone (~95–96):
A historically reactive area.
Prior demand and channel floor converge here.
Ultimate Oversell Target (~89–90):
Marked as a deeper potential exhaustion area if the channel fails.
Moving Averages:
15 EMA ~97.8
60 EMA ~99.3
Price remains below both EMAs, confirming persistent bearish momentum.
🔹 Potential Scenarios:
Scenario A (Green Path):
A bounce off current support could trigger a relief rally back toward 98–100, targeting the mid-channel and EMAs.
Scenario B (Red Path):
A breakdown below ~95 could accelerate selling pressure, aiming for the Ultimate Oversell Target (~89).
🔹 How I See It:
This is a high-risk inflection zone. Any bullish setups here remain counter-trend and require confirmation via strong reversal signals. Conversely, a decisive breakdown could have significant implications for USD pairs and commodities.
💡 Notes:
This chart includes the weekly inset view for broader context.
Keep risk management tight in this volatile area.
🔹 Reminder:
This idea is for educational purposes only—not financial advice.
💬 How are you positioning around the USD? Share your thoughts and charts below!
#Hashtags:
#MJTrading #DXY #USDollarIndex #Dollar #Forex #TechnicalAnalysis #TradingView #ChartAnalysis #PriceAction #FX #USD #Majors #DollarWeakness #DollarStrength #SupportAndResistance #TrendAnalysis #MarketOutlook

Russell 2000 - one more drop to complete the correction?Looking for the double zig zag correction to complete (Y) leg in the blue zone. Will be looking for five waves to the downside for the target.
Updated the wave count from my previous chart below...
This drop from the 25th November 2024 to the expected target zone would be more or less similar to the Covid drop in terms of percentage.

Russell 2000 - 5th wave of Y leg may already be in progress... The rejection at 2100 price level also happens to be the 38.2% Fib of the decline from the 14th of February 2025. The decline from 6th of February 2025 counts beautifully as waves 1, 2, 3 & 4. If this wave count is correct, then the Russell is currently in wave 1 of 5 of Y of (ii).
This is my primary wave count as long as the 2100 resistance is not breached.
This changes my initial wave count from a complex WXYXZ to a simple WXY.
Click on the link to see the previous wave count which is still valid and is now an alternate wave count if the 2100 resistance is breached:
Only updating the wave count. My bias and direction remain the same.
Wave Y is possibly in progress. Looks like we are going to have a bearish April & possibly May as well. Selling corrective rally is still the way to trade for now. Take profit at 1905/1900, which is where technically, the Russell 2000 will possibly turn up for wave (iii).
Stop Loss can be placed above wave 4, well out of the way in case of any wild swing on this PCE Friday.

Russell 2000 - time to Buy pullbacks...Shorts were good while it lasted... looks like a good time to buy pullbacks.
It would be wise to wait for a clear 3 wave correction though.
Elliot Wave Analysis shows a larger degree wave IV was completed in March 2020.
Since then, the Russell 2000 has been nesting within a bullish rectangle chart pattern, possibly working its way up to the larger degree wave V.
Seasonality Chart shows a bullish April with a possible correction in May.
Nevertheless, I will not commit to long trades till the chart clearly shows that we are out of the woods. A clear 3 waves move down closer to 1800 in the hourly/4 hourly time frame would be a good setup.

Dollar Index(DXY) Rebounds from Key Support–Is a New High Cominghello guys.
Let's see what happened for us index and what will happen:
Uptrend Support:
The price has been respecting a long-term ascending trendline since 2011, indicating a strong bullish structure.
Recent price action suggests that the index retested this trendline and bounced off it.
Key Resistance & Breakout Potential:
The index is in a consolidation phase after reaching a local high.
If the price holds above the trendline and breaks the previous high (~13,250-13,400), it could trigger further upside movement.
The next potential target is near 13,500-13,800 based on historical price action and Fibonacci extensions.
-------------------------------------------------
Possible Scenario:
Bullish Case: If the price holds above the trendline and breaks the current range resistance, it could continue toward new highs.
Bearish Case: A breakdown below the 12,800 support level could lead to a deeper correction toward 12,400-12,000.
-------------------------------------------------
Consequences of This Move:
For USD Strength:
A bullish continuation in the Dollar Index means a stronger USD, which could negatively impact commodities (gold, oil) and emerging market currencies.
Forex pairs like EUR/USD and GBP/USD could decline as the USD gains strength.
For Global Markets:
A weaker DXY (if the support breaks) would typically support equity markets and commodities like gold and Bitcoin, as a weaker dollar makes them more attractive.
-------------------------------------------------
Conclusion:
The chart suggests bullish momentum, but confirmation is needed with a breakout above 13,250-13,400.
As long as the price respects the trendline and Fibonacci support, the uptrend remains intact.
Keep an eye on macroeconomic events (e.g., Fed rate decisions, inflation data), as they can impact this movement significantly.

Combined US Indexes - Breakdown and JittersMarked out previously, the US indexes broke down a tad earlier and retested to fail only to drop further based on jitters and jitter-induced expectations.
While the candlestick is long and solid pretty much, there is an extension zone to expect more of the downside to overreach and be oversold before a bounce.
You should be able to see that the Buy Setup is pretty much done and can expect a bounce reversal soon... but only after momentum ebbs and a base support is found.
Watch for it...

US Index Bullish after the FOMC Fed rate Cut off to 4.5US index bulish after the FOMC Fed rate cut.
Now the Price is still at 108.133 and the last resistance was break on the current level and wait for the confirmations
The next level will be 109.156 and 109.954.
The USD positive impact will have a negative impact on major pairs and gold; be careful when opening the trades.
*Note:
When the USD idex is strongly bullish and sentiments also show the data will impact after the gold bullish recovery.

US INDEX (DXY) To 99 in 2025hello friends
DXY has reached or a strong daily resistance zone and creating a double TOP and rejection 2 test on trend line gold markets are show u why its dropping technically there is many other things showing weakness in $ from there are Fundamentally also something not going good for $ so we don't miss type of historical moves share Ur thoughts with us
Stay tuned

Continued fall of the dollar index DXY. H4 30.09.2024Continued fall of the dollar index DXY
The dollar index is moving downwards without changes. There was an attempt to trade, above which it was not allowed to consolidate and eventually fell. I showed this in the last analysis and now I am aiming at the support levels around 99.20. Perhaps they will just make a false update of the low and come back, it is not known in advance, but at the moment we are trading near the visible support and so far without an upward reaction. Therefore, 99.20 is the next strongest level in recent years and it is ideal to test it before a reversal.
TVC:DXY

Working off the rise in the dollar index DXY. H4 09.09.2024Working off the rise in the dollar index DXY
Last week I expected the dollar index to rise to the area of 102 and higher. We made a pullback on it, but the depth of the correction was bigger than initially expected, but it did not affect the result. Now they are making a rebound to 102, but then might correction around 102.30. On Thursday we will know the US inflation for August and the unemployment rate on Friday. On this news the main movements on the dollar will be made.

Resistance is ahead! Can the Dow Jones make a break through?
The index is clearly demonstrating a strong upward trend, consistently achieving higher highs and higher lows.
During this upward movement, it previously established a bullish Pole & Flag pattern, and after breaking out, the index has continued to rise.
At present, the index is trading just beneath its next resistance level.
If the Dow Jones manage to break through and hold above this breakout point, it is likely to initiate a new rally.
