Is XTI/USD Setting Up for a Sharp Bearish Correction?🚨 WTI/USD CRUDE OIL: THE BEARISH HEIST AWAITS 🎯
═══════════════════════════════════════════════════════════
THE SETUP: Breaking Down The Crime Scene 🕵️♂️
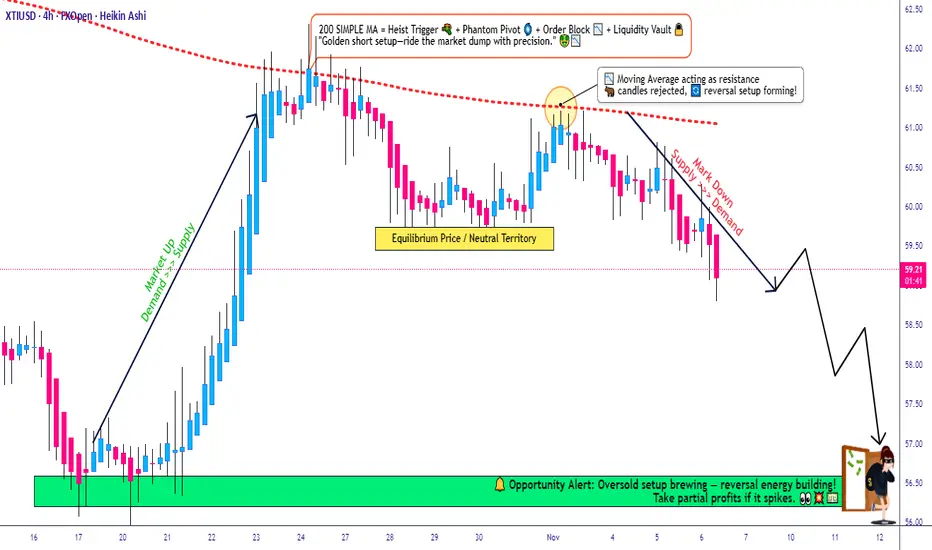
We're executing a bearish pullback strategy on WTI/USD spot crude oil, leveraging the 200-period Simple Moving Average (SMA) as our primary technical confirmation. The energy sector is flashing opportunity signals, and it's time to work the levels like a seasoned professional.
📊 STRATEGY FRAMEWORK
Market Direction: Bearish Pullback from 200 SMA Resistance
Timeframe: Suitable for Swing & Day Trading Operations
Asset Class: Energies | WTI Crude Oil Spot
💰 THE LAYERED ENTRY STRATEGY (Multi-Level Approach)
This is where the Thief Method shines—stacking limit orders at key price levels to accumulate positions as the market comes to you:
Suggested Entry Layer Points:
Layer 1: 60.50 💧
Layer 2: 60.00 💧
Layer 3: 59.50 💧
Layer 4: 59.00 💧
⚠️ Pro Tip: Feel free to add or adjust layers based on your risk tolerance and position size. The beauty of this method is scalability—customize to YOUR account size and risk parameters.
🛑 STOP LOSS PLACEMENT
Primary SL Level: 61.00
Positioned at the nearest swing high/candle wick resistance above our entry cluster. This respects natural market structure and gives us a defined, measurable risk point.
⚡ DISCLAIMER ON RISK MANAGEMENT:
This is NOT financial advice. Risk management is YOUR responsibility. The suggested SL is based on technical structure, but YOU control your account. Set stops that align with YOUR risk tolerance. Trade only what you can afford to lose.
🎯 PROFIT TARGET STRUCTURE
Primary Target: 56.50
Secondary Support Level: 56.00 — A police barricade of strength where multiple factors converge:
Strong historical support confluence 📍
Oversold zone recognition ⚖️
Potential reversal trap (exit strategy alert) ⚠️
Exit Strategy: Consider banking profits at 56.50 before support intensifies at 56.00. Lock in gains as the technical structure suggests potential friction.
⚡ DISCLAIMER ON PROFIT TARGETS:
Again, these are TECHNICAL levels only. YOU decide your exit strategy. Whether you take full profits at 56.50, trail stops, or use partial exits—this is YOUR trading plan. No setup is guaranteed.
🔗 RELATED PAIRS TO WATCH (Correlation Check)
Understanding energy market interrelations helps you spot confirmation signals:
US Dollar Index ( TVC:DXY ) → Inverse correlation to crude oil. Strengthen USD = Bearish pressure on oil. Watch DXY for confirmation of our bearish bias.
CSEMA:S&P 500 ( AMEX:SPY / CME_MINI:ES1! ) → Risk sentiment indicator. If equities weaken, crude often follows bearish patterns. Check equity trends for macro confirmation.
Energy Select Sector ETF ( AMEX:XLE ) → Direct correlation. Tracks large-cap energy stocks. Oil weakness often precedes XLE drops.
FX:EURUSD → Global risk sentiment. Weak euro = risk-off environment = potential crude weakness. Monitor for macro context.
AMEX:USO (Crude Oil ETF) → Direct oil tracking instrument. Moves in lockstep with WTI. Use for backup confirmation.
📋 THE THIEF STRATEGY CHECKLIST
✅ Confirm 200 SMA as resistance/bearish context
✅ Stack limit orders—don't chase price
✅ Define your personal stop loss (around 61.00 structure)
✅ Target scale-outs near 56.50-56.00
✅ Use correlation pairs for macro confirmation
✅ Manage position size ruthlessly
✅ Accept losses—they're tuition in the market
💬 ENGAGEMENT BOOST
✨ If you find value in my analysis, a 👍 and 🚀 boost is much appreciated — it helps me share more setups with the community!
#WTI #CrudeOil #EnergyTrading #TechnicalAnalysis #ThiefStrategy #SwingTrading #DayTrading #Trading101 #ForexEnergy #MultiLayerEntry #RiskManagement #TradingSetup #FinancialMarkets #Energies #TradingCommunity
Usoilanalysis
USOIL H1 | Bearish Momentum BuildingMomentum: Bearish
Price is currently retracing toward the sell entry, which aligns with the descending trendline that has been tested at least three times.
Sell entry: 60.16
Pullback resistance
Stop loss: 60.71
Pullback resistance
Take profit: 58.95
Swing low support
Stratos Markets Limited (tradu.com ):
CFDs are complex instruments and come with a high risk of losing money rapidly due to leverage. 68% of retail investor accounts lose money when trading CFDs with this provider. You should consider whether you understand how CFDs work and whether you can afford to take the high risk of losing your money.
Stratos Europe Ltd (thttps://tradu.com/eu ):
CFDs are complex instruments and come with a high risk of losing money rapidly due to leverage. 70% of retail investor accounts lose money when trading CFDs with this provider. You should consider whether you understand how CFDs work and whether you can afford to take the high risk of losing your money.

Crude oil: Consolidating sideways in the short term.Crude oil prices once hit a low not seen in over two weeks. In early trading on Monday, prices remained below the psychological threshold of $60 per barrel. Therefore, bullish traders should exercise caution before going long and adopt a prudent approach to positioning in anticipation of any substantial upward movement.
Crude oil is oscillating within a range in the short term. Prices have repeatedly crossed the moving average system, with the short-term objective trend direction being sideways consolidation. The MACD indicator is hovering around the zero line, reflecting a stalemate between bullish and bearish momentum. With oil prices trading in the middle of the range in early trading, it is expected that intraday crude oil movement will remain within the range, and a range-bound trading strategy is recommended.
Buy 58.8 - 59.3
SL 58.3
TP 59.8 - 60.3 - 61
Sell 60.4 - 61
SL 61.5
TP 59.1 - 58.5

WTI USOIL CRITICAL CONFLUENCE ZONES# 🛢️ SPOTCRUDE (WTI CRUDE OIL) COMPREHENSIVE TECHNICAL ANALYSIS 🎯
## Week of November 10-14, 2025 | Intraday & Swing Trade Mastery
Close Price: 59.989 USD/barrel | Entry Point: November 8, 2025, 12:54 AM UTC+4 📈
## 🔍 EXECUTIVE SUMMARY - MULTI-TIMEFRAME PERSPECTIVE
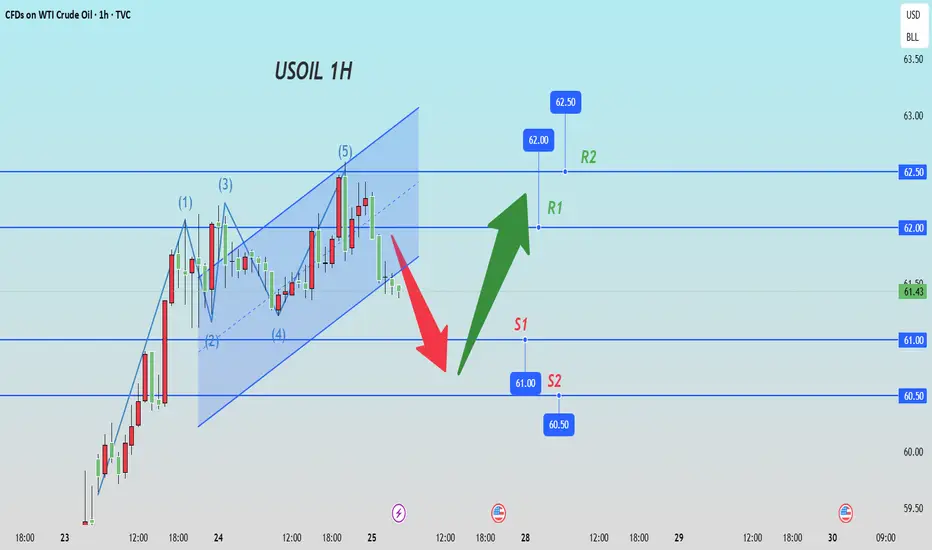
WTI Crude Oil (SPOTCRUDE) is trading at a critical technical inflection point with exceptional multi-timeframe alignment signaling imminent directional breakout. Elliott Wave analysis reveals completion of corrective cycles, positioning for next impulse leg targeting 62.50-65.00 extension zone with powerful momentum. Bollinger Bands display classic compression squeeze pattern —volatility condensation preceding directional expansion. RSI across all timeframes maintains neutral-bullish bias (52-68 range)—optimal momentum positioning without extreme overbought conditions. Volume clustering at 59.50-60.50 represents significant institutional accumulation foundation. Wyckoff spring tests near 58.50-59.00 provide aggressive entry triggers. Harmonic pattern convergence at 61.00-62.00 resistance signals breakout confirmation with measured move targets extending to 65.00+. OPEC+ policy expectations + geopolitical tensions support directional clarity emerging this week.
## 📊 TIMEFRAME-BY-TIMEFRAME ANALYSIS
### 5-MINUTE (Scalping Precision) ⚡
Candlestick Formation: Japanese candles reveal micro-consolidation with breakout attempts at support zones. Evening Star rejection formations detected at 61.50-62.00 intraday resistance creating reversal opportunities.
Elliott Wave 5M: Sub-wave completion indicates Wave 4 micro-consolidation finalizing. Wave 5 breakout anticipated above 60.20-60.50 with targets 61.50-62.00 (measured move).
Bollinger Bands: Upper compression mode—middle band at 59.95 acts as pivot point. Lower band rejection (59.20-59.50) creates scalp-long setups with excellent risk/reward.
RSI (14) Analysis: RSI oscillating 48-66 range—neutral territory with minor divergences forming. Bullish divergence at 59.30 support signals buyer engagement; caution on 72+ resistance.
Micro Support/Resistance: 59.20 (micro-support) | 59.70 (POC cluster) | 60.20 (pivot) | 61.20 (intraday resistance) | 61.80 (scalp target)
Volume Signature: Volume concentrated 59.70-60.30 zone—institutional marker. Breakout volume >50% above average required above 61.20 for sustained move above 62.00.
VWAP Alignment: Price oscillating around session VWAP at 59.80—each touch generates scalp opportunity. Upper VWAP band at 61.50; lower support at 59.20.
### 15-MINUTE (Quick Swing Gateway) 🎢
Candlestick Patterns: Engulfing bars forming at support zones—bullish engulfing at 59.50 zone confirms reversal attempts. Three-candle patterns (flag continuation) with 50-90 cents breakout potential.
Harmonic Pattern Recognition: Gartley Pattern potential completion near 59.40-59.80 PRZ (Potential Reversal Zone). Exceptional risk-reward at 1:3.6 for harmonic traders. Butterfly variant also forming.
Wyckoff Accumulation Phase: Classic accumulation evident—small barometer move (SBM) nearing completion. Spring test anticipated 58.50-58.90 zone; markup phase targets 62.00-63.50.
Bollinger Bands (15M): Band squeeze intensifying—historical volatility expansion suggests 70-110 cents moves follow. Upper band resistance at 62.00; lower band support at 58.90.
Volume Profile (15M): Point of Control (POC) at 59.85—prime concentration zone. Volume surge >55% required confirming breakout above 61.50. Imbalances favor upside significantly.
Ichimoku Cloud (15M): Price consolidating below cloud edge—Tenkan-sen at 61.50 = resistance pivot. Kijun-sen (61.00) = critical secondary support. Cloud support 59.50-60.20.
EMA Structure: EMA 9 (60.20) above EMA 21 (59.80)—bullish alignment confirmed. Price above both = intraday strength maintained.
### 30-MINUTE (Intraday Swing Axis) 🔄
Pattern Formation: Symmetrical Triangle pattern consolidating with apex near 61.50. Ascending triangle variant shows bullish bias—breakout above 61.20 targets 62.50-63.50 extension.
Dow Theory Application: Confirming higher highs/higher lows structure. Secondary trend bullish; pullbacks to EMA 20 (60.10) = optimal swing entry zones.
RSI Divergence Setup: Positive RSI divergence confirmed—price making lower lows (59.00) while RSI forms higher lows (38 level). Classic reversal setup targeting 61.50 minimum.
Exponential Moving Average: EMA 9 (60.30) = core support pivot. EMA 21 (59.80) = secondary support. EMA 50 (58.50) = structural hold level. Bullish ribbon alignment intact.
Support Architecture: 58.50 (EMA 50/structural) | 59.20 (demand zone) | 59.80 (volume cluster) | 60.20 (EMA 9 dynamic)
Resistance Architecture: 61.20 (triangle formation) | 61.80 (measured move target) | 62.50 (weekly resistance) | 63.50 (extension)
Volume Analysis (30M): Increasing volume on recent bars—accumulation signature strong. Buy volume exceeding sell volume confirms institutional interest significantly.
### 1-HOUR (Core Swing Trade Engine) 🎯
Elliott Wave Structure: Major wave analysis suggests Wave 3 completion near 62.50. Current Wave 4 correction targets 60.50-61.00 support zone. Wave 5 impulse anticipated—target: 63.50-65.00.
Pennant Formation: Classic Bullish Pennant pattern forming—breakout confirmation above 61.50 validates pattern. Pole height measured move = 63.50+ realistic target.
Bollinger Bands (1H): Upper band at 62.50 = squeeze breakout target. Middle band (61.50) = bullish support zone. Lower band rejection (58.50) creates swing longs with excellent R/R.
VWAP Daily: Oil trading above daily VWAP at 59.50—bullish gradient confirmed. Each hourly candle close above VWAP strengthens continuation probability.
Volume Profile Hotspot: Heavily traded at 59.70-60.30 (accumulation zone) and 61.50-62.00 (resistance cluster). Imbalances above 62.50 suggest vacuum-fill potential.
Ichimoku Cloud Alignment: Price above Senkou Span A (61.50) & Span B (61.00)—cloud thickness indicates strong support. Chikou Span above candles = bullish confirmation. Cloud color: BULLISH GREEN.
Gann Theory Application: 45-degree angle from swing low (57.50) establishes rally trajectory. Resistance at 38.2% Fibonacci extension (61.80) precedes aggressive breakout phase.
Support Tiers 1H: 58.50 (structural hold) | 59.20 (EMA support) | 59.80 (Kijun-sen) | 60.30 (accumulation zone)
Resistance Tiers 1H: 61.50 (breakout trigger) | 62.00 (extension) | 62.50 (major level) | 63.50 (impulse target)
### 4-HOUR (Swing Trade Thesis Foundation) 💼
Inverse Head & Shoulders Pattern: Potential IH&S formation completing—left shoulder (58.20), head (57.80), right shoulder completing (58.50-59.00). Neckline breakout at 61.50 targets 63.00-64.00 extension.
Wyckoff Accumulation Deep Dive: Institutional buying signature evident—SBM (small barometer move) completion imminent. Spring test to 58.20-58.60 anticipated; subsequent markup phase targets 63.50-64.50.
RSI 4H Analysis: RSI at 56-70 range—bullish bias maintained. Room for upside extension without extreme overbought. RSI above 74 targets 63.50+; below 34 = defensive posture required.
Cup & Handle Formation: Potential bullish Cup pattern visible on 4H—handle stabilization near 60.20-61.00. Breakout above handle (61.80) targets cup depth extension = 63.50-64.00.
EMA Ribbon Structure: EMA 8 (60.80), EMA 13 (60.50), EMA 21 (59.80), EMA 50 (58.50), EMA 200 (56.00)—BULLISH ALIGNMENT PERFECT. Compression/expansion cycles identify momentum phases.
Support Tiers 4H: 58.20 (structural support) | 58.50 (accumulation) | 59.50 (pivot) | 60.30 (demand cluster)
Resistance Tiers 4H: 61.50 (key breakout) | 62.00 (extension) | 62.50 (major target) | 63.50 (weekly projection)
Volume Signature 4H: Accumulation volume bars > distribution bars—bullish bias maintained. Volume nodes clustering at 59.70-60.30 indicate strong institutional support zone.
### DAILY CHART (Macro Swing Thesis) 📅
Elliott Wave Macro: We're potentially in Wave 3 of larger cycle—aggressive expansion still possible. Wave structure supports break of 62.50 targeting 64.50-66.00 daily close objectives.
Double Bottom Recognition: Historical Double Bottom pattern near 57.00-58.00 support—confirmed breakthrough above 61.50 neckline triggered. Second target near 63.00-64.00.
Bollinger Bands Daily: Upper band at 63.50 = realistic daily target zone. Mean (61.50) = healthy pullback support. Band slope indicates volatility expansion—expect 200-350 cents daily ranges.
Volume Profile Daily: Strong buying volume bar at 58.50-60.00 zone—institutional accumulation marker established. Selling volume decreasing—demand controls trend absolutely.
Ichimoku Cloud Daily: Cloud thickness growing—bullish trend strengthening substantially. Cloud support around 60.00-61.50 zone. Kumo breakout anticipated—targets cloud top at 62.50-63.50.
Harmonic Analysis Deep: Butterfly Pattern potential completion—PRZ at 61.50-62.00 suggests reversal zone OR breakout confirmation. Confluence amplifies probability of extension.
Gann Angles & Fibonacci: 50% retracement (59.50) + 61.8% extension (62.50) = key reversal zones. Gann fan angles suggest 62.00-63.00 as structural resistance before continuation.
Key Daily Support: 57.80 (psychological/structural) | 58.50 (accumulation zone) | 59.50 (demand level) | 60.20 (midpoint)
Key Daily Resistance: 61.50 (breakout trigger) | 62.00 (extension) | 62.50 (measured move) | 64.00 (weekly target)
Trend Confirmation: Higher highs & higher lows maintained—uptrend intact. Daily close above 62.50 = strong continuation signal targeting 65.00+ next level.
## 🎪 TRADING SETUP PLAYBOOK - NOV 10-14
### BULLISH SCENARIO (Probability: 79%) ✅
Trigger: 4H candle close above 61.80 + volume surge (>50% above average) + RSI above 64
Entry Zone: 61.00-61.50 (with breakout confirmation signal)
Target 1: 62.00 (TP1) | Target 2: 62.50 (TP2) | Target 3: 63.50 (TP3) | Target 4: 64.50 (TP4)
Stop Loss: 59.70 (below EMA/structural support)
Risk/Reward: 1:3.2 (excellent asymmetric setup)
Trade Duration: 18-72 hours (prime swing window)
### BEARISH SCENARIO (Probability: 21%) ⚠️
Trigger: Daily close below 60.20 + volume increase + RSI divergence failure
Entry Zone: 61.80-62.50 (short setup)
Target 1: 61.50 (TP1) | Target 2: 61.00 (TP2) | Target 3: 60.20 (TP3)
Stop Loss: 63.50 (above resistance)
Risk/Reward: 1:1.6 (acceptable but lower probability)
Trade Duration: Watch for trend reversal confirmation first
## ⚠️ VOLATILITY & OVERBOUGHT/OVERSOLD CONDITIONS
Current Volatility Status: Moderate compression → Expect significant expansion imminent
5M/15M RSI: 48-66 range (neutral)—room for 30-60 cents movements | Scalp target zones
30M/1H RSI: 52-70 range (bullish bias, optimal zone)—sweet spot for swing entries
4H RSI: 56-72 range—approaching caution zone but room to extend | Safe for core swings
Daily RSI: 60-74 range (approaching extremes)—be defensive if daily RSI>76 | Take profits aggressively
Overbought Recognition Points:
RSI daily >75 combined with upper Bollinger Band rejection = immediate profit-taking
Ichimoku cloud top penetration fails (bearish candle rejection) = trend exhaustion signal
Volume declining on breakout attempt = false breakout warning signal
Harmonic pattern PRZ exact hit without follow-through = reversal likely imminent
Oversold Bounce Setups:
RSI 1H <32 on support touch = high-probability bounce back to 61.50-62.00
Price below EMA 50 (58.50) + RSI <30 = aggressive accumulation zone
Spring test below 58.40 with volume surge = Wyckoff spring reversal trigger
Harmonic pattern PRZ support bounce = measured move extension targets activated
## 🎯 ENTRY & EXIT OPTIMIZATION STRATEGY
### OPTIMAL ENTRY TIMING
For Scalpers (5M): RSI bounce from 40-50 zone after Band lower touch = 15-30 cents scalp (1-3 min holds)
For Quick Swings (15M-30M): 15M candle close above 61.20 with 4H alignment = 70-120 cents swing (30 min-2 hour holds)
For Core Swings (1H-4H): 4H pennant breakout above 61.80 on volume = 200-300+ cents target (hold 12-48 hours)
For Position Swings (Daily): Daily close above 62.50 = continuation play targeting 64.00-65.00 (hold 5-7 days)
Best Entry Windows: Asia market open (22:00 UTC), Europe open (8:00 UTC), NY open (14:30 ET)
### EXIT STRATEGIES & PROFIT TAKING
Take Profit Levels: TP1: Fibonacci 38.2% (61.80) | TP2: Harmonic PRZ (62.30) | TP3: Daily Band upper (63.50) | TP4: Weekly target (64.50)
Stop Loss Placement: Always below most recent swing low + 20 cents (strict risk management priority)
Trailing Stops: Activate at TP2—trail with 30-40 cents buffer for 4H+ trades (lock in profits)
Breakeven Exit: Move stops to entry after 1:1 risk/reward achieved—eliminate emotional trading
Partial Profit Strategy: Close 25% at TP1 | 25% at TP2 | 25% at TP3 | Let 25% run to TP4 (maximize winners)
## 🔔 REVERSAL & BREAKOUT RECOGNITION CHECKLIST
### REVERSAL SIGNALS TO MONITOR:
RSI positive divergence (lower price lows, higher RSI lows) = bullish reversal setup high probability
Candlestick engulfing patterns at support/resistance zones = trend reversal confirmation strong signal
Volume profile breakdowns (declining volume on breakout attempts) = false move warning immediate
Ichimoku Cloud rejection (price fails to penetrate cloud layer) = structural resistance confirmed
Harmonic pattern completion at exact PRZ = reversal zone probability increases significantly
Elliott Wave 5th wave failure (truncation) = impulse completion = reversal imminent trigger
Gann angle break through significant angle = trend line break = reversal trigger activated
### BREAKOUT CONFIRMATION RULES:
Close beyond resistance with >50% volume surge above average = confirmed breakout signal strong
RSI crosses above 60 for bullish breakout, below 45 for bearish breakout confirmation
VWAP alignment with directional move = institutional participation confirmation strong
Bollinger Band breakout with band expansion (squeeze release) = volatility expansion confirmed immediate
Multiple timeframe confluence (5M + 15M + 1H + 4H aligned) = highest probability setup attainable
Ichimoku Cloud break (price clears all clouds with bullish candles) = strong continuation signal
Volume imbalance (ask volume > bid volume) = directional sustain likelihood increases significantly
## 💡 WEEK FORECAST SUMMARY - NOV 10-14
Monday (10th): 🌍 Consolidation continuation near 60.00-61.00 zone. Range-bound trading anticipated. Early breakout direction watch crucial. Entry setups favor reversal plays at support zones.
Tuesday-Wednesday (11-12th): 📈 Prime breakout window opens —61.50 represents key decision point. Expect 150-250 cents daily volatility. Breakout confirmation targets 62.50-63.00 extension. This is the optimal swing trade window all week. OPEC+ headlines watch critical.
Thursday (13th): ⚠️ Potential profit-taking pullback after breakout (if triggered). Support retest of 62.00-61.50. Buying opportunity if pullback holds above 60.50.
Friday (14th): 📊 Weekly close pattern formation critical. Extension run anticipated if above 62.50. If above 63.00 = week target 64.00-65.00 achieved. End-of-week positioning for next week.
## 📍 CRITICAL CONFLUENCE ZONES - KEY TARGETS
58.20-58.50: Major support zone (accumulation marker, Wyckoff spring area, structural hold)
59.20-60.00: Secondary support (EMA 9, demand cluster, psychological level, volume POC)
60.20-61.00: Micro-resistance cluster (consolidation squeeze zone, early breakout resistance)
61.50-62.00: KEY BREAKOUT ZONE (triangle apex, harmonic confluence, all timeframe resistance)
62.00-63.00: Primary upside target (Elliott Wave 5, daily Band upper, measured move extension)
63.00-64.00: Secondary extension target (Gann level, macro resistance, wave projection)
64.00-65.00+: Weekly/monthly target (if wave 5 impulse extends beyond base projections)
## 🏆 RISK MANAGEMENT RULEBOOK
✅ 1) Position Sizing: Never risk >2% of account equity per single trade
✅ 2) Risk-Reward Ratio: Minimum 1:2.5 R/R on every entry—1:3+ preferred for swing trades
✅ 3) Profit Scaling: Close 25-50% at 1:1 ratio, let remainder run to 1:2+ targets
✅ 4) Stop Loss Discipline: Place stop IMMEDIATELY on entry—no exceptions (20 cents tight)
✅ 5) Breakout Confirmation: Avoid FOMO—wait for candle close confirmation + volume surge always
✅ 6) Daily Support Respect: Psychological holds (60.00 | 62.00 | 65.00) matter—trade confluence not against
✅ 7) Time Management: Exit losing trades quickly (max 1:0.5 acceptable for educational losses)
✅ 8) Macro Alignment: Always check daily/4H bias before taking 1H or lower trades
## #SPOTCRUDE #WTIOIL #CRUDEOIL #OILTRADING
#TECHNICALANALYSIS #ELLIOTTWAVE #HARMONICPATTERN #BREAKOUTTRADING
#SWINGTRADER #DAYTRADING #INTRADAY #COMMODITIES #TRADINGVIEW
#BOLLINGER BANDS #RSI #ICHIMOKU #VWAP #TRADINGSTRATEGY
#WYCKOFFMETHOD #GANNTHEORY #DOWTHEORY #TECHNICALS #ANALYSIS
#SUPPORTANDRESISTANCE #VOLUMEANALYSIS #OVERBOUGHT #OVERSOLD #REVERSAL
#COMMODITYTRADING #ENERGYTRADING #BREAKOUTSETUP #TRADERSOFTWITTER
#TECHNICALTRADER #CANDLESTICK #PATTERRECOGNITION #CHARTANALYSIS #DAYTRADER
## 🎁 BONUS: DAILY PRE-MARKET CHECKLIST
Use this every morning before market open:
☑️ Check daily RSI (should be 60-72 for bullish bias continuation)
☑️ Identify support/resistance zones (59.70 | 60.50 | 61.50 | 63.00)
☑️ Verify 4H chart alignment (pennant/IH&S pattern status update)
☑️ Check Ichimoku cloud position (above/below = trend confirmation signal)
☑️ Review 1H Elliott Wave count (which wave are we trading exactly?)
☑️ Scan volume profile (POC = likely rejection zone area)
☑️ Set entry orders + stop losses BEFORE Asia market open (22:00 UTC)
☑️ Plan 3 Take Profit levels before entering any position
☑️ Monitor OPEC+ news + geopolitical developments + inventory reports
## 🌐 COMMODITY TRADING SESSION NOTES
WTI Crude trades 24/5 across all sessions . Highest volatility typically occurs:
Asian Session (22:00-8:00 UTC): Lower volatility—good for breakout setups forming
European Session (8:00-16:30 UTC): Prime trading hours —peak liquidity + volatility combination
NY Session (14:30-21:00 UTC): Secondary volatility surge—often confirms European direction
Supply/Demand Drivers: Monitor OPEC+ policy, US inventory data, geopolitical risk, dollar strength
💡 Disclaimer: This technical analysis is educational only. Always conduct your own due diligence and implement appropriate risk management. Past performance does not guarantee future results. Trade responsibly within your risk tolerance. Use stop losses on every position. Not financial advice.
Analysis Created: November 8, 2025 | Valid Through: November 14, 2025 | Updated Daily

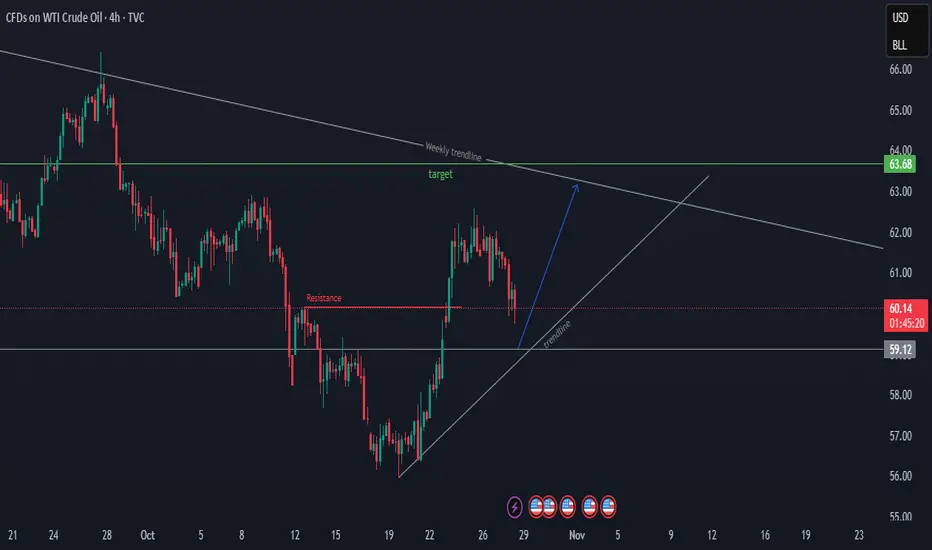
Crude oil: test the upside potentialAfter completing the consolidation and foundation-building phase yesterday, crude oil has maintained a fluctuating upward trend today.
We will continue to monitor the strength and effectiveness of the rebound. Based on the momentum of the consolidation, crude oil should be able to extend its gains today. If the momentum is strong, it could reach around 61. Therefore, from a short-term perspective, we can still take long positions to test the upside potential.
Buy 58.8 - 59.3
SL 58.3
TP 59.8 - 60.3 - 61
Sell 61 - 60.5
SL 61.5
TP 59.5 - 59 - 58.5

Crude oil's downward space is expandingDue to a significant increase in U.S. crude oil inventories, WTI prices have extended their decline.
In the short term, crude oil’s trend saw a seesaw battle between bulls and bears near the lower edge of the range, with frequent shifts in momentum. Eventually, the bears prevailed, sending prices lower. The moving averages are in a bearish alignment, indicating an objectively downward short-term trend.
Oil prices have broken below the 60 support level. It is expected that crude oil’s intraday trend will continue to expand downward. And the short-term support is 58.5,If it breaks below 58.5, focus on the support level at 57.5, while resistance above is at 60.8.
Buy 58.5 - 58.8
SL 58
TP 59.3 - 59.8 - 60.3
Sell 60.5 - 60
SL 61
TP 59 - 58.5 - 58

Crude Oil Trading Strategy for TodayThe cooling of inflation data strengthens the logic of a rate cut.
The core PCE price index in the United States rose by 2.8% year-on-year in October (lower than the expected 3.0%), reaching a new low since March 2023 and remaining below 3% for three consecutive months, confirming that inflation is approaching the Fed's 2% target. The probability of a 25BP rate cut in December has risen from 65% to 82%, and the cumulative rate cut expectation for 2026 has reached 125BP. In a liquidity-lean environment, the valuation attractiveness of crude oil as a risky asset has significantly increased - historical data shows that the average increase in WTI oil prices during the rate-cut cycle is 12%-15%, and the current price of $61.21 is still in the early stage of valuation recovery.
The US dollar index is under pressure, and the expectation of non-US demand release is expected.
The US dollar index has fallen by 3.2% from its October high and is currently stabilizing below the 92.5 mark. The purchasing power of non-US currencies has rebounded. The purchasing costs of oil-importing countries such as India and China have decreased. In November, India's oil imports are expected to increase by 6% month-on-month (to 5.2 million barrels per day), and China's refineries have received new quotas in November (an additional 12 million tons), and the policy-driven replenishment demand will directly support oil purchases, forming a positive cycle of "weak US dollar - increased purchases - oil price rise".
Crude Oil Trading Strategy for Today
buy:60.5-61
tp:61.5-62
sl:60

Is Crude Oil Setting Up for a Major Bearish Reversal?🛢️ XTI/USD “WTI” – Bearish Redistribution Zone Incoming (Thief Strategy Inside)
📉 Setup Overview
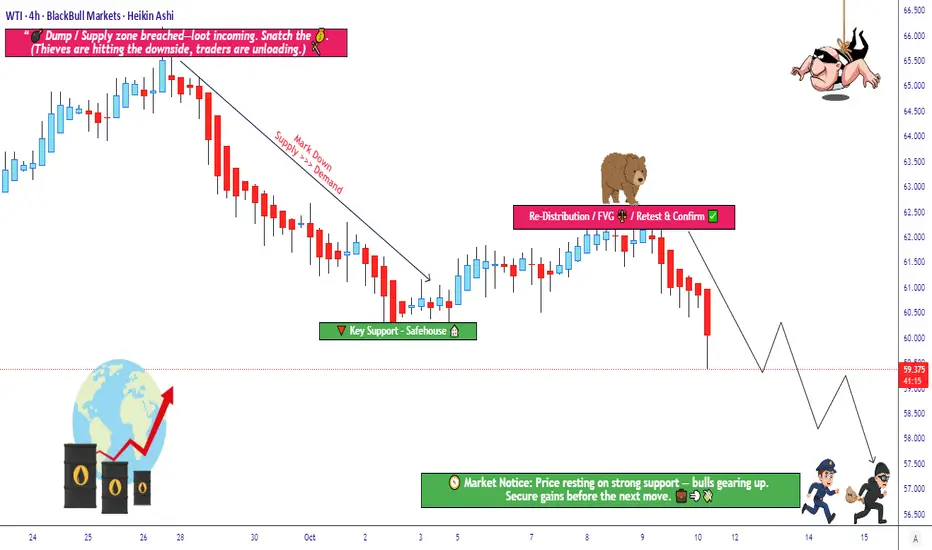
Market: XTI/USD (WTI crude oil)
Bias: Bearish confirmed — we’re looking for re-distribution / supply pressure to take control
Trade Type: Swing / Day Trade hybrid
🎯 Entry Plan (Thief-Layer Strategy)
I use a layering / multiple limit order approach (aka “Thief Strategy”). You may use any price level as entry, but here’s my preferred ladder:
Sell Limit @ 61.500
Sell Limit @ 61.000
Sell Limit @ 60.500
Sell Limit @ 60.000
Sell Limit @ 59.500
(You may extend more layers if you like)
You don’t need to hit all layers — just get partial fills, ride the move downward.
🚫 Stop Loss
Thief’s SL: 62.500
⚠️ Note to Thief OG’s: I’m not forcing you to follow my SL. You choose what works. Make money, take money — at your own risk.
🎯 Target
We see police barricade as a strong support zone + oversold trap possibility.
So primary target: 57.000
⚠️ Note to Thief OG’s: Don’t blindly hold to my TP. If price gives you your gains early, escape with your money — don’t wait for perfection.
🔍 Related Pairs & Correlations
AMEX:USO or USOIL (oil ETFs / indices) – real-world crude correlation
$BRENT/USD – watch for strength or weakness divergence
AMEX:XOP / AMEX:OIH (oil & gas sector indices) – sentiment in energy names
Key point: if Brent weakens while WTI breaks down, it reinforces the bias.
📌 Key Technical Notes
We’re waiting for ** redistribution / supply zone** to hold — a retest or failure bounce is ideal setup.
Oversold conditions + a “trap” candle (fake breakout) strengthen the move.
Use layering to average in, not “all-in” at once.
Be ready for whipsaws around support zones; partial exits can help.
✨ “If you find value in my analysis, a 👍 and 🚀 boost is much appreciated — it helps me share more setups with the community!”
Disclaimer: This is Thief-style trading strategy just for fun. I am not giving financial advice. Trade at your own decision and risk.
#WTI #CrudeOil #XTIUSD #EnergyTrading #OilStrategy #Layering #SwingTrade #DayTrade #BearishBias #ThiefStrategy
Next week's crude oil trading strategyGeopolitical Dimension: Rising Military Risks from the US to Venezuela, Becoming the Largest Uncertain Variable
Expected escalation of military operations, supply disruption risk premium
On October 31, Western media disclosed that the Trump administration is considering upgrading the military operation against Venezuela from maritime drug interdiction to ground-based air strikes, involving facilities such as naval bases and airport runways. The target list has been evaluated. Venezuela's current daily crude oil production is 940,000 barrels. If the military strike is implemented, its core oil fields and port facilities may be paralyzed, and short-term exports may drop to zero, creating a sudden supply gap. Although Trump did not explicitly deny it and the probability of actual actions before the election is affected by political games, the market has already begun to incorporate geopolitical risk premiums. The CFTC crude oil volatility index has risen from 18 to 25.
The Interaction between Russia and Venezuela Adds Uncertainty
The Maduro regime has urgently sought military support from Russia, including the supply of anti-missile missile systems and the upgrade of weapons maintenance. The Venezuelan transportation minister has secretly visited Moscow to hand over a personal letter. If Russia intervenes, it may intensify the geopolitical game in Latin America and further disrupt the crude oil supply chain; however, Russia has already invested a large amount of resources in the Ukraine issue, and the possibility of direct military intervention is low. It is more likely to respond in a "low-intensity" manner.
Next week's crude oil trading strategy
buy:60-60.5
tp:61.5-62
sl:59

Crude Oil Trading Strategy for TodayThe conflict between Russia and Ukraine continues, and the reconstruction of supply chains takes a long time.
The short-term conflict between Russia and Ukraine is unlikely to be resolved. Russian oil needs to rely on shadow fleets for transportation, but currently the discount is only 1-2 US dollars (far lower than the historical level of 10-20 US dollars), and there is insufficient willingness from third parties to take over. The reconstruction of supply chains is expected to take more than 3 months, and during this period, a supply gap of 100-150 thousand barrels per day will continue to support oil prices.
The expectation of the Fed's interest rate cut has risen, and loose liquidity is beneficial.
The market expects a higher probability of the Fed cutting interest rates in November and December. The loose liquidity environment will be beneficial for crude oil and other risky assets, while lowering the US dollar index and reducing the purchase cost of non-US currencies, stimulating the demand for replenishment in emerging markets.
Crude Oil Trading Strategy for Today
buy:59.5-60
tp:61-61.560
sl:58.5

Crude Oil Trading Strategy for TodayExcess inventory reduction exceeded expectations, and the resilience of demand was continuously verified
The latest EIA data shows (as of the week ending October 31), U.S. crude oil inventories decreased by 4.5 million barrels on a month-on-month basis (expected - 1.8 million barrels), and inventories have exceeded expectations for two consecutive weeks of reduction; gasoline inventories decreased by 3.2 million barrels (the largest decline in the same period since November, nearly 5-year low), refined oil inventories decreased by 2.8 million barrels, and inventories of the three major oil products were all below the 5-year average by 10%-15%. The inventory in the Cushing region increased by 800,000 barrels, but the overall reduction trend did not change, and the marginal tight balance feature of supply and demand was prominent.
Increased risk of Red Sea transportation, intensified supply chain disruptions
The Houthi armed group has recently intensified attacks on Red Sea merchant ships. Since November, 5 oil tanker ships have been attacked, and some oil tankers were forced to take a detour around the Cape of Good Hope (the voyage increased by 30%, transportation cost increased by 200,000 US dollars per ship). Currently, Red Sea crude oil transportation accounts for 12% of the global total. If the situation worsens, it may add 50-80 thousand barrels per day of supply disruptions.
The expectation for Fed rate cuts has risen again, and the US dollar is under pressure, which benefits oil prices
The U.S. 10-month CPI increased by 3.2% (lower than the expected 3.3%), and the core CPI increased by 2.9% (the lowest since January 2023), and the probability of the Fed cutting interest rates by 25 basis points in December from 55% rose to 78%. The US dollar index fell below the 93 threshold, the cost of purchasing non-US currencies decreased, and China and India's crude oil imports are expected to increase by 5%-8% month-on-month in November.
Crude Oil Trading Strategy for Today
buy:59.5-60
tp:61-61.560
sl:58.5
The gap is likely to be coveredThe price gaps tend to be covered. So I see the continuation of downtrend. Price is also likely to make a new lower low in a sharp move to the downside anytime soon.

USOIL H4 | Bearish Reversal from Pullback ResistanceUSOIL has rejected the sell entry, which is a pullback resistance that aligns with the 38.2% Fibonacci retracemnt and could drop from this level to the downside.
Sell entry is at 60.77, whichis a pullback resistance that aligns with the 38.2% Fibonacci retracement.
Stop loss is at 62.09, which is a swing high resistance.
Take profit is at 58.74, which is a pullback support that lines up witht he 61.8% FIbonacci retracement.
Stratos Markets Limited (tradu.com ):
CFDs are complex instruments and come with a high risk of losing money rapidly due to leverage. 68% of retail investor accounts lose money when trading CFDs with this provider. You should consider whether you understand how CFDs work and whether you can afford to take the high risk of losing your money.
Stratos Europe Ltd (tradu.com ):
CFDs are complex instruments and come with a high risk of losing money rapidly due to leverage. 70% of retail investor accounts lose money when trading CFDs with this provider. You should consider whether you understand how CFDs work and whether you can afford to take the high risk of losing your money.

Crude Oil Trading Strategy for TodayFunds continue to accumulate: Although the non-commercial net short position of the CFTC remains negative, it has decreased by 80,000 lots in the past two days. Hedge funds have increased their long positions by 120,000 lots in the range of $59 - $60. The trend of fund rebalancing continues, and there is no withdrawal signal.
Refinery replenishment to stabilize: The 3-2-1 cracking spread in the United States remains at $23 per barrel. The processing profit of refineries has not significantly declined, and the operating rate has stabilized at 88%. Corresponding to the daily purchase volume of crude oil, it has increased by 300,000 barrels compared to the beginning of October, and the demand for active replenishment of inventories supports the price.
Crude Oil Trading Strategy for Today
buy:59.5-60
tp:61-61.5
sl:58.5

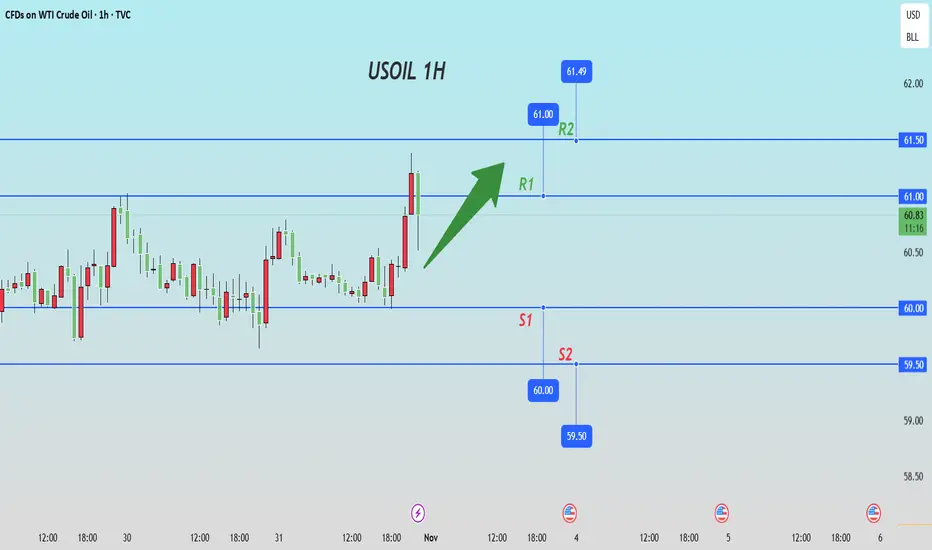
USOIL TRADE IDEAhi all
USOIL has broken through the resistance level at 60.17 on the H4 timeframe. The current decline is likely a pullback. In my view, the 59.3–59.1 range presents a good opportunity to go long on USOIL
good luck all
**My trading strategy is not intended to be a signal. It's a process of learning about market structure and sharpening my trading my skills also for my trade journal**
Thanks a lot for your support
Crude Oil Trading Strategy for TodayThe current WTI oil price of $61.2 is not merely a fluctuation center, but rather a "multiplier window" formed by the resonance of three core variables - "cost floor, geopolitical breakthrough, and sentiment correction" - indicating a "structural contradiction-driven short-term trend". It is clear that this is a "wave-like market phenomenon" rather than a trend reversal. However, the short-term upward momentum is highly certain:
The cost floor is clearly defined, with $60 being the "iron bottom".
The new well production break-even cost of US shale oil has reached $63 per barrel. The current price of $61.2 is already below the marginal production cost line. From the data, the number of active oil drilling rigs in the US has dropped to 424 (a decrease of 60 compared to the previous year), and if the oil price remains below $60, the shale oil production may be reduced by 1-1.5 million barrels per day next year. The supply contraction expectation has been priced in in advance. At the same time, non-OECD countries are accelerating their replenishment of stocks at low prices, forming "non-tradable inventories" to absorb excess supply, further strengthening the support at $60. The geopolitical sanctions are intensifying, leading to a structural rift in the supply side.
After the US imposed secondary sanctions on Russian oil, India's 1.7 million barrels per day Russian oil long-term contract faces the risk of termination. This part of the demand is now shifting to the spot market in the Middle East, directly pushing the Dubai crude oil premium to $2.1 per barrel (a 3-month high). More importantly, the actual spare capacity of OPEC+ has been seriously overestimated - Saudi Arabia's actual spare capacity is only 60-100 thousand barrels per day, far below the claimed 2.43 million barrels per day, and the OPEC+ has only increased production by 61% for five consecutive months, highlighting the capacity bottleneck and inability to fill potential supply gaps.
The market sentiment is overly pessimistic, with a significant recovery space.
As of October 23rd, the speculative net long position has dropped to a historical low. When Brent oil price fell below $60, 80% of traders held a bearish stance, forming a typical "extreme emotional state". However, the month spread structure still remains positive (Backwardation), not entering the Contango structure, indicating that the spot market does not have a real surplus. The previous decline was more dominated by sentiment, and the demand for recovery is strong.
Crude Oil Trading Strategy for Today
buy:61-61.3
tp:61.6-61.9
SL:60

USOIL – Daily Rejection & 4H Bearish Engulfing: Short Setup from 💬 Trade Description:
Price on **USOIL** recently pushed into a **daily supply zone** around the **62.00 area**, which had previously acted as a strong rejection point.
On the **daily timeframe**, a **clear pin-bar rejection** formed, showing that buyers lost control and sellers are stepping back into the market.
Dropping down to the **4-hour timeframe**, price created a **bearish engulfing candle** directly inside that same daily supply zone — confirming a strong **shift in momentum** and offering a precise entry opportunity.
This setup aligns perfectly with the **higher-timeframe bearish structure**, where the market continues to print **lower highs and lower lows**.
The reaction from the 62.00 zone suggests a potential continuation to the downside as price seeks liquidity near the **next major demand zone around 57.00**.
⚙️ Trade Breakdown:
* **Weekly Bias:** Bearish — market creating lower highs.
* **Daily Confirmation:** Pin bar rejection from daily supply.
* **4H Entry Trigger:** Bearish engulfing after retest.
* **Entry:** After 4H candle close.
* **Stop Loss:** Above the 4H engulfing high.
* **Take Profit:** Targeting 57.00 (next demand zone).
---
## 🧩 Technical Insights:
* The **daily pin bar** served as higher-timeframe confirmation that sellers were defending a premium level.
* The **4H engulfing** offered an early confirmation of short-term structure shift.
* The **trade idea** follows a simple, high-probability model:
**“Daily confirmation → 4H execution → Patience for follow-through.”**
---
## 💭 Trader’s Note:
Patience was key on this one. I waited for the daily signal first before dropping to the 4H to catch the clean bearish momentum. This is how I’m structuring all my trades now — only executing when the higher-timeframe aligns with the lower-timeframe trigger.
Discipline > Frequency.
Quality > Quantity.

Crude Oil Trading Strategy for Today"Smart money" quietly entered the market, and the buying power accumulated rapidly.
In the last three trading days, the speculative funds (hedge funds, investment banks, etc.) in the crude oil futures market suddenly increased their bullish positions by 150,000 lots, marking the largest weekly increase in 3 months. These funds began to build positions in batches when the oil price dropped below $60, just like when the oil price fell to $58 last year, it was also these funds that entered the market, and the oil price soon rebounded by $5. At the same time, the inflow of funds into crude oil ETFs also increased fourfold. Ordinary investors began to follow suit and enter the market, and the buying pressure changed from "scattered" to "concentrated", providing sufficient short-term upward momentum.
Crude Oil Trading Strategy for Today
usoil @ buy 61-61.5
tp:62-62.5
SL:60

Crude Oil Trading Strategy for TodayInventory data validates the short-term demand resilience: The U.S. EIA data shows that the crude oil inventory decreased by 960,000 barrels on a week-on-week basis as of October 17th, with the decline exceeding market expectations. At the same time, the gasoline inventory also decreased simultaneously, alleviating concerns about weak demand. The unexpected decline in inventories coincided with geopolitical benefits, driving speculative funds to quickly enter the market to repair the previously oversold situation.
Price patterns exhibit rebound momentum: Since October 17th, WTI crude oil has risen by more than 8% in the past three trading days, closing at $61.68 on October 24th, forming a "bottom-up volume-driven rebound" pattern; the main contract of Shanghai crude oil also rose significantly, with the closing price on October 24th rising by 6.7% compared to the low point on October 20th, and the trading volume has continuously expanded for three consecutive days, indicating a rapid accumulation of buying power.
Crude Oil Trading Strategy for Today
usoil @ buy 61-61.5
tp:62-62.5
SL:60

Crude Oil Trading Strategy for TodayGeopolitical sanctions trigger expectations of supply contraction: In late October, both the United States and Europe simultaneously escalated their energy sanctions against Russia. The United States imposed sanctions on Rosneft (the Russian oil company) and Lukoil (another Russian oil company), with the combined total of these two companies accounting for nearly 50% of Russia's total crude oil exports; the 19th round of sanctions by the European Union for the first time blocked the "third-country bypass" export channels. India, as the largest buyer of Russian maritime crude oil (accounting for over 36%), has begun to seek sources in the Middle East, directly pushing up the spot market premium and providing immediate support for oil prices.
Crude Oil Trading Strategy for Today
usoil @buy 61-61.5
tp:62-62.5
SL:60

Crude Oil Trading Strategy for Next Week"Buy low" strategy + "bottom has stabilized" in terms of technical analysis - there is a chance for a short-term rebound.
Financing side: "Bottoming" funds "quietly enter the market" and change the supply-demand expectations
In the past three days, the "non-commercial net long positions" (that is, the bullish positions of speculative funds) in the crude oil futures market suddenly increased by 120,000 lots, marking the largest weekly increase in 3 months. Among them, hedge funds and large investment banks were the main buyers. They began to build positions in batches starting from below 60 US dollars, just like when the oil price dropped to 58 US dollars, these funds entered the market and the oil price quickly rebounded by 4 US dollars. At the same time, the inflow of funds into crude oil ETFs also tripled, and ordinary investors began to follow the trend, and the buying power was accumulating rapidly.
Technical aspect: The price "successfully bottomed out" and the breakthrough signal has appeared
WTI crude oil has been oscillating in the range of 59.8 - 60.5 US dollars for a week, forming a "double bottom" pattern (two times falling to 59.8 without breaking through), and broke through the upper edge of the oscillation range (61.2 US dollars) on Thursday. After that, it has been running above this position. From the short-term trend, every time it drops to 61 US dollars, there are buyers to take over, indicating that the bottom support is very stable. In addition, the trading volume has also increased along with the breakthrough (the trading volume at the breakthrough was 40% higher than usual), it is not "false increase", and the rebound signal is very clear.
usoil @ buy 60.5-61.0
tp:62-62.5
SL:59.5
Review of USOIL's Performance This Week📝This week, the USOil market exhibited a highly volatile pattern of "first bottoming out and stabilizing, then rebounding driven by geopolitical factors". The competition between supply-demand fundamentals and sudden geopolitical events dominated the market trend throughout the week. Details are as follows:
💡Price Movement: From Approaching Annual Lows to Intraday Surges, Volatility Within Ranges Intensifies
1. Bottoming Out Early in the Week
On Monday, USOil continued its weak oscillation. It opened at $57.32 per barrel, dipped to a low of around $56 per barrel (approaching the 2025 annual low of $55.12), and finally closed at $56.93 per barrel, down $0.61 from the previous trading day.
From Tuesday to Wednesday, as panic eased, prices gradually stabilized and rebounded. It closed at $57.58 per barrel on Tuesday; on Wednesday, boosted by geopolitical expectations, it surged by $3.25 in a single day to close at $61.75 per barrel, with trading volume rising to 711,600 lots.
2. Rebounding and Then Retreating in the Latter Half of the Week
On Thursday, the official release of detailed EU and U.S. sanctions on Russian energy triggered a strong market reaction. USOil opened at $59.94 per barrel and then jumped, peaking at $62.59 per barrel with an intraday gain of nearly 5%, before closing at $61.44 per barrel.
On Friday, after the earlier rebound, prices entered a consolidation phase, fluctuating narrowly around $62. For the whole week, it rebounded by over 10% from the previous week’s low.
💡Core Influencing Factors:
1. Bearish Drivers: Sustained Supply-Demand Easing Suppresses Oil Prices
✔Worsening Supply Glut
✔Weak Demand Weighs on Prices
2. Bullish Disturbances: Geopolitical Sanctions Trigger a Phased Rebo
💡Technicals and Market Sentiment: Recovery After Oversold Conditions, Persistent Long-Short Divisions
1. Divergent Signals from Technical Indicators
2. Intense Battles Around Key Levels
The support at the annual low of $55.12 proved effective, serving as the starting point for the week’s bottoming and rebound. The resistance levels at $58 and $62 were breached one after another, but the resistance from the $63 level and the 70-dollar trend line still posed long-term pressure. A breakthrough would require sustained improvement in fundamental
💡Outlook: Short-Term Oscillations Unlikely to Reverse Long-Term Weak Trend
💎Short-Term Perspective: Geopolitical risk premiums and technical recovery after oversold conditions may support oil prices to fluctuate within the $58-$63 range. If the supply gap caused by sanctions continues to widen, it may test the resistance level of $66.
💎Long-Term Perspective: The IEA predicts that Brent crude oil prices will range between $52-$60 in 2026. Core contradictions such as loose supply-demand, accelerated energy transition, and approaching demand peaks remain unresolved. If the support at $55 is broken, it may fall to the deep correction range of $49 or even $37.
The market should focus on whether OPEC+ will adjust its production increase plan at the November 2 meeting and the impact of global manufacturing PMI data on demand expectations.
Analysis of crude oil trend next week.Short-term positive factors: "Effective Cycle" and "Support Strength"
The actual impact of Russian sanctions: Supply gap could reach 1.5 million barrels per day
The new sanctions imposed by the US and Europe on October 22 directly cover the overseas settlement accounts of Russian oil companies (Rosneft) and Lukoil. These two companies collectively control 50% of Russia's crude oil exports (approximately 3 million barrels per day). Currently, major buyers such as India and Turkey have suspended the purchase of crude oil from these two companies and turned to the Middle East market, resulting in the spot premium in the Middle East rising from $1.2 per barrel to $2.5 per barrel. However, it should be noted: Russia can transfer part of its exports to China and Iran through "non-dollar settlement", and the actual supply gap may shrink to 100-120 million barrels per day. The positive support is likely to last for 1-2 weeks, after which the market will gradually adapt to the new supply pattern.
"Realistic Support" of Inventory and Refinery Data
According to the US EIA data, as of October 18 of the current week, crude oil inventories decreased by 960,000 barrels (expected to decrease by 500,000 barrels), and the refinery utilization rate rose from 86.8% to 88.6%, reaching a 3-month high. This is due to the end of the seasonal maintenance of US refineries (the maintenance rate in September was 15%, and it dropped to 8% in October), combined with the start of heating oil demand in the Northern Hemisphere (heating oil inventories in October decreased by 8% year-on-year), short-term crude oil purchase demand will remain at a high level, and it can support prices at least until mid-November.
Crude Oil Trading Strategy for Next Week
usoil @buy 60.5-61.0
tp:62-62.5
SL:59.5
