USOil Bear Trap Set: Ready For The Downside Raid?🛢️ WTI Oil Bearish Heist Plan 💣 | Thief Trader Layers Activated 🔐
💥 Welcome to the vault raid, Thief OG’s! 💥
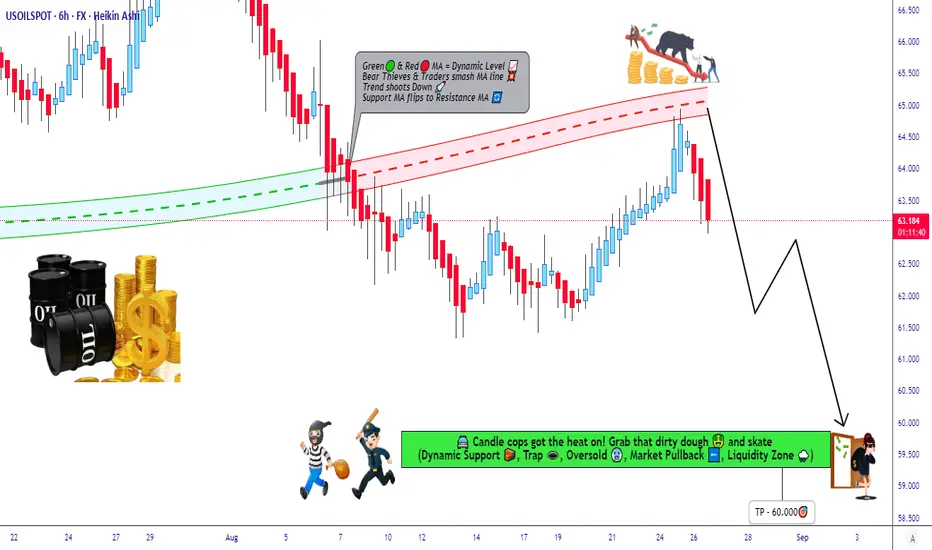
We’re targeting US Oil Spot / WTI (XTIUSD) — and this time, the plan is pure Bearish robbery.
🚨 The Robbery Setup:
This isn’t just a sell — it’s a layered ambush. We place traps, let bulls walk in, and then we rob clean.
📌 Thief Entry Plan (Limit Layers):
Sell Limit @63.000
Sell Limit @63.500
Sell Limit @64.000
Sell Limit @64.500
👉 You can stack more layers if the vault door keeps opening.
🛑 Thief Stop Loss:
SL locked @65.500 🔒
⚠️ Adjust your SL like a true Thief — according to your risk + number of layers.
🎯 Escape Plan (Target):
🚔 Police barricade spotted around 59.000.
📌 Official Heist Exit: 60.000 — grab the loot before the cops arrive.
🧠 Thief Strategy Logic:
Multi-layer sell ambush 🏴☠️
Bearish pressure from supply + demand shifts 📊
Technical rejection zones aligning with macro weakness 📉
⚠️ Risk Management Note:
Thieves don’t rush!
👉 Place alerts before the raid.
👉 Don’t dump blind orders — wait for price to approach layers.
👉 Manage your position like a stealth operation, not a casino gamble.
💬 Thief Community Code:
Smash ❤️ & Boost if you’re with the robbery crew.
Drop your charts + sniper entries below.
We rob together. We win together. 🏆
🔔 Stay locked in — more heist plans dropping soon.
💰 Rob Smart. Trade Sharp. Exit Clean.
Usoilanalysis
USOIL (WTI Crude) – Buy & Sell Trade Scenarios🔵 Bullish Scenario (Buy Call)
Entry Zone: Break and sustained close above 65.20 – 65.50 (current 4H resistance).
Reasoning:
Price has retested the 64.90 resistance cluster multiple times, suggesting absorption of supply.
Volume shows declining sell pressure near resistance – a sign of potential breakout.
A breakout with strong volume confirms buyers stepping in.
Target 1: 66.75 (measured move into next liquidity pool).
Target 2 (extended): 68.20 – 68.50 (previous structural pivot).
Stop Loss: Below 64.20 (false breakout protection).
R:R Potential: ~1:2.5 to 1:3
🔴 Bearish Scenario (Sell Call)
Entry Zone: Rejection at 65.00 – 65.50 resistance with bearish confirmation candle.
Reasoning:
This zone has acted as a strong supply area since mid-August.
Multiple wicks rejecting the level + increasing sell volume hint at distribution.
If price fails to close above resistance, sellers regain control.
Target 1: 63.00 – 63.20 (mid-support range).
Target 2 (extended): 62.00 – 61.90 (major support zone).
Stop Loss: Above 65.70 (wick protection).
R:R Potential: ~1:2 to 1:3
⚖️ Key Technical Takeaway
64.90 – 65.50 = Pivot zone (battle between bulls and bears).
Breakout + volume = bullish continuation to 66.75+.
Rejection + heavy volume = bearish rotation back to 62.95.

Oil Market Faces Balancing Act as Supply Risks Meet Glut FearsOil Market Faces Balancing Act as Supply Risks Meet Glut Fears
Russian supply risks are clashing with growing concerns of a global supply glut as summer winds down. Crude benchmarks gained over 1% in the previous session after the EIA reported a larger-than-expected draw in U.S. crude inventories, though the pace of declines slowed from the prior week.
Analysts warn that OPEC+ unwinding production cuts, combined with rising output from non-member producers, could tip the market into surplus, according to MUFG’s Soojin Kim.
While Brent continues to trade at a near-term premium, signaling tight supplies, that premium has narrowed — a sign of softening demand expectations ahead.

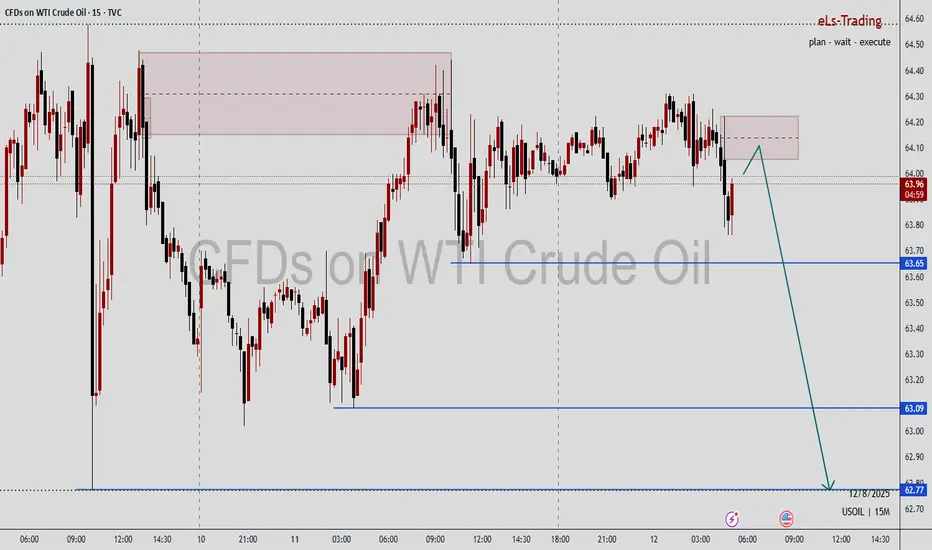
USOIL H4 | Bearish reversal offUSOIL has reacted off the sell entry, which acts as a pullback resistance that aligns with the 50% Fibonacci retracement and could drop from this level to the downside.
Sell entry is at 63.96, which is a pullback resistance that aligns with the 50% Fibonacci retracement.
Stop loss is at 65.00, which is a pullback resistance.
Take profit is at 61.80, which is a swing low support.
High Risk Investment Warning
Trading Forex/CFDs on margin carries a high level of risk and may not be suitable for all investors. Leverage can work against you.
Stratos Markets Limited (tradu.com ):
CFDs are complex instruments and come with a high risk of losing money rapidly due to leverage. 65% of retail investor accounts lose money when trading CFDs with this provider. You should consider whether you understand how CFDs work and whether you can afford to take the high risk of losing your money.
Stratos Europe Ltd (tradu.com ):
CFDs are complex instruments and come with a high risk of losing money rapidly due to leverage. 66% of retail investor accounts lose money when trading CFDs with this provider. You should consider whether you understand how CFDs work and whether you can afford to take the high risk of losing your money.
Stratos Global LLC (tradu.com ):
Losses can exceed deposits.
Please be advised that the information presented on TradingView is provided to Tradu (‘Company’, ‘we’) by a third-party provider (‘TFA Global Pte Ltd’). Please be reminded that you are solely responsible for the trading decisions on your account. There is a very high degree of risk involved in trading. Any information and/or content is intended entirely for research, educational and informational purposes only and does not constitute investment or consultation advice or investment strategy. The information is not tailored to the investment needs of any specific person and therefore does not involve a consideration of any of the investment objectives, financial situation or needs of any viewer that may receive it. Kindly also note that past performance is not a reliable indicator of future results. Actual results may differ materially from those anticipated in forward-looking or past performance statements. We assume no liability as to the accuracy or completeness of any of the information and/or content provided herein and the Company cannot be held responsible for any omission, mistake nor for any loss or damage including without limitation to any loss of profit which may arise from reliance on any information supplied by TFA Global Pte Ltd.
The speaker(s) is neither an employee, agent nor representative of Tradu and is therefore acting independently. The opinions given are their own, constitute general market commentary, and do not constitute the opinion or advice of Tradu or any form of personal or investment advice. Tradu neither endorses nor guarantees offerings of third-party speakers, nor is Tradu responsible for the content, veracity or opinions of third-party speakers, presenters or participants.

USOIL Bearish Reversal & Selling OpportunityUSOIL (WTI Crude Oil) – Bearish Setup Analysis
The chart shows a clear bearish structure with multiple confirmations:
Trendline Rejection & Break: Price rejected from the upper rejection line and later broke the rising trendline, confirming bearish momentum.
FVG (Fair Value Gap) Selling Zone: Price retested the imbalance zone (63.53–63.94), creating a strong selling opportunity.
EMA Confluence: Both the 70 EMA and 200 EMA are above the price, acting as dynamic resistance, supporting bearish bias.
Market Structure Shift (MSS): Breakdown of higher lows signals shift to bearish structure.
Target: Downside continuation expected towards 61.65, the next liquidity and support zone.
Stop Loss: Above 63.94 (selling zone invalidation).
📉 Strategy: Look for sell entries around 63.53–63.94 zone, with target at 61.65 and stop loss above 63.94.

USOIL H2 BEARISH CHANNEL BREAKOUT Usoil H2 Bearsih Channel Breakout
Price From Break The Channel : 63.0
We Are Looking For A Bullish Moment At Entry 63.0 / 60.0
Targeting Area Buy Side Liquidity Area 70.0
Manage Your Trade Properly And Follow Us For More Trades

USoil ideaWe are waiting for our asset to reach our action zone, and based on the reaction, we’ll decide on our next moves.ALWAYS WAIT FOR A CONFIRMATION TO SEE IF THE PRICE VALIDATES THE ZONE.and you what is your vision of the EURUSD its interests me! i wait you in the commentar
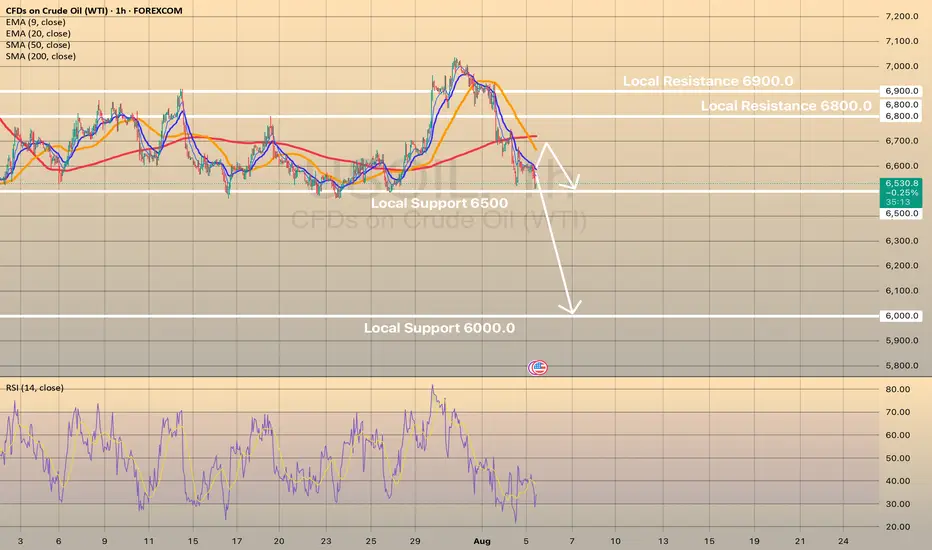
USOIL rebounds from 6,300.0. Where next?USOIL rebounds from 6,300.0. Where next?
USOIL bounced back from the 6,300.0 mark on Tuesday, building on slight gains from the prior session, after President Donald Trump prolonged a tariff truce with China for an additional 90 days. The decision, made just before new tariffs were due, provided temporary relief from rising trade tensions that might hinder global growth and energy demand. The modest rise towards SMA50 and 6,500.0 level is expected. Market participants will also be waiting for OPEC’s monthly report, along with US EIA and IEA forecasts, for fresh supply–demand signals.

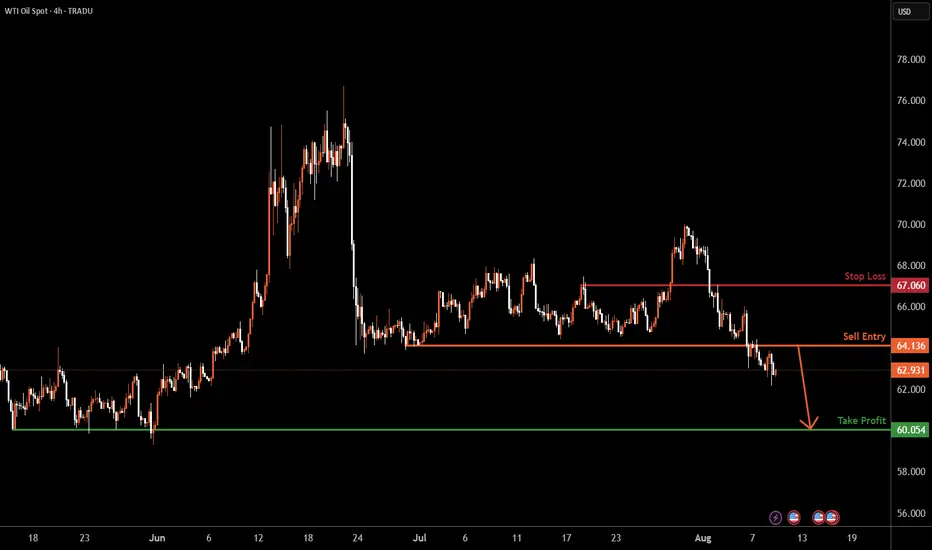
USOIL H4 | Potential bearish dropUSOIL has reacted off the sell entry which is a pullback resistance and could drop from this level to the take profit.
Sell entry is at 64.13, which is a pullback resistance.
Stop loss is at 67.06, which is a pullback resistance.
Take profit is at 60.05, which is a multi swing low support.
High Risk Investment Warning
Trading Forex/CFDs on margin carries a high level of risk and may not be suitable for all investors. Leverage can work against you.
Stratos Markets Limited (tradu.com ):
CFDs are complex instruments and come with a high risk of losing money rapidly due to leverage. 65% of retail investor accounts lose money when trading CFDs with this provider. You should consider whether you understand how CFDs work and whether you can afford to take the high risk of losing your money.
Stratos Europe Ltd (tradu.com ):
CFDs are complex instruments and come with a high risk of losing money rapidly due to leverage. 66% of retail investor accounts lose money when trading CFDs with this provider. You should consider whether you understand how CFDs work and whether you can afford to take the high risk of losing your money.
Stratos Global LLC (tradu.com ):
Losses can exceed deposits.
Please be advised that the information presented on TradingView is provided to Tradu (‘Company’, ‘we’) by a third-party provider (‘TFA Global Pte Ltd’). Please be reminded that you are solely responsible for the trading decisions on your account. There is a very high degree of risk involved in trading. Any information and/or content is intended entirely for research, educational and informational purposes only and does not constitute investment or consultation advice or investment strategy. The information is not tailored to the investment needs of any specific person and therefore does not involve a consideration of any of the investment objectives, financial situation or needs of any viewer that may receive it. Kindly also note that past performance is not a reliable indicator of future results. Actual results may differ materially from those anticipated in forward-looking or past performance statements. We assume no liability as to the accuracy or completeness of any of the information and/or content provided herein and the Company cannot be held responsible for any omission, mistake nor for any loss or damage including without limitation to any loss of profit which may arise from reliance on any information supplied by TFA Global Pte Ltd.
The speaker(s) is neither an employee, agent nor representative of Tradu and is therefore acting independently. The opinions given are their own, constitute general market commentary, and do not constitute the opinion or advice of Tradu or any form of personal or investment advice. Tradu neither endorses nor guarantees offerings of third-party speakers, nor is Tradu responsible for the content, veracity or opinions of third-party speakers, presenters or participants.
Oil continues to decline due to geopolitics optimismOil continues to decline due to geopolitics optimism
A Kremlin official announced that Presidents Trump and Putin will hold a summit soon, their first since 2021, with a White House source suggesting it could occur as early as next week. Optimism surrounding potential U.S.-Russia discussions on the Ukraine conflict has alleviated concerns about oil supply disruptions, despite U.S. sanctions targeting India for its continued Russian crude imports. Trump introduced a 25% tariff on Indian goods and signaled possible additional tariffs on China. However, increased OPEC production and ongoing trade tensions remain key concerns, raising fears of slower economic growth and reduced demand.
Technically, USOIL trades just above the 6,300.00 support level. Insignificant rebound from this level is expected with possible decline towards crucial 6,000.00 support level.

USOIL declines on possibility of geopolitical stabilityUSOIL declines on possibility of geopolitical stability
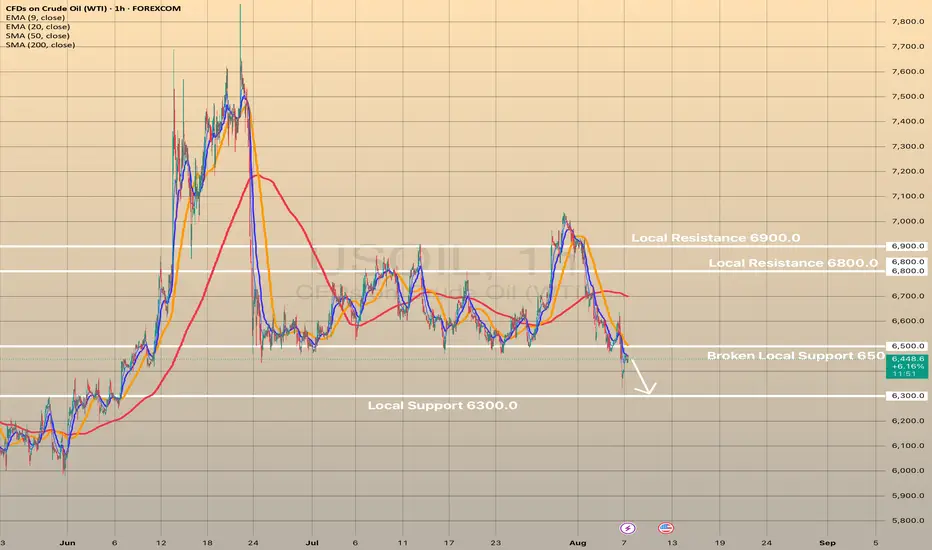
Crude oil and gasoline prices fell August 6 after an early rally, as Trump announced "great progress" in U.S.-Russia talks to end the Ukraine war, reducing fears of new sanctions on Russian energy exports. Additionally, OPEC+’s planned 547,000 bpd production increase for September further pressured prices amid concerns of a global oil supply glut.
Technically, USOIL broke crucial local support at 6,500.00. Currently, the price is retesting this level. The decline towards 6,300.00 is expected in short-term.
USOIL Bulls Seize a New OpportunityThe EIA crude oil inventory data is scheduled for release today and is expected to have a significant impact on USOIL prices. Based on the previously released API report, there’s a high probability that the EIA data will also be bullish.
From a technical perspective, USOIL is currently showing signs of a potential rebound. Therefore, for traders participating in USOIL today, it may be more favorable to adopt a bullish bias. If managed well around key support levels and timing, the setup could offer attractive profit opportunities.

USOIL drops on rising supply and demand concernsUSOIL drops on rising supply and demand concerns
Oil prices fell Tuesday as OPEC+ planned a 547,000 bpd output increase for September, overshadowing potential Russian oil supply constraints from U.S. policies. Brent and WTI crude dropped to their lowest in a week, marking a fourth consecutive decline. OPEC+’s reversal of 2.5 million bpd cuts, combined with weak demand outlooks due to U.S. recession risks and China’s lack of new stimulus, pressured prices. Trump’s threatened 100% tariffs on Russian crude buyers like India, which imports 1.75 million bpd, heightened trade tensions but failed to lift oil prices. Analysts warn U.S. tariffs could further weaken global growth and fuel demand.
USOIL shows some in-moment strength on RSI on 1-h chart, the price may rebound towards sma200 at 6,700.00. However, in long-term perspective, low oil price is expected. Eventually, the price may decline towards level of 6,000.00.
Today's crude oil strategy sharingToday's Crude Oil Charlie Recommendation: 📥📥📥.
Short at $68.05, stop loss at $68.50, take profit at $66.10. (For aggressive shorting, try $67.85; for a more conservative approach, go short at $68.60).🔥🔥🔥
If the market falls to $66.50 before the New York market opens, go long at $67.70. Set the stop loss at $66.❤️🔥❤️🔥❤️🔥
⚠️⚠️⚠️The market is risky; participate rationally. FX:USOIL MARKETSCOM:USOIL FX:USOILSPOT FX:USOILSPOT MARKETSCOM:USOIL
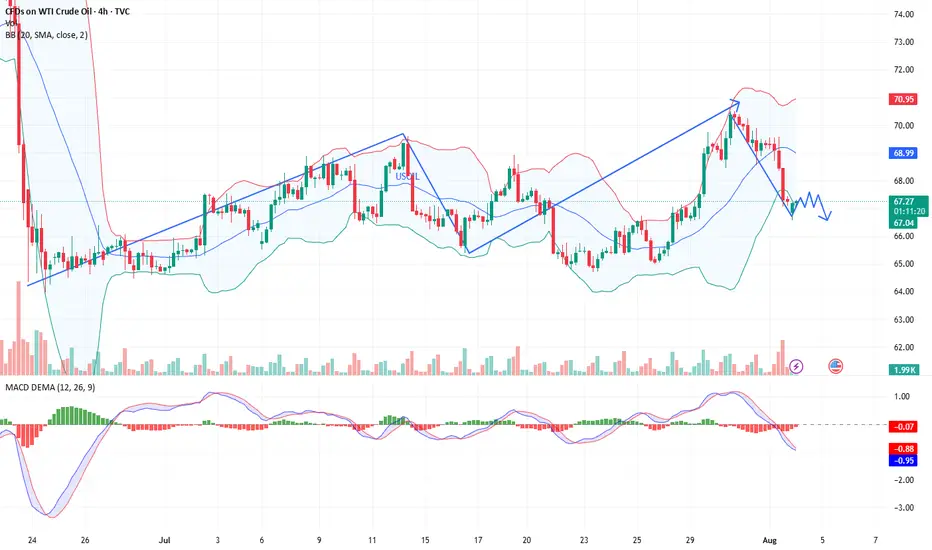
USOIL declines for the 3 days in a row. What's next?USOIL declines for the 3 days in a row. What's next?
Since the last post the USOIL has already declined on 2.5%, currently rebounding from SMA50 on 4-h chart. 2 main reasons are behind this.
On August 3, the Organization of the Petroleum Exporting Countries and their partners, collectively known as OPEC+, decided to increase oil production by 547,000 barrels per day in September, the latest in a series of swift production boosts aimed at regaining market share. They cited a robust economic outlook and low inventories as the reasons for their decision. However, Friday NFP report may signal of a potential recession risk in the United States, the biggest oil consumer in the world. Here is what the Goldman Sachs writes down in x.com: "The decline in employment growth over the previous two months in the July report was one of the largest since 1960 and was accompanied by several months of similar revisions earlier. Corrections of this magnitude are extremely rare outside of the recession period."
So, fundamentals don't favor oil and despite the current rebound from SMA50, there are low chances of developing some bullish momentum here. The pullback from 6,800.00 is expected with the following decline towards 6,500.00
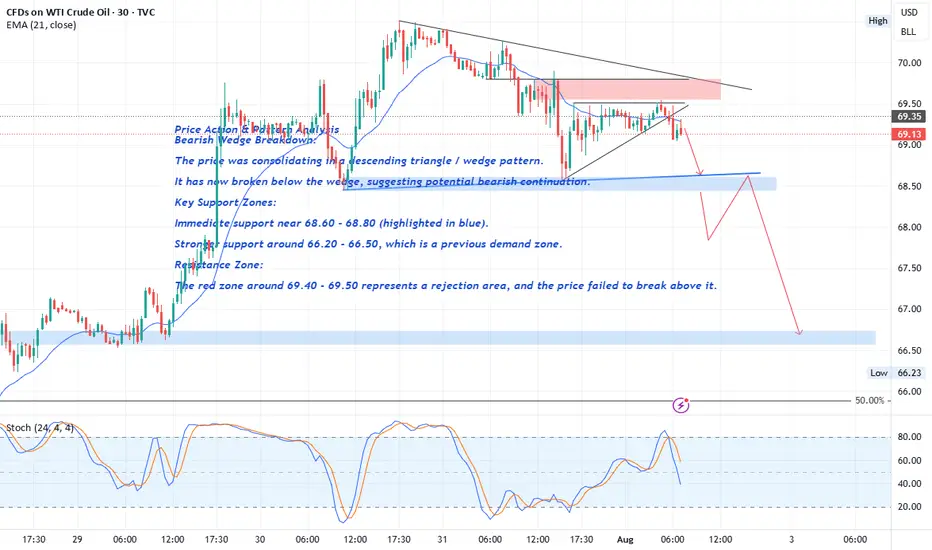
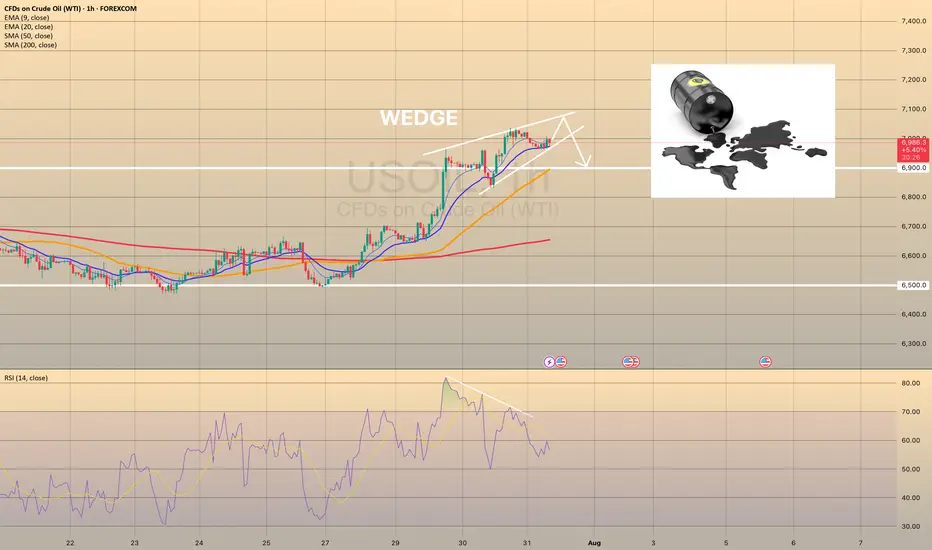
Crude Oil Price Action & Pattern Analysis
Bearish Wedge Breakdown:
The price was consolidating in a descending triangle / wedge pattern.
It has now broken below the wedge, suggesting potential bearish continuation.
Key Support Zones:
Immediate support near 68.60 - 68.80 (highlighted in blue).
FOREXCOM:USOIL
The break of the 68.60 level with a strong bearish candle would serve as confirmation of a Head and Shoulders (H&S) pattern , with solid bearish implications.
Stronger support around 66.20 - 66.50 , which is a previous demand zone.
Resistance Zone:
The red zone around 69.40 - 69.50 represents a rejection area , and the price failed to break above it.
One Last Dip Before the Pop?On the daily timeframe, we anticipate two possible scenarios for USOIL’s movement. In the red-labeled scenario, USOIL is expected to undergo a correction to test the 63.71–64.03 area. However, in the best-case scenario, if USOIL manages to hold above 64.03, it has the potential to strengthen toward the 68.27–72.53 range.

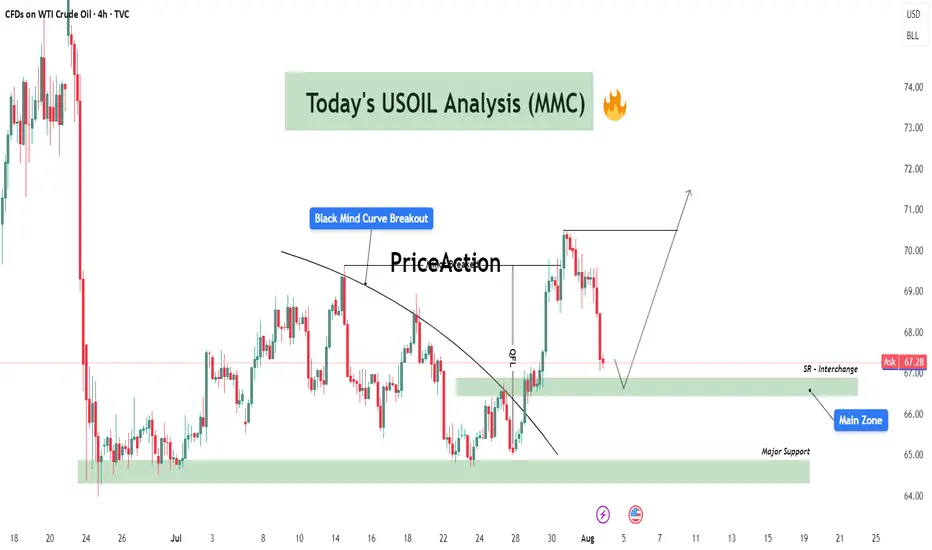
USOIL Technical Analysis – Black Mind Curve Breakout & Reversal🔍 Overall Market Context:
The current USOIL structure is a great example of market shift from compression to expansion, characterized by a breakout of the Black Mind Curve followed by a measured impulse move. This chart is not just reacting technically, but it reflects how institutional smart money manipulates curves, breaks minor structures, and then retests zones to refill orders before continuing directionally.
Let’s break the market psychology and price action phase by phase:
🔄 Phase 1: Black Mind Curve Breakout ✅
The Black Mind Curve represents long-standing supply pressure that had been capping price.
Its breakout marks a shift in market intention, often signaling the end of a distribution phase and beginning of a possible accumulation or re-accumulation.
Price broke above this curve cleanly with strong bullish candles, which also broke minor structure levels, confirming short-term bullish sentiment.
The breakout was also backed by momentum and volume as the market pushed 130+ pips upward—an aggressive impulse that trapped late sellers below.
📉 Phase 2: Retracement to Interchange Zones
Now, we’re in the retracement phase, where price is pulling back toward:
🔹 SR Interchange Zone ($66.80 - $67.30)
This zone was previous resistance, now flipping to support.
In MMC terms, this area is expected to serve as a refill zone where smart money will look to accumulate again after the breakout.
We are watching for confirmation candles or MMC-style reversal patterns here (e.g., inside bar breakouts, demand imbalances).
🔹 Main Zone ($65.80 - $66.50)
If the first zone fails, this is the next key demand base.
It holds historical value from previous accumulation phases (see July 10–25) and aligns with the origin of the last impulse.
Expect a sharper wick or deeper liquidity grab if price moves into this area.
📉 Phase 3: Final Defensive Zone – Major Support ($63.70 - $65.20)
This zone marks the last line of bullish defense.
A move here would mean the bullish structure is being reevaluated or absorbed by sellers.
However, if price hits this level, it could also attract significant institutional demand, setting up for a more powerful long-term leg up.
Reactions here are typically large and volatile, with a risk of fakeouts and fast reversals.
📈 Possible Scenarios (MMC Based Forecasting):
✅ Scenario 1 – Bullish Continuation (Primary Path)
Price finds support inside SR Interchange Zone.
Forms a base (MMC reversal structure) and pushes back to recent highs near $71.
Breakout above $71 opens room for next supply zones between $72.50 - $74.00.
⚠️ Scenario 2 – Deeper Liquidity Grab
Price breaks below SR Interchange and tests Main Zone for a deeper accumulation.
A wick or shakeout may happen before bullish continuation.
This trap zone could give the best R:R entry.
❌ Scenario 3 – Breakdown to Major Support
If both zones fail and bearish pressure sustains, price may revisit Major Support.
That would reset the bullish structure and require fresh MMC assessment.
🧠 MMC Logic at Work:
The curve break symbolizes the shift from supply dominance to a possible demand-led phase.
Minor structure breaks add fuel to trend shift and indicate participation from larger players.
Retracements are not weaknesses—they are refills for those who missed the move.
Smart money uses these zones and flips (SR interchanges) to hide in plain sight.
🎯 Key Takeaway for Traders:
This is a textbook MMC setup that combines:
Curve Breakout + Impulse
Zone Retest + Interchange Logic
Liquidity Engineering before Continuation
Traders should remain patient and observe reactions at each zone. Don’t chase—wait for the market to reveal its hand via MMC entry signals (break-of-structure, bullish engulfings, imbalance fills, etc.)
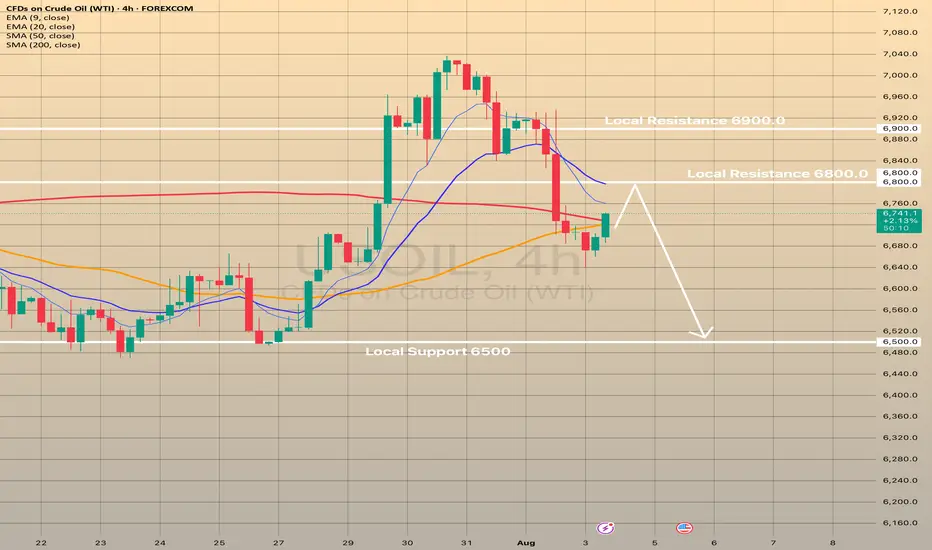
USOIL REACHED THE 6,900.00 SUPPORT LEVEL. WHAT'S NEXT?USOIL REACHED THE 6,900.00 SUPPORT LEVEL. WHAT'S NEXT?
As we told July 31, the price got reversed towards first support level of 6,900.00. Market participants are waiting for the OPEC+ meeting this week, expecting a significant output hike. Currently, the price sits slightly above the support level. Although, the asset trades above this level, considering the current weakness of the asset, further decline is expected. The 6,800.00 support level is the next target here.

Is the surge in crude oil bulls here a comeback?The news-driven support for crude oil's recent rally is almost exhausted, so we'll continue to adopt a buy-low-sell-high strategy today, using a small stop-loss to maximize profits.
Short at $71.20, with a stop-loss at $71.70 and a take-profit at $69.20. (For aggressive shorting, try shorting at $70.95).
The above strategy is Charlie's personal opinion and is for reference only. If you follow suit, please be cautious and use a stop-loss to protect your position. TVC:USOIL FOREXCOM:USOIL TRADU:USOIL TRADU:USOIL
USOIL IS GOING BULLISH. FOR HOW LONG?USOIL IS GOING BULLISH. FOR HOW LONG?
Brent has started this week with a strong bullish momentum and holds near 6-week high on supply fears. President Trump announced plans to impose tariffs on Indian exports and penalize its Russian oil imports. In a parallel move, the US introduced its most extensive sanctions on Iran in seven years. The United States has even offered its oil to the world in exchange for Iranian and Russian oil, but there is evidence that the US production capacity is now at historic highs and is unlikely to grow in the near future.
However, technically oil shows us bearish divergence on RSI and bearish wedge here. The price may reverse towards 6,900.00 as a first target. EIA data showed US crude inventories jumped by 7.7 million barrels last week—the largest increase in six months and defying forecasts for a decline. Market participants are waiting for the OPEC+ meeting this week, expecting a significant output hike.
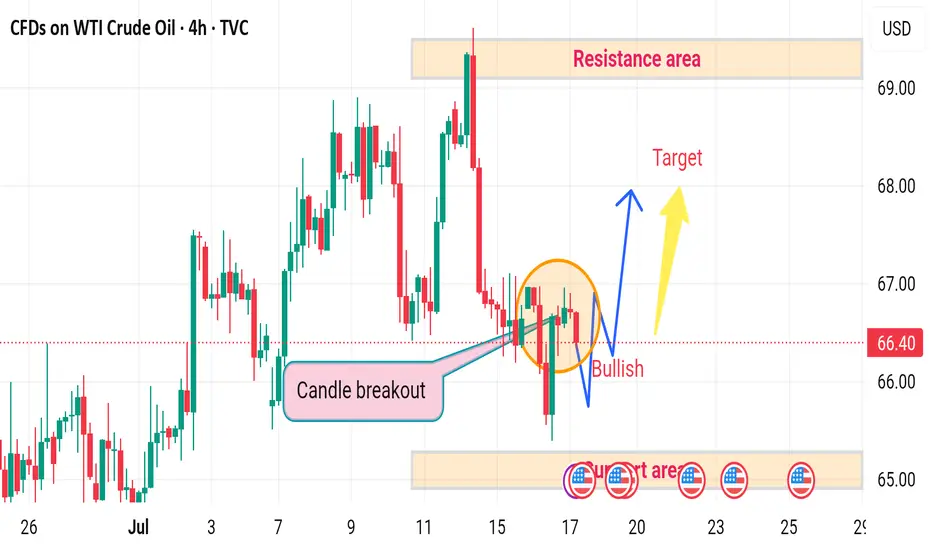
USOIL H4 bullish upward ⚠️ Disrupted Analysis – WTI Crude Oil (4H Chart)
🔻 Bearish Pressure Re-Entering
Despite a temporary candle breakout, the price failed to sustain above the breakout trendline.
The recent price action inside the orange circle shows lower highs and rejection wicks, indicating bullish weakness.
📉 Potential Breakdown Risk
If the price fails to hold above 66.00, there's a high probability of it breaking below the support area around 64.80–65.00, leading to:
Increased bearish momentum
Retesting lower demand zones, possibly around 63.50–64.00
❌ Resistance Area Still Valid
The Resistance area at 68.00–69.00 remains unchallenged.
The "Target" shown is optimistic under current momentum.
Without strong volume and bullish candles, that target remains unlikely in the near term.
🔁 Disruption Summary
The bullish breakout is likely a false breakout.
Market may be forming a bull trap.
Watch for a clean break below 65.00 for confirmation of a bearish reversal.
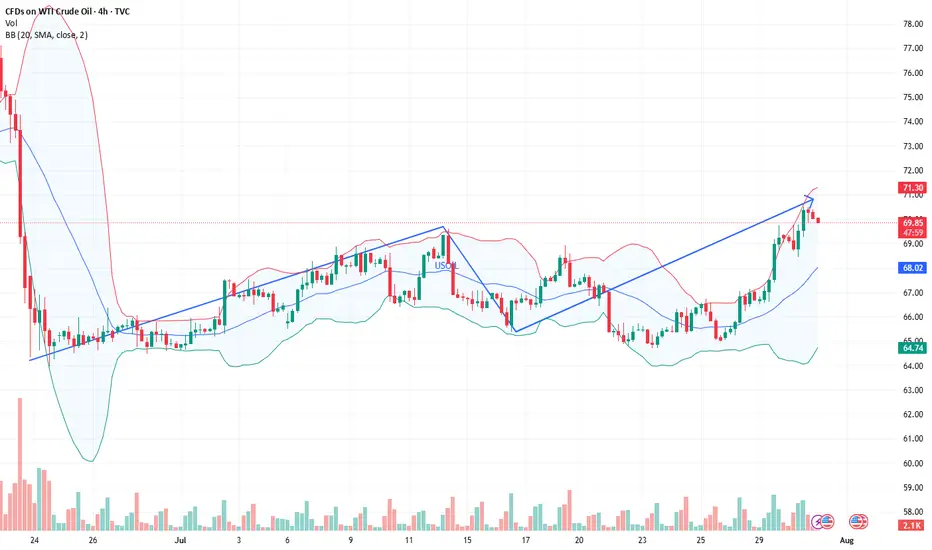
Crude Oil -DAILY- 21.07.2025Oil prices were steady after their first weekly decline this month, as attention shifted to U.S. trade negotiations and the European Union’s push to tighten restrictions on Russian energy exports. The EU is preparing new sanctions, including a lower price cap on Russian crude, limits on fuel refined from Russian oil, banking restrictions, and bans targeting an Indian refinery and Chinese firms. Despite western sanctions, Russian oil continues flowing to China and India. Meanwhile, diesel margins in Europe remain strong, signaling tight supply.
On the technical side, the price of crude oil has failed to break below the major technical support area, which consists of the 50-day simple moving average and the 50% of the weekly Fibonacci retracement level. The Stochastic oscillator has been in the neutral level since last week hinting that there is potential for the price to move to either direction in the near short term. On the other hand, the Bollinger bands have contracted rather massively showing that volatility has dried up therefore, the recent sideways movement might extend in the upcoming sessions.
Disclaimer: The opinions in this article are personal to the writer and do not reflect those of Exness
