USOIL Analysis: Oil Testing Critical 63.85 Pivot Zone!Crude Oil (USOIL) Technical Analysis
Date: February 9, 2026
Pivot Point: 63.85
The price is currently hovering around the 63.85 level. This is the decisive zone for the next market move.
📉 Bearish Scenario (Main Outlook):
As long as the price remains below the 63.85 pivot point, the downward trend prevails:
First Target: A decline toward the support level at 62.40.
Second Target: Breaking below this level will drive the price further down to 61.40.
Bullish Scenario (Alternative Outlook):
If the price manages to break above the 63.85 pivot and stabilizes, the trend will flip to bullish:
First Resistance: The target will be 64.65.
Further Gains: A breakout above this resistance will push the price toward 65.20 and potentially reach 65.95.
Key Summary:
Below 63.85: Bearish momentum dominates.
Above 63.85: Bullish reversal confirmed.
Support & Resistance Levels:
Resistance: 64.65 | 65.20 | 65.95
Support: 62.40 | 61.40
Usoilforecast

Crude OilU.S Oil
- Bullish Channel as an corrective pattern in Long Time Frame
- Change of Characteristics
- RSI - Divergence
- Completed " 12345 " Impulsive Waves
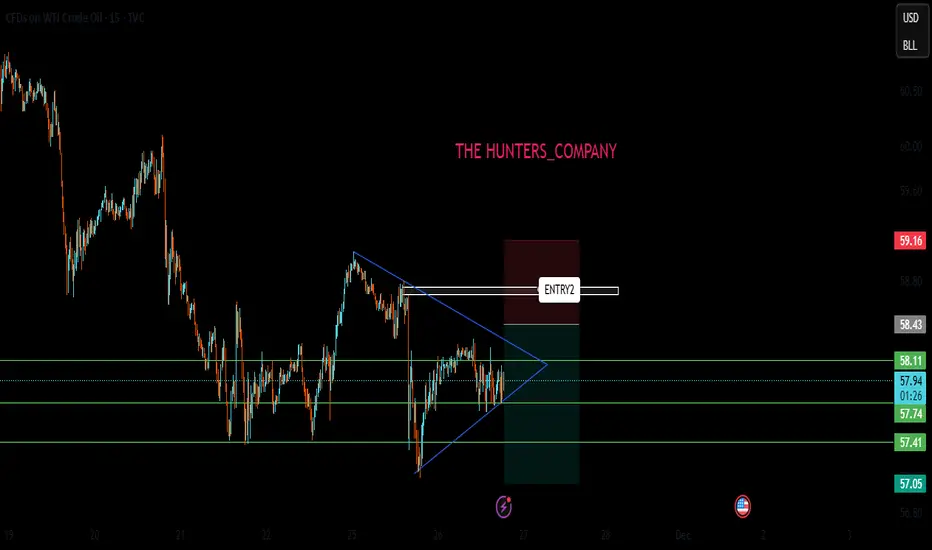
- Symmetrical Triangle in Short Time Frame

US Oil: Buy The Pullback!In this Weekly Market Forecast, we will analyze the US OIL for the week of Feb. 9-13th.
US Crude Oil had a very strong January. December we see the market in a pullback, correcting the Jan impulsive move.
This market is still ranging, and valid shorts or longs are difficult to recognize.
Wait for PD Arrays to be respected or disrespected. Highs/lows, FVGs and OBs.
Price is being supported by an +OB now. The move up and away from it is worth buying. If the +OB fails, and price trades through the lows of the consolidation, then sells are valid.
Enjoy!
May profits be upon you.
Leave any questions or comments in the comment section.
I appreciate any feedback from my viewers!
Like and/or subscribe if you want more accurate analysis.
Thank you so much!
Disclaimer:
I do not provide personal investment advice and I am not a qualified licensed investment advisor.
All information found here, including any ideas, opinions, views, predictions, forecasts, commentaries, suggestions, expressed or implied herein, are for informational, entertainment or educational purposes only and should not be construed as personal investment advice. While the information provided is believed to be accurate, it may include errors or inaccuracies.
I will not and cannot be held liable for any actions you take as a result of anything you read here.
Conduct your own due diligence, or consult a licensed financial advisor or broker before making any and all investment decisions. Any investments, trades, speculations, or decisions made on the basis of any information found on this channel, expressed or implied herein, are committed at your own risk, financial or otherwise.

Swing Long Trade Idea on USOILSwing Long Trade Idea on USOIL
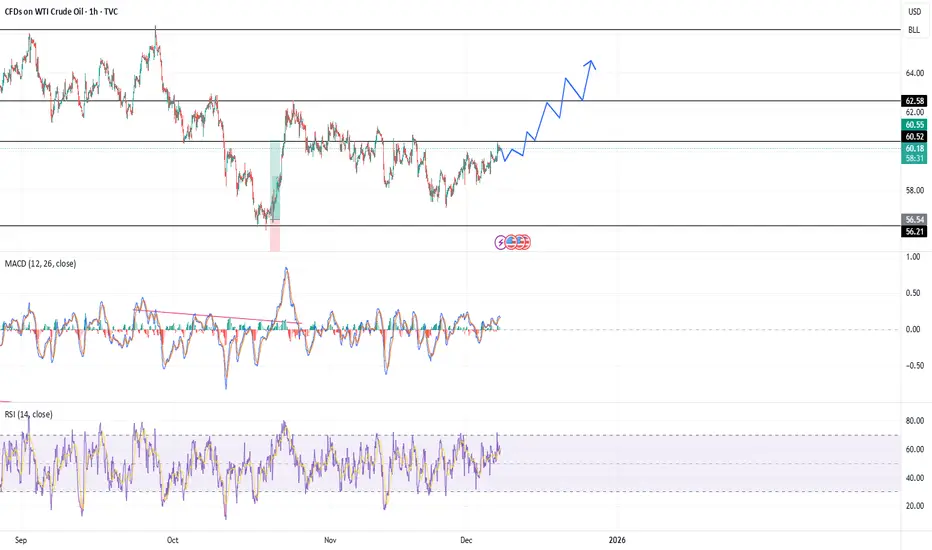
In 2025, metals, commodities, equities, and Bitcoin all reached new all time highs, while USOIL has lagged behind. I believe we could see a catch up move in USOIL during Q1 2026, as price is currently holding at a strong support level. I am considering a swing long position if USOIL breaks out of the descending triangle. The RR on this setup looks very attractive. My plan is to take partial profits at the 0.618 Fibonacci level, set the second target at the top of the channel, and trail the stop loss after the first target is reached.
Share you thoughts

US OIL: Bullish Break Out Potential?In this Weekly Market Forecast, we will analyze the US OIL for the week of Jan. 19-24th.
US Crude Oil has been sideways for over 3 years. Accumulating. April '25 there was a significant
sweep of sell side liquidity, followed by an impulsive move to the high of the consolidation. Manipulation. A correction to the previous move followed to the .705 fib (Optimal Trade Entry).
If we get a significant move higher from current levels, this could be the start of the 3rd phase of price action.... distribution.
AMD ..... is what I am looking for.
Enjoy!
May profits be upon you.
Leave any questions or comments in the comment section.
I appreciate any feedback from my viewers!
Like and/or subscribe if you want more accurate analysis.
Thank you so much!
Disclaimer:
I do not provide personal investment advice and I am not a qualified licensed investment advisor.
All information found here, including any ideas, opinions, views, predictions, forecasts, commentaries, suggestions, expressed or implied herein, are for informational, entertainment or educational purposes only and should not be construed as personal investment advice. While the information provided is believed to be accurate, it may include errors or inaccuracies.
I will not and cannot be held liable for any actions you take as a result of anything you read here.
Conduct your own due diligence, or consult a licensed financial advisor or broker before making any and all investment decisions. Any investments, trades, speculations, or decisions made on the basis of any information found on this channel, expressed or implied herein, are committed at your own risk, financial or otherwise.

WTI (USOIL) Price Outlook – Trade Setup📊 Technical Structure
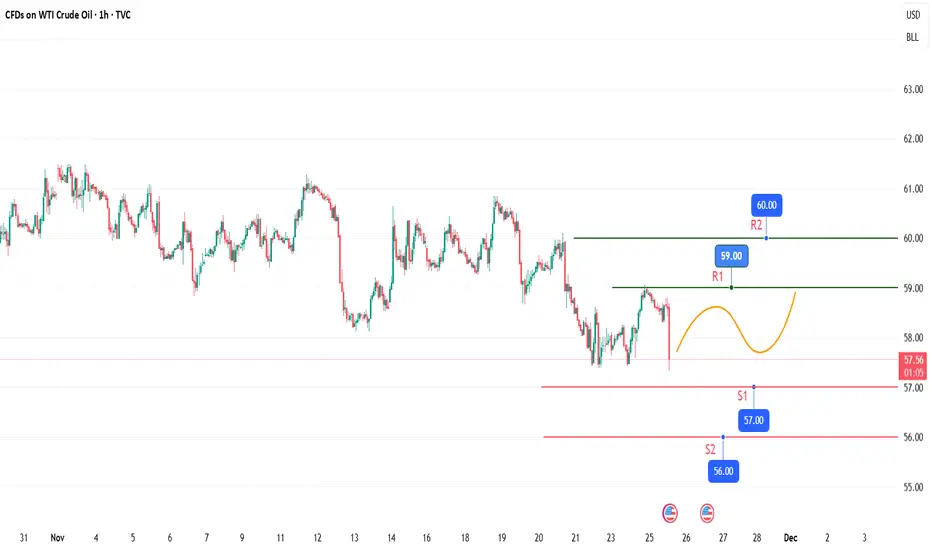
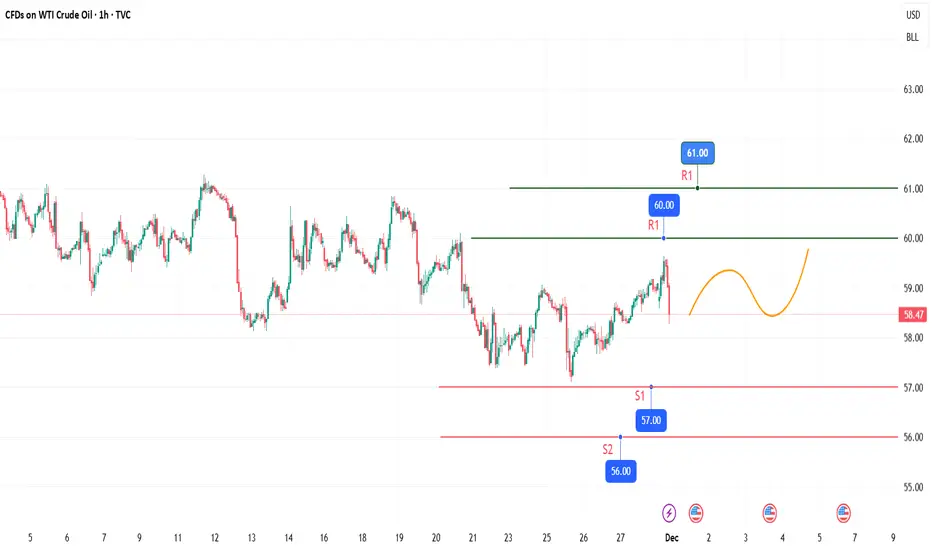
TVC:USOIL WTI is currently trading within a rising channel, after rebounding from the recent swing lows. Price has found support around the $60.15–$60.33 support zone, where buying interest has emerged and downside momentum has slowed.
The market structure suggests a potential bullish continuation. As long as WTI holds above the support zone, price action favours a rebound toward the $61.04–$61.21 resistance zone. The projected path indicates a brief consolidation near current levels, followed by an upside push into the resistance band, rather than an immediate breakdown.
🎯 Trade Setup (Bullish Bias)
Entry Zone: 60.15 – 60.33
Stop Loss: 59.99
Take Profit 1: 61.04
Take Profit 2: 61.20
Risk–Reward Ratio: Approx. 1 : 2.26
📌 Invalidation
A sustained break and close below $59.99 would invalidate the bullish setup and signal a deeper downside correction.
🌐 Macro Background
The broader macro backdrop remains mixed but supportive for WTI in the near term. Easing geopolitical tensions after President Trump stepped back from tariff threats against European nations have helped stabilize risk sentiment, providing short-term support for crude prices.
At the same time, signals of temporary supply disruptions in Kazakhstan have added upside pressure, as production at major oilfields was halted following power outages. However, the upside remains capped by persistent oversupply concerns, with the International Energy Agency (IEA) reiterating that global oil supply is expected to significantly exceed demand this year.
In the short term, markets are digesting these opposing forces, with price action favouring range-based recovery moves when crude stabilizes at well-defined technical support.
🔑 Key Technical Levels
Resistance Zone: 61.04 – 61.21
Support Zone: 60.15 – 60.33
Bullish Invalidation: Below 59.99
📌 Trade Summary
WTI is holding above a critical support zone within a rising channel after a corrective pullback. As long as price remains supported above $60.15, the bias favours a buy-on-dips approach, targeting a continuation move toward the upper resistance band.
⚠️ Disclaimer
This analysis is for reference only and does not constitute investment or trading advice. Financial markets involve risk, and traders should manage positions according to their own risk tolerance.

US OIL: Bullish Break Out Potential?US Crude Oil has been sideways for over 3 years. Accumulating. April '25 there was a significant sweep of sell side liquidity, followed by an impulsive move to the high of the consolidation. Manipulation. A correction to the previous move followed to the .705 fib (Optimal Trade Entry).
If we get a significant move higher from current levels, this could be the start of the 3rd phase of price action.... distribution.
AMD ..... is what I am looking for.
Enjoy!
May profits be upon you.
Leave any questions or comments in the comment section.
I appreciate any feedback from my viewers!
Like and/or subscribe if you want more accurate analysis.
Thank you so much!
Disclaimer:
I do not provide personal investment advice and I am not a qualified licensed investment advisor.
All information found here, including any ideas, opinions, views, predictions, forecasts, commentaries, suggestions, expressed or implied herein, are for informational, entertainment or educational purposes only and should not be construed as personal investment advice. While the information provided is believed to be accurate, it may include errors or inaccuracies.
I will not and cannot be held liable for any actions you take as a result of anything you read here.
Conduct your own due diligence, or consult a licensed financial advisor or broker before making any and all investment decisions. Any investments, trades, speculations, or decisions made on the basis of any information found on this channel, expressed or implied herein, are committed at your own risk, financial or otherwise.

WTI may have started a big move!WTI with it's monthly double bottom was a technical call for a possible rejection. However, as the most new sensive instrument, WTI may started an aggressive uptrend with potentail for new higher ( it wiill not be unusual to see an all time high, if geo political tension rises extensively)
lowertimefram market structure is bullish with cross over of 10ema and 20ema showing market may continue to trade above 20ema.
A possible buy setup on break of structure on the lowertimeframe is high probability set up.

USOIL (WTI) – Key Supply Zone Reaction | Breakout or Rejection?USOIL (WTI) – Key Supply Zone Reaction | Breakout or Rejection?
📍 Timeframe: Daily
📍 Instrument: USOIL (WTI Crude Oil)
USOIL price is currently testing a well-defined supply zone, a level that has acted as a strong resistance multiple times in the past. This zone has historically triggered sharp bearish reactions, making the current price behavior extremely important.
🔍 Market Structure Observation
🔴 The marked Supply Zone has rejected price repeatedly
🔺 Strong bullish impulses are visible from lower levels (green arrows)
⚠️ Current price is retesting supply with momentum, creating a decision zone
This makes the area a high-impact zone where the next directional move will be decided.
📈 Trade Scenarios
✅ Scenario 1: Bullish Breakout
A strong daily close above the supply zone
Follow-through volume and structure confirmation
📈 Opens the path towards 64.00+ levels
➡️ Bias shifts to buy-on-retest after breakout
❌ Scenario 2: Breakout Failure (Rejection)
Price fails to sustain above supply
Bearish rejection or strong upper wicks
📉 Possible move back towards 57.00 – 56.00 support zone
➡️ Ideal for sell-on-confirmation traders
🧠 Professional Insight
Markets do not move at random — strong zones control price behavior.
The best trades emerge when we wait for confirmation at key levels, not anticipation.
This is a reaction zone, not a prediction zone.
⚠️ Trade Management Note
Avoid impulsive entries inside resistance
Let the market confirm breakout or rejection
Risk management remains the priority
📌 Disclaimer:
This analysis is for educational purposes only. Always manage risk and trade according to your own strategy. TVC:USOIL

Crude Oil Technical Blueprint | Bullish Momentum Setup🛢️ USOIL Energy Market Blueprint | Swing/Day Trade Setup 🎯
📊 ASSET OVERVIEW
Crude Oil (USOIL) | WTI Crude Oil Futures
Market: Energies | Commodities Sector
Strategy Type: Capital Flow Analysis + Triangular MA Breakout System
Trading Style: Swing Trading & Day Trading Hybrid Approach
🔥 MARKET BIAS: BULLISH MOMENTUM CONFIRMED ✅
Technical Setup:
✨ Triangular Moving Average (TMA) BREAKOUT + RETEST pattern completed
✨ Price action showing bullish institutional order flow
✨ Momentum indicators aligning with upside continuation
✨ Volume profile supporting buyer dominance
🎯 ENTRY STRATEGY: "THIEF LAYERING METHOD" 💰
Entry Type: Multi-Layer Limit Orders (Smart Money Accumulation Style)
🔹 Layer 1: $57.50
🔹 Layer 2: $58.00
🔹 Layer 3: $58.50
🔹 Layer 4: $59.00
OR
✅ Market Entry: Any current price level (For aggressive traders)
💡 Pro Tip: The "Thief Strategy" uses multiple limit orders at strategic support zones to capture optimal average entry price. You can add more layers based on your risk appetite and position sizing plan!
🚨 TARGET ZONE: "POLICE FORCE LEVEL" 🎖️
Primary Target (TP): $61.50
⚠️ IMPORTANT: This level acts as:
✔️ Strong historical resistance zone
✔️ Overbought territory trap area
✔️ Institutional profit-taking zone
🛡️ Exit Strategy: Take partial profits at target. Don't be greedy—when money is on the table, secure your gains! This is YOUR trade, YOUR rules, YOUR profits. Adjust TP based on your personal trading plan and risk management.
🛑 STOP LOSS: "THIEF PROTECTION LEVEL" 🔒
SL Placement: $57.00
⚠️ Risk Disclaimer: This SL is suggested based on technical structure invalidation point. However, YOU are the boss of your own trading account. Set your stop loss according to YOUR risk tolerance, account size, and trading psychology. Never risk more than you can afford to lose!
🌍 RELATED PAIRS TO WATCH 📈
Correlated Assets (Positive Correlation):
AMEX:XLE (Energy Select Sector SPDR Fund) 🔗 +0.85 correlation
NYSE:XOM (Exxon Mobil) 🔗 +0.78 correlation
NYSE:CVX (Chevron Corporation) 🔗 +0.76 correlation
TVC:UKOIL (Brent Crude Oil) 🔗 +0.92 correlation
Inverse Correlation:
TVC:DXY (US Dollar Index) 🔗 -0.65 correlation (Strong dollar = Pressure on oil)
NASDAQ:TLT (US Treasury Bonds) 🔗 -0.45 correlation
Currency Pairs (Oil-Sensitive):
USDCAD 🇺🇸🇨🇦 (Canadian Dollar strengthens with oil)
USDNOK 🇺🇸🇳🇴 (Norwegian Krone tied to oil exports)
USDRUB 🇺🇸🇷🇺 (Russian Ruble oil-dependent)
💡 Trading Insight: When USOIL rallies, energy stocks typically follow. Watch DXY weakness for confirmation—falling dollar = bullish catalyst for oil!
📰 FUNDAMENTAL & ECONOMIC FACTORS 🌐
Current Market Drivers (Real-Time Feed):
🔴 OPEC+ Production Decisions:
Saudi Arabia & Russia production cut extensions impacting supply
Tighter supply = Bullish pressure on prices
🔴 US Crude Oil Inventories (EIA Reports):
Weekly inventory data showing drawdowns = Bullish signal
Watch Wednesday 10:30 AM EST releases
🔴 Geopolitical Tensions:
Middle East tensions (Iran, Israel, regional conflicts)
Ukraine-Russia energy disruptions
Red Sea shipping route disruptions = Supply chain fears
🔴 Global Demand Outlook:
China economic recovery (world's largest oil importer)
US economic data (PMI, manufacturing, employment)
Winter heating demand seasonality
🔴 US Dollar Strength (DXY):
Fed interest rate policy (dovish = bullish oil)
Dollar weakness = Oil priced in USD becomes cheaper for foreign buyers
Upcoming Events to Watch: 📅
✅ OPEC+ Meeting - Monitor production quota announcements
✅ US EIA Crude Inventory Reports - Every Wednesday
✅ Fed Interest Rate Decisions - Impact on USD and commodity prices
✅ China Economic Data - PMI, GDP, industrial output
✅ Geopolitical Developments - Middle East news, sanctions updates
⚡ KEY TECHNICAL LEVELS 📊
Support Zones: 🟢
$57.00 (Critical SL level)
$56.20 (Secondary support)
$55.50 (Major demand zone)
Resistance Zones: 🔴
$61.50 (Target / Police Force level)
$63.00 (Psychological barrier)
$65.00 (Major supply zone)
💎 FINAL WORDS: THIEF OG'S PHILOSOPHY 🎩
Dear Ladies & Gentlemen, Thief OG Traders 🎯
📌 This is NOT financial advice—this is a technical blueprint based on chart analysis and market structure.
📌 YOU control your destiny. YOU decide entry, exit, and risk.
📌 Take profits when YOU see fit. Don't let greed rob your gains!
📌 Manage risk like a professional. Position sizing > Being right.
📌 The market doesn't care about your feelings. Stick to your plan!
🔥 Trade smart. Trade safe. Make money, then TAKE money. 🔥
📢 Engagement Call-to-Action:
💬 Drop a comment with your thoughts!
👍 Smash that LIKE button if this setup resonates!
🔔 FOLLOW for more market blueprints and Thief OG setups!
🚀 Let's make those pips together, traders!
Happy Trading, Thief OG's! 🎩✨

Crude OilUS Oil
- Falling Wedge as an corrective pattern in Short Time Frame
- Break of Structure
- Change of Characteristics
- Support Level
- Order Block

WTI Crude Oil 4H Setup – Liquidity Zones & FVG ReactionThis 4-hour chart of WTI Crude Oil (FXCM) highlights a potential trade setup based on liquidity structure and Fair Value Gaps (FVG). Key zones include Buy Side Liquidity (BSL), Sell Side Liquidity (SSL), and both 4H and Daily FVGs. An Optimal Trade Entry (OTE) is marked, with entry, stop-loss, and take-profit levels clearly defined. Price action suggests a reaction from the FVG zone, with structure favoring a move toward the next liquidity pool. The setup reflects Smart Money Concepts and precision-based execution.

WTI Oil: Bulls vs Bears – The Next Major Move Is LoadingHello and best wishes to all my TradingView followers 👋🌹
Hope you’re doing great and trading safely 💪📊
Today, we are going to analyze WTI Crude Oil in the short-term perspective, focusing mainly on the 4H and Daily timeframes.
Based on the chart, price is currently moving within a range structure with a bearish bias and is reacting to several key technical levels.
🔻 Market Structure Overview
Price is trading below the descending Dynamic Resistance (trendline)
The highlighted Daily Resistance Zone acts as a strong supply area
Price is currently inside a decision zone, where volatility is expected ⏳
🟥 Bearish Scenario 📉
If price breaks and closes below the marked support zone on the Daily timeframe:
🔻 Bearish continuation becomes valid
📌 A potential pullback to the broken zone may occur before continuation
🎯 Targets can be activated step by step at lower demand levels (as shown by the gray projections on the chart)
This scenario aligns with the lower high & lower low structure and weak bullish momentum
📉 As long as price remains below the dynamic resistance, the bearish scenario remains dominant.
🟩 Bullish Scenario 📈
If price manages to:
✅ Break the descending trendline (Dynamic Resistance)
✅ Close a valid 4H candle above the resistance
Then we may expect:
🔁 A pullback to the broken trendline
🚀 A bullish continuation toward higher resistance levels
🎯 Targets located at previous highs and key supply zones
📌 This scenario requires confirmation. Without a valid breakout, it remains only a possibility.
🧠 Final Thoughts
Price is at a very critical level
📉 Support break = continuation to the downside
📈 Trendline breakout = potential trend reversal
⏳ Best approach here is waiting for confirmation before entering trades
⚠️ Disclaimer:
This analysis is for educational purposes only and does not constitute financial or investment advice. All trading decisions are your own responsibility. Please always follow proper risk and money management ⚠️
If you found this analysis helpful ❤️
🔔 Don’t forget to like, comment, and follow
Wishing you green trades and consistent profits 🌱📈

usoil : live tradeHello friends
Well, according to the channel we had, you can see that the sellers broke the specified support with strength and caused the price to fall.
Now, given that it has become clear to us that the power is in the hands of the sellers, we can re-enter the sell trade if the price rebounds or pullbacks in the specified area, of course with the necessary confirmations...
This analysis is purely technical and does not constitute a buy or sell recommendation, so please observe risk and capital management and avoid emotional movements.
*Trade safely with us*

USOIL will have a reversal The price will be reversed based on MCAD line. the bearish trend is exhausted and price will move up probably.
USOIL:LIVE TRADEHello friends
you can see that we had a decline and the sellers were in power until the support was determined with Fibonacci, where buyers entered and were able to support the price.
Now, with Fibonacci, we have determined a resistance area for buyers that can move up to there, but considering the main trend, which is negative, the price increase is an opportunity for a sell trade.
Don't forget risk and capital management.
*Trade safely with us*

Weekly USOIL Trend SummaryOverall, USOIL oscillated at a low level with a slight upward trend during the period from November 24 to November 28, 2025. Despite minor fluctuations of gains and losses throughout the week, it hovered around $59 per barrel and failed to break free from the consecutive monthly decline trend that began this month. The specific trend is detailed in segments as follows:
1.Modest Gain at Week's Start with Synchronous Weakening Price Spread (November 24)
USOIL kicked off the week with a slight upturn. It closed at $58.89 per barrel that day, rising $0.91 or 1.57% compared with the previous week's closing price of $57.98 per barrel.
2.Oscillating Consolidation in Mid-Week, with Gains Constrained by Oversupply Expectations (November 25 - 26)
On November 25, oil prices traded sideways, hovering around $58.77 per barrel with a slight drop of approximately 0.91%.
On November 26, the market rebounded, and the growth rate of the relevant oil and gas index expanded to 0.87%. Oil prices followed suit with an upward movement. However, they failed to break through the earlier oscillating range overall. Meanwhile, potential incremental pressure on the supply side left the oil price rally lacking strong momentum.
3.Minor Fluctuations at Week's End Awaiting Policy Signals (November 27 - 28)
On November 27, oil prices pulled back slightly, and the corresponding oil and gas index edged down by 0.08%. After encountering resistance near $59 per barrel, oil prices retreated moderately. Market sentiment turned increasingly cautious as investors focused on the OPEC+ production policy meeting scheduled for Sunday.
On November 28, oil prices inched up again, and the oil and gas index rose by 0.67%, hitting a weekly closing high of 309.33 points.
Overall, although USOIL recorded a slight increase this week, it remained trapped in a low - range. Moreover, this month marks its fourth consecutive monthly decline, the longest losing streak since 2023. The main bearish factors weighing on oil prices include the expected lifting of sanctions on Russian oil driven by progress in the Ukraine peace talks and weak demand caused by the unexpected growth in U.S. crude oil inventories. Conversely, expectations of interest rate cuts by the Federal Reserve have provided some support for oil prices. Going forward, the production decisions of OPEC+ and changes in the geopolitical landscape will be the key factors determining the future trend of oil prices.
USOIL : Don't be fooledHello friends
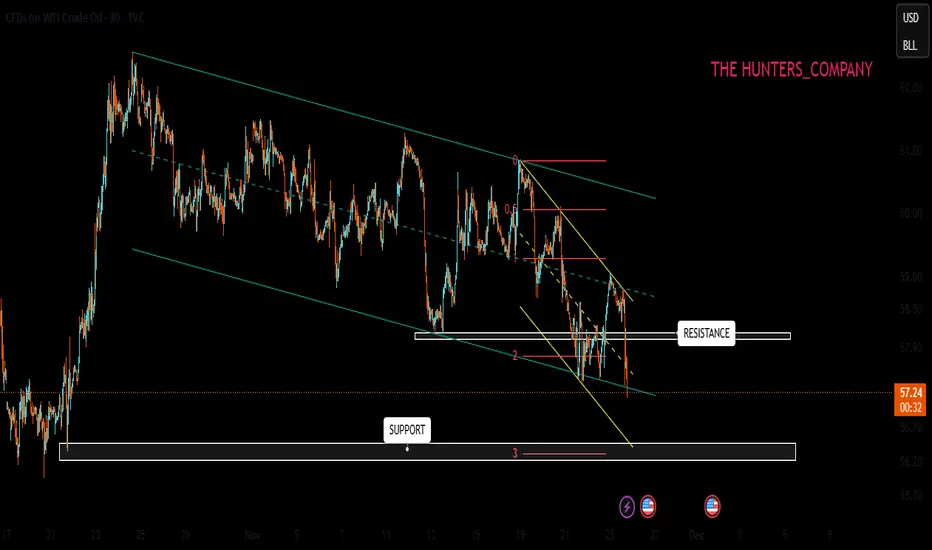
Well, you see that we have a descending channel that has hit the ceiling twice and the ceiling three times.
Well, in the third encounter with the bottom or support, you see that the buyers provided good support for the price and pushed it up and broke our medium-term ceiling. Now, if the breakdown is confirmed, the price will go to the ceiling of the channel and from there, a price correction can be expected.
The specified range is very important for a sell trade. Why?
Because there are many orders here, if the price reaches this area, it will inevitably correct. And there is another reason that we have, and the most important reason is that our trend is down and we should not open a trade against the trend.
This analysis is technically reviewed and is not a recommendation to buy or sell.
Avoid emotional behavior and observe capital management.
*Trade safely with us*

Usoil Next MoveUsoil Under Selling Pressure We Sell At 62.045 For Tp 52.02
Usoil In Bearish Structure Don't Miss This Opportunity Manage Your Risk Properly
For more updates Stay Tuned

USOIL at breakout level, what's next??#USOIL - market just near to his breakout level and that is 58.80
Keep close that level and sustain above means a push to higher side on the table.
Good luck
Trade wisley

USOIL : Full analysisHello friends
Well, you see that we have a descending channel in which the price is moving, and considering that the price reached the ceiling of the channel, we had a Sharpe decline, and now it seems that the sellers want to break the channel, and the first support identified could be the buyers' stronghold, where we need to see if they support the price or not.
If they support, there is a significant resistance in their way. This area is full of sell orders and can naturally correct the price. In this regard, breaking this resistance is very important and vital for price growth.
Now what if the buyers cannot support the price in the support area and the price falls further?
Well, we need to find areas again for a sell trade because if the descending channel is broken, the fall will be heavier and it is better to move with the trend.
This analysis is purely technical and is not a buy or sell recommendation.
*Trade safely with us*
USOIL : LIVE TRADE
Hello friends
Well, considering the downtrend and the power of the sellers, we should also follow the trend and go to the side of the one who has the power.
Given the price drop, if the price pullbacks, we can see the price drop again.
This post is not a buy or sell offer and is only reviewed from a technical perspective.
Observe risk and capital management and avoid emotional movements.
*Trade safely with us*
USOIL trades with a weak oscillatory biasUSOIL is exhibiting a weak oscillatory downward trend today. Despite a slight rebound yesterday, affected by bearish news and technical pressure, the intraday upside momentum remains insufficient, with bearish momentum gradually emerging. Overall, it shows a sluggish pattern of a quick pullback after the rebound.
For the upside, focus on the short-term resistance zone of $59.5 - $60.5 per barrel, among which $59.5 per barrel can be regarded as a key watershed. On the downside, closely monitor the support range of $57.0 - $57.5 per barrel. If this zone is effectively broken down, the price may further decline to around $56 per barrel.
Sell 59 - 59.7
SL 60.1
TP 57.5 - 57 - 56.5