Crude OilU.S Oil
- Bullish Channel as an corrective pattern in Long Time Frame
- Change of Characteristics
- RSI - Divergence
- Completed " 12345 " Impulsive Waves
- Symmetrical Triangle in Short Time Frame
Usoilprediction

Crude Oil (USOIL): Bullish Structure + Mean Reversion Entry⚡ WTI CRUDE OIL (USOIL) - BULLISH SWING STRATEGY 🛢️
📊 Institutional Trading Plan | Global Energy Market
🎯 EXECUTIVE SUMMARY
Market: USOIL (WTI Crude Oil Spot)
Session: Day/Swing Trading
Direction: BULLISH (Confirmation)
Current Level: $63.65 USD/barrel
52-Week Range: $54.98 - $78.40
📈 TECHNICAL STRUCTURE OF THE PLAN
✅ Bullish Confirmation
WTI has formed a "Channel Up" monthly pattern, showing:
✨ Multiple Higher Highs and Higher Lows confirmed
✨ Positive response to key support levels (channel bottom)
✨ Technical pullback on Strategic Moving Averages
✨ Positive momentum with institutional volume
Recent: Crude oil bounced from $62.14 USD on February 2 session, validating key support after initial euphoria.
🔌 ENTRY STRATEGY - PROFESSIONAL LAYERING SYSTEM
Important Note: You are absolutely responsible for your trading decisions. This plan is educational, not financial recommendation.
📍 Entry Levels (Layering System - "Thief Strategy")
Layer 1 - Aggressive Entry:
$62.00 USD → Strong support + Technical confluence
Layer 2 - Strategic Entry:
$62.50 USD → 50-period Moving Average approximation
Layer 3 - Balanced Entry:
$63.00 USD → Neutral/pullback zone (current area)
Layer 4 - Conservative Entry:
$63.50 USD → Secondary impulse confirmation
Flexibility: Any entry level is viable according to your risk profile and preferred timeframe.
🎯 PRICE TARGET (TP) - INSTITUTIONAL RESISTANCE
Main Target: $66.50 USD/barrel
Technical Reasons:
✅ Historical structure resistance + expected pullback zone
✅ Overbought conditions detected on oscillators
✅ "Bullish trap" zone - institutional density
✅ Correlation with Brent ($68-70) suggests probable peak here
✅ Institutional profit-taking expected at this level
Secondary Scenario: If you break $66.50 with volume, next TP = $67.50-68.00 USD
🛑 STOP LOSS (SL) - RISK MANAGEMENT
Professional Stop Loss: $61.00 USD/barrel
Justification:
🛡️ Base support of monthly bullish channel
🛡️ Breaking below invalidates bullish thesis
🛡️ Optimal distance for favorable risk/reward ratio
🛡️ Technical level backed by multi-timeframe analysis
Your Responsibility: Setting SL is YOUR PERSONAL DECISION. Manage your capital according to risk tolerance.
💰 RELATED PAIRS TO MONITOR | CORRELATION ANALYSIS
🌍 Correlated Pairs:
1. BRENT CRUDE (EUCRUDE)
Current Price: $65.92 USD/barrel
Correlation: +0.92 (Highly correlated)
WTI/Brent Ratio: 1.04 (WTI slight discount)
Monitoring: If USOIL rises, EUCRUDE typically follows +1-2%
Key Point: Brent acts as "global barometer" of energy demand
2. US DOLLAR (DXY)
Correlation: -0.73 (Strong inverse)
Impact: Stronger USD = Cheaper oil (non-USD buyers lose purchasing power)
Critical Level: DXY > 107.50 generates downward pressure on USOIL
Strategy: Monitor Fed + interest rates
3. STOCK INDICES (S&P 500 / SPY)
Correlation: +0.68 (Risk-sentiment)
Dynamic: Bullish markets = Higher future energy demand
Bullish Divergence: If SPY rises but USOIL doesn't, speculative opportunity
4. RELATED ENERGY PAIRS
Gasoline (GASOLINE Futures): +0.85 correlation
Natural Gas (NGT): +0.45 correlation (weaker relationship)
Uranium (URA): +0.20 correlation (independent)
5. CHINESE YUAN PAIR (CNYRUB)
Correlation: +0.55 (Asian demand)
Context: China is world's largest crude importer
Indicator: Yuan weakness = Lower oil purchases
📰 CRITICAL FUNDAMENTAL & ECONOMIC FACTORS
🚨 GEOPOLITICS - RISK FACTOR #1
🔴 Current Situation (February 2026):
US-IRAN NEGOTIATIONS (Most Recent: February 6, 2026)
✅ Diplomatic conversations confirmed in Oman (February 6)
✅ Reduction of geopolitical risk premium since January highs
⚠️ Uncertainty: Disagreement on scope of negotiations persists
📊 Price Impact: Each "progress" news = -2 to -4% in WTI
📊 Price Impact: Collapse in negotiations = +3 to +8% in WTI
Critical Fact: Iran represents ~30% of OPEC production = Massive disruption potential
RUSSIA-UKRAINE TENSION
🔴 Recent attacks on Ukrainian energy infrastructure
⚖️ Possible high-level negotiations between Washington and Moscow
📍 Impact: Russian supplies (11% global) at potential risk
🎯 Monitoring: Any escalation = +$2-5 automatically in WTI
📊 SUPPLY AND DEMAND (Fundamentals)
OPEC+ DECISION (February 1, 2026)
✅ 8 OPEC+ countries reaffirm freeze on production increase for March
✅ DELAY OF INCREMENTS: Reason = weak seasonal demand (Q1)
📋 Reserve of cuts: 1.65 million barrels/day still available if market requires
🔄 Next Meeting: March 1, 2026 - Market Review
Excess Capacity:
🛢️ Spare capacity (~2.5 million bbl/day) mainly in Saudi Arabia
🛢️ Acts as "safety net" if Iran disconnects
💡 OPEC+ Strategy: Keep prices "comfortable" without deeper cuts
NORTH AMERICAN INVENTORIES (EIA - Last Week January 2026)
✅ DECLINE: -3.5 million barrels in week ending January 30
✅ Bullish signal = Reduction of surplus
📈 Critical next reports: every Thursday at 10:30 AM EST
GLOBAL PRODUCTION (Q3 2025 - Latest Data)
📊 OPEC Production: 106.03 million bbl/day
📊 Global Production (IEA): 108.06 million bbl/day
⚠️ 2026 Projection: Possible oversupply of 3.8 million bbl/day (per IEA)
⚠️ Long-term downward pressure
💱 GLOBAL ECONOMIC FACTORS
GLOBAL ENERGY DEMAND
🌐 Global economic growth 2026 = 3.1% (OPEC)
🌐 Energy demand growth 2026 = +1.4 million bbl/day (vs 2025)
🌐 OECD: +0.2 mb/d | Non-OECD: +1.2 mb/d
🎯 Impact: Lower growth = Limited upward pressure
KEY MACROECONOMIC INDICATORS
📉 Weak private employment data (USA) = Slowdown concerns
📉 Milder weather forecasts = Lower heating consumption
💪 ISM Manufacturing PMI (January USA): Next February 3 = Key for sentiment
DOLLAR STRENGTH
💹 DXY (Dollar Index) at relative highs
💹 Stronger dollar = More expensive oil in foreign currencies = Lower demand
💹 Change: Fed could hold rates or reduce based on February data
TRADE AGREEMENTS (Emerging Factor)
🤝 Trump-India: Oil tariff reduction (25% → 0%)
🤝 India can increase US crude purchases
📊 Impact: Potential demand +500k-1M bbl/day in US Oil
🎤 UPCOMING CRITICAL EVENTS TO MONITOR
📅 February 6 → US-Iran Negotiations in Oman 🔴 VERY HIGH IMPACT (Geopolitical Key)
📅 February 10 → ISM Services PMI (USA) 🟠 HIGH IMPACT (Economic Health)
📅 February 13 → Weekly EIA Inventories 🟡 MEDIUM-HIGH IMPACT (Real Demand)
📅 March 1 → OPEC+ Meeting Decision 🟠 HIGH IMPACT (Production Policy)
📅 February → Energy Corporate Earnings 🟡 MEDIUM IMPACT (Investment Guidance)
💎 "THIEF OG" TRADER WISHLIST - MOTIVATION & MINDSET
"In the energy market, patience is power. Institutions build positions slowly, while emotional traders lose fast."
🚀 Professional Trading Principles:
✨ "Lay Your Traps, Not Your Emotions"
Layered entries allow you to break even even on losing trades
Each dip is an opportunity to average down, not to panic
✨ "Follow the Institutions, Not the Hype"
Big funds wait at $62-63, they don't jump at $65
Institutional volumes confirm = USOIL will rise sustainably
✨ "Geopolitics is the New Fundamentals"
2026 is a year of uncertainty: Iran, Russia-Ukraine, China
Each news = Volatility = Opportunity for prepared traders
✨ "Risk Management is Not Boring, It's Freedom"
SL at $61.00 = Maximum -$2.65 loss per barrel
TP at $66.50 = Maximum +$3.85 gain per barrel
Ratio 1:1.45 = Professional, sustainable, repeatable
✨ "Trade the Plan, Not Your Dreams"
Layered entry = Don't perfect the timing (impossible)
Fixed TP = Take profits without regrets
Fixed SL = Controlled losses = Portfolio preserved
📈 CONCLUSION: WHY NOW IS THE TIME?
BULLISH SCENARIO: The confluence of technical factors + seasonality + controlled geopolitics = Clear swing trade opportunity
Ideal Setup:
✅ Confirmed monthly channel pattern bullish
✅ Technical pullback offers staggered entries
✅ Clear targets at institutional resistance
✅ Defined and rational stop loss
✅ Secondary correlations confirm energy panorama
Horizon: 5-15 days (Swing Trade) | Potential: +$2.85 - $3.85 per barrel
🛢️ "Oil doesn't lie. Fundamentals align with technicals. The question isn't 'if' USOIL rises to $66.50, but 'when'."
🎯 LET'S WIN, TRADER OG'S! RESPECT THE PLAN. 💪

WTI (USOIL) Price Outlook – Trade Setup📊 Technical Structure
TVC:USOIL WTI is currently trading within a rising channel, after rebounding from the recent swing lows. Price has found support around the $60.15–$60.33 support zone, where buying interest has emerged and downside momentum has slowed.
The market structure suggests a potential bullish continuation. As long as WTI holds above the support zone, price action favours a rebound toward the $61.04–$61.21 resistance zone. The projected path indicates a brief consolidation near current levels, followed by an upside push into the resistance band, rather than an immediate breakdown.
🎯 Trade Setup (Bullish Bias)
Entry Zone: 60.15 – 60.33
Stop Loss: 59.99
Take Profit 1: 61.04
Take Profit 2: 61.20
Risk–Reward Ratio: Approx. 1 : 2.26
📌 Invalidation
A sustained break and close below $59.99 would invalidate the bullish setup and signal a deeper downside correction.
🌐 Macro Background
The broader macro backdrop remains mixed but supportive for WTI in the near term. Easing geopolitical tensions after President Trump stepped back from tariff threats against European nations have helped stabilize risk sentiment, providing short-term support for crude prices.
At the same time, signals of temporary supply disruptions in Kazakhstan have added upside pressure, as production at major oilfields was halted following power outages. However, the upside remains capped by persistent oversupply concerns, with the International Energy Agency (IEA) reiterating that global oil supply is expected to significantly exceed demand this year.
In the short term, markets are digesting these opposing forces, with price action favouring range-based recovery moves when crude stabilizes at well-defined technical support.
🔑 Key Technical Levels
Resistance Zone: 61.04 – 61.21
Support Zone: 60.15 – 60.33
Bullish Invalidation: Below 59.99
📌 Trade Summary
WTI is holding above a critical support zone within a rising channel after a corrective pullback. As long as price remains supported above $60.15, the bias favours a buy-on-dips approach, targeting a continuation move toward the upper resistance band.
⚠️ Disclaimer
This analysis is for reference only and does not constitute investment or trading advice. Financial markets involve risk, and traders should manage positions according to their own risk tolerance.

Crude OilUS Oil
- Falling Wedge as an corrective pattern in Short Time Frame
- Break of Structure
- Change of Characteristics
- Support Level
- Order Block

USOIL Bearish Continuation Setup | Technical & Macro ViewUSOIL (WTI Crude) Bear Plays 🔥 | Oversupply + Economic Cues 📉 | Day/Swing Trade Tech + Fundamental Edge
🎯 Asset: USOIL (WTI Crude Oil) — Energies Market Trade Opportunity (Day/Swing)
📉 Bias: Bearish setup — continuation pressure confirmed
📍 Current Price Context: ~57.3 USD/bbl (WTI) with downside structural momentum below key dynamic resistance, trend shows continued bearish bias with decaying demand and oversupply pressure.
🧠 TRADE PLAN
🔻 Entry: Any favorable lower level entry within bear momentum zones — look for rejects at lower highs and trend continuation.
❌ Stop-Loss (SL): This is thief SL @ 57.50 Dear Ladies & Gentleman (Thief OG's) Adjust your SL based on your strategy & own risk,
⚠️ Note: Dear Ladies & Gentleman (Thief OG's) iam not recommended to set only my SL. its your own choice you can make money then take money at your own risk.
🎯 Target: Police force act as a strong support + oversold + trap + correction is there so kindly escape with profits OUR target @ 55.00
⚠️ Note: Dear Ladies & Gentleman (Thief OG's) iam not recommended to set only my TP. its your own choice you can make money then take money at your own risk.
🔁 RELATED PAIRS / WATCHLIST & CORRELATIONS
📌 BLACKBULL:BRENT — If Brent extends weakness, USOIL often accelerates downside.
📌 OANDA:USDCAD — CAD tends to strengthen when oil drops, watch for confirmation.
📌 Energy Sector ETF ( AMEX:XLE ) — Weakness here often previews crude downside risk.
📌 NATGAS ( VANTAGE:NG ) — Not directly correlated but sentiment flow can affect broader energy trading appetite.
📌 Oil ETF ( AMEX:USO ) — Tracks broader oil sentiment and institutional positioning.
📌 TECHNICAL EDGE — KEY POINTS
📉 Descending channel dominance — confirmed lower highs & lower lows.
📊 Price respects dynamic resistance with weak bullish momentum.
⚠️ Breakdown of intermediate support can accelerate price toward lower demand zones.
🌍 FUNDAMENTAL & ECONOMIC FACTORS (CURRENT CONTEXT)
📉 Oversupply Pressure: Global crude supply continues to exceed demand, keeping price rallies capped and sellers in control.
📦 Inventory Dynamics: U.S. crude inventory changes show mixed signals, but structural supply remains elevated.
🌍 Geopolitical Watch: Ongoing geopolitical developments and production policy shifts remain volatility triggers.
📉 Demand Side Risk: Slower global growth expectations and industrial demand softness continue to weigh on crude.
📅 Economic Calendar Impact: U.S. labor data, inflation data, and central bank guidance can influence USD strength and risk sentiment, directly impacting oil prices.
🔔 KEY MARKET THEMES (LATEST)
🛢️ Oil prices remain pressured under supply-heavy outlook
📉 Sellers defending lower highs aggressively
⚠️ Volatility expected around macro data releases

WTI Crude Oil 4H Setup – Liquidity Zones & FVG ReactionThis 4-hour chart of WTI Crude Oil (FXCM) highlights a potential trade setup based on liquidity structure and Fair Value Gaps (FVG). Key zones include Buy Side Liquidity (BSL), Sell Side Liquidity (SSL), and both 4H and Daily FVGs. An Optimal Trade Entry (OTE) is marked, with entry, stop-loss, and take-profit levels clearly defined. Price action suggests a reaction from the FVG zone, with structure favoring a move toward the next liquidity pool. The setup reflects Smart Money Concepts and precision-based execution.

USOIL (WTI) – High-Probability Bullish Setup USOIL (WTI) – High-Probability Bullish Setup from Strong Demand Zone
🔍 Market Structure & Price Action Insight
USOIL is currently trading inside a well-defined and repeatedly tested demand zone between 55.10 – 56.50.
This zone has proven its strength by rejecting price three times in the past, each time producing a meaningful bullish reaction.
The current revisit into this zone offers a high-quality risk-defined buying opportunity for swing and positional traders.
📌 Trade Execution Plan (Bullish Bias)
🟢 Entry Zone:
55.10 – 56.50
🔴 Stop Loss:
50.00
(Below the demand structure to avoid false breakdowns)
🎯 Target 1:
64.00
(Previous structure + supply reaction area)
📊 Technical Confluence
✔ Multiple demand-zone validations
✔ Price reacting at historical accumulation area
✔ Clear structure-based invalidation level
✔ Favorable Risk : Reward profile
🧠 Professional Trading Insight
Strong trades are not created by prediction, but by location and confirmation.
When price revisits a proven demand zone, patience and discipline offer an edge. Entries taken close to demand provide superior psychology and controlled risk.
📈 Trade Management Note
Partial booking can be considered near intermediate resistance levels.
Trail stop only after structure confirmation — let the market do the work.

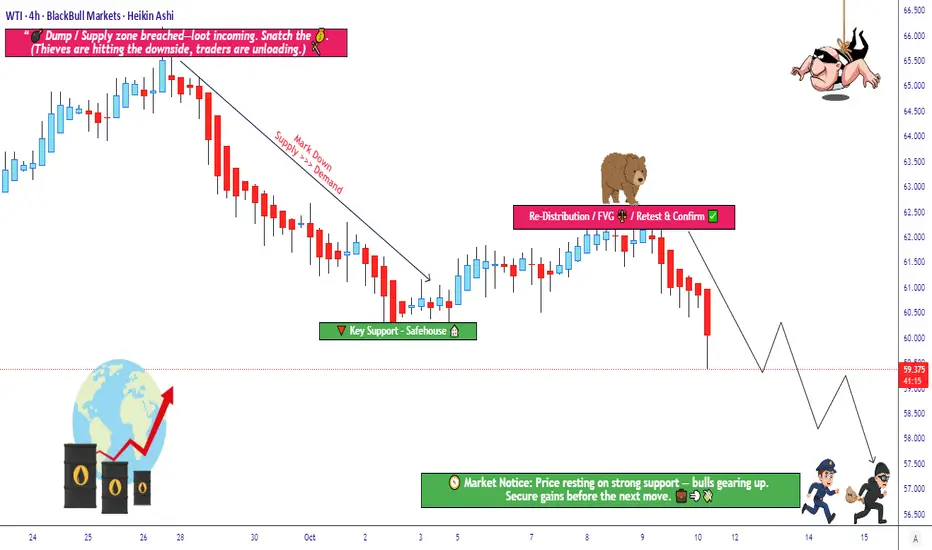
Is Crude Oil Setting Up for a Major Bearish Reversal?🛢️ XTI/USD “WTI” – Bearish Redistribution Zone Incoming (Thief Strategy Inside)
📉 Setup Overview
Market: XTI/USD (WTI crude oil)
Bias: Bearish confirmed — we’re looking for re-distribution / supply pressure to take control
Trade Type: Swing / Day Trade hybrid
🎯 Entry Plan (Thief-Layer Strategy)
I use a layering / multiple limit order approach (aka “Thief Strategy”). You may use any price level as entry, but here’s my preferred ladder:
Sell Limit @ 61.500
Sell Limit @ 61.000
Sell Limit @ 60.500
Sell Limit @ 60.000
Sell Limit @ 59.500
(You may extend more layers if you like)
You don’t need to hit all layers — just get partial fills, ride the move downward.
🚫 Stop Loss
Thief’s SL: 62.500
⚠️ Note to Thief OG’s: I’m not forcing you to follow my SL. You choose what works. Make money, take money — at your own risk.
🎯 Target
We see police barricade as a strong support zone + oversold trap possibility.
So primary target: 57.000
⚠️ Note to Thief OG’s: Don’t blindly hold to my TP. If price gives you your gains early, escape with your money — don’t wait for perfection.
🔍 Related Pairs & Correlations
AMEX:USO or USOIL (oil ETFs / indices) – real-world crude correlation
$BRENT/USD – watch for strength or weakness divergence
AMEX:XOP / AMEX:OIH (oil & gas sector indices) – sentiment in energy names
Key point: if Brent weakens while WTI breaks down, it reinforces the bias.
📌 Key Technical Notes
We’re waiting for ** redistribution / supply zone** to hold — a retest or failure bounce is ideal setup.
Oversold conditions + a “trap” candle (fake breakout) strengthen the move.
Use layering to average in, not “all-in” at once.
Be ready for whipsaws around support zones; partial exits can help.
✨ “If you find value in my analysis, a 👍 and 🚀 boost is much appreciated — it helps me share more setups with the community!”
Disclaimer: This is Thief-style trading strategy just for fun. I am not giving financial advice. Trade at your own decision and risk.
#WTI #CrudeOil #XTIUSD #EnergyTrading #OilStrategy #Layering #SwingTrade #DayTrade #BearishBias #ThiefStrategy
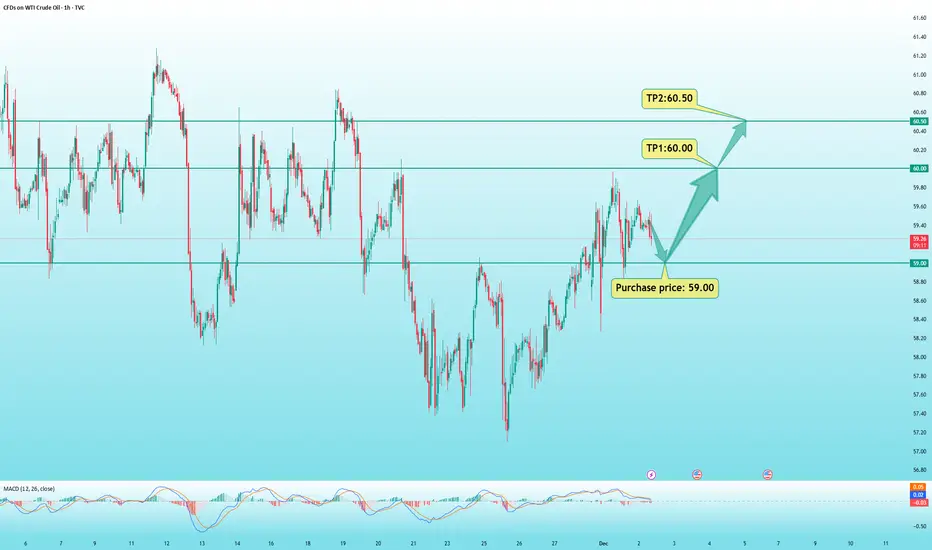
USOIL: Wait for a pullback to $59 to buy.During Monday’s Asian trading session, NYMEX West Texas Intermediate (WTI) crude oil futures rose 1.7%, trading around $59.30 per barrel. Oil prices opened strongly as OPEC+ agreed to halt production increases starting from Q1 2026, providing solid buying support at the open.
On the 1-hour chart, crude oil is showing high-level consolidation, with prices repeatedly oscillating around the moving average system, indicating a short-term neutral, range-bound objective trend.
However, from a subjective trend perspective, the bias remains to the upside. The MACD fast and slow lines have pulled back toward the zero axis and are about to form a bullish crossover, suggesting that bullish momentum is building.
There is a high probability that crude oil will break to new intraday highs today.
Intraday Trading Plan:
Buy near: $59.00
Take Profit 1: $60.00
Take Profit 2: $60.50
Stop-loss: Adjust based on individual risk tolerance
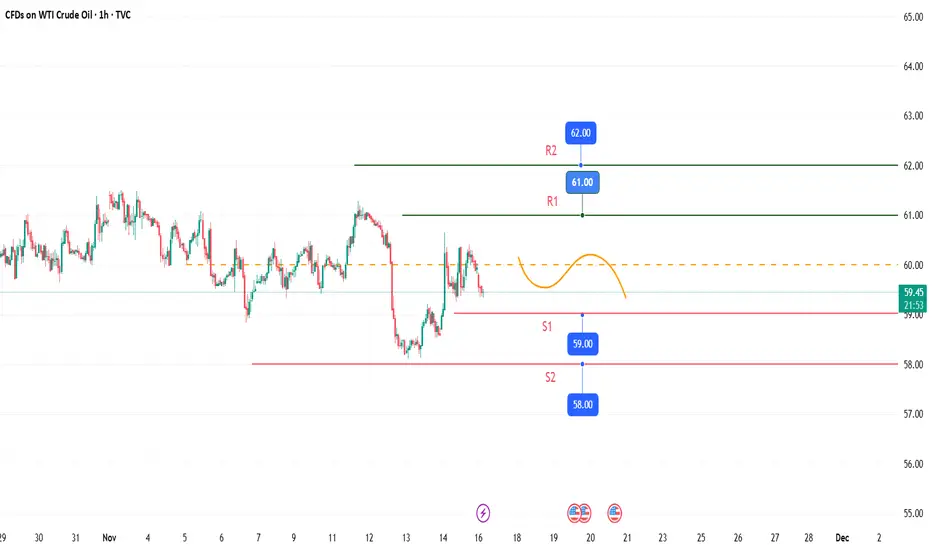
Weekly USOIL Trend SummaryOverall, USOIL oscillated at a low level with a slight upward trend during the period from November 24 to November 28, 2025. Despite minor fluctuations of gains and losses throughout the week, it hovered around $59 per barrel and failed to break free from the consecutive monthly decline trend that began this month. The specific trend is detailed in segments as follows:
1.Modest Gain at Week's Start with Synchronous Weakening Price Spread (November 24)
USOIL kicked off the week with a slight upturn. It closed at $58.89 per barrel that day, rising $0.91 or 1.57% compared with the previous week's closing price of $57.98 per barrel.
2.Oscillating Consolidation in Mid-Week, with Gains Constrained by Oversupply Expectations (November 25 - 26)
On November 25, oil prices traded sideways, hovering around $58.77 per barrel with a slight drop of approximately 0.91%.
On November 26, the market rebounded, and the growth rate of the relevant oil and gas index expanded to 0.87%. Oil prices followed suit with an upward movement. However, they failed to break through the earlier oscillating range overall. Meanwhile, potential incremental pressure on the supply side left the oil price rally lacking strong momentum.
3.Minor Fluctuations at Week's End Awaiting Policy Signals (November 27 - 28)
On November 27, oil prices pulled back slightly, and the corresponding oil and gas index edged down by 0.08%. After encountering resistance near $59 per barrel, oil prices retreated moderately. Market sentiment turned increasingly cautious as investors focused on the OPEC+ production policy meeting scheduled for Sunday.
On November 28, oil prices inched up again, and the oil and gas index rose by 0.67%, hitting a weekly closing high of 309.33 points.
Overall, although USOIL recorded a slight increase this week, it remained trapped in a low - range. Moreover, this month marks its fourth consecutive monthly decline, the longest losing streak since 2023. The main bearish factors weighing on oil prices include the expected lifting of sanctions on Russian oil driven by progress in the Ukraine peace talks and weak demand caused by the unexpected growth in U.S. crude oil inventories. Conversely, expectations of interest rate cuts by the Federal Reserve have provided some support for oil prices. Going forward, the production decisions of OPEC+ and changes in the geopolitical landscape will be the key factors determining the future trend of oil prices.
Usoil Next MoveUsoil Under Selling Pressure We Sell At 62.045 For Tp 52.02
Usoil In Bearish Structure Don't Miss This Opportunity Manage Your Risk Properly
For more updates Stay Tuned

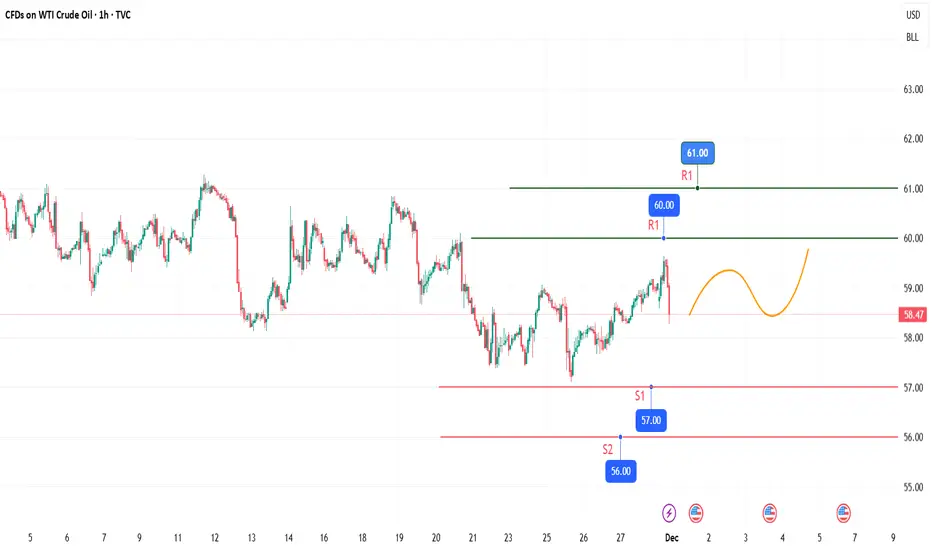
USOIL trades with a weak oscillatory biasUSOIL is exhibiting a weak oscillatory downward trend today. Despite a slight rebound yesterday, affected by bearish news and technical pressure, the intraday upside momentum remains insufficient, with bearish momentum gradually emerging. Overall, it shows a sluggish pattern of a quick pullback after the rebound.
For the upside, focus on the short-term resistance zone of $59.5 - $60.5 per barrel, among which $59.5 per barrel can be regarded as a key watershed. On the downside, closely monitor the support range of $57.0 - $57.5 per barrel. If this zone is effectively broken down, the price may further decline to around $56 per barrel.
Sell 59 - 59.7
SL 60.1
TP 57.5 - 57 - 56.5
USOIL : LIVE TRADEHello friends
Given the bearish structure we had, the price has now been supported by buyers at the specified support several times and we can expect this support to continue.
Observe risk and capital management and avoid emotional and irrational behavior.
*Trade safely with us*

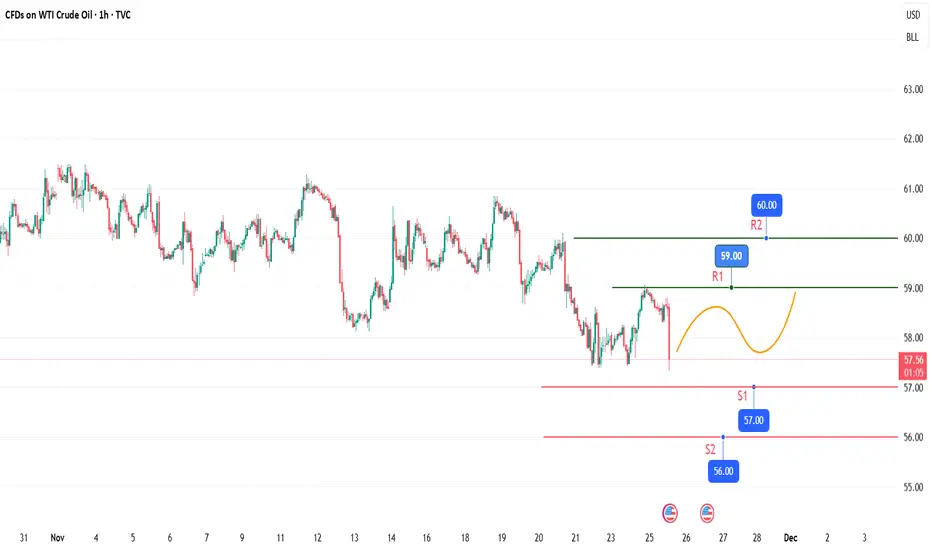
Crude oil: Weak ConsolidationToday, crude oil is trading with a weak oscillatory bias, fluctuating narrowly within the 57 - 58 per barrel range. The softened geopolitical risks have set the tone for the subdued market sentiment, while the technical landscape remains dominated by bears.
Key Levels:
Support Zones:Immediate support is concentrated around 57.0 – 57.4 per barrel, with notable buying interest emerging near 57.6. A breakdown below this zone could pave the way for a test of 56.0 per barrel, potentially extending to the vicinity of the annual low around the same level.
Resistance Levels:Near-term resistance lies around 58.75 per barrel, where some trading strategies suggest initiating short positions. Further resistance is seen at the 59.0 – 60.0 per barrel range; only a decisive breakout above this interval can alleviate the short-term bearish momentum. For a full trend reversal, a breach of the long-term key resistance at 61.44 per barrel is required.

USOIL: Consolidation First, Breakout Next After crude oil plummeted last week to a low near 58.1, it rebounded on Friday and closed around 59.5, basically confirming a consolidating trend.
For this week, crude oil is expected to first trade in a low-range consolidation before assessing the potential for a unilateral move. Focus on the 58 level as support below and 62 as resistance above; trade within this range using a "buy low and sell high" strategy.
Go long around the 58.2 level.
Go short around the 61.8 level.
If the price breaks out of this range, then look for a unilateral trend to follow.
Bearish USOIL: 58 at RiskUSOIL extended the previous session's decline today, showing an overall weak fluctuating downward trend. The core bearish factor of oversupply continues to weigh, with a lack of short-term rebound momentum.
On the indicator front, the 9-day EMA has crossed below the 20-day EMA, forming a short-term death cross signal, indicating that the downward trend is likely to continue. The 14-day RSI hovers around 40, remaining in a downward channel with no oversold rebound signals, suggesting that bears still hold the initiative and there is no large-scale entry of bottom-fishing funds.
In terms of resistance and support, short-term rebound resistance is concentrated at the pivot point of 59.28 and the 59.50-60 range. As a key integer level, failure to reclaim 60 will see bearish sentiment continue to spread. For support below, focus first on 55.7; if the 58 level is broken, a accelerated drop to this support level is highly likely.
Trading Strategy:
Buy 58 - 58.3
SL 58
TP 59 - 59.5 - 60
Sell 59.5 - 60
SL 60.5
TP 58.5 - 58 - 57.5

USOIL: Fluctuating declineCrude oil showed a trend of fluctuating decline today, breaking through key support levels, with a clear bearish dominance.
Key support below: In the short term, attention should be paid to the $59.00 integer mark. If this level is breached, oil prices may further drop to $58.00.
Resistance levels for rebound: If there is a technical rebound in oil prices, the first resistance level is at $60.50, and the second resistance level is at $61.50, with limited rebound space.
Trading Strategy:
Buy 59 - 59.5
SL 58.5
TP 60 - 60.5 - 61
Sell 60.5 - 61
SL 61.5
TP 59.1 - 58.5
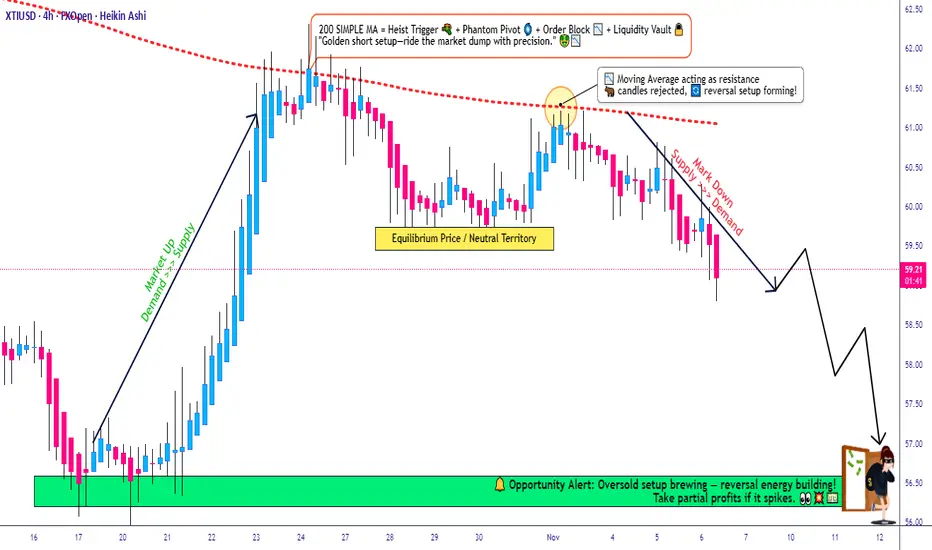
Is XTI/USD Setting Up for a Sharp Bearish Correction?🚨 WTI/USD CRUDE OIL: THE BEARISH HEIST AWAITS 🎯
═══════════════════════════════════════════════════════════
THE SETUP: Breaking Down The Crime Scene 🕵️♂️
We're executing a bearish pullback strategy on WTI/USD spot crude oil, leveraging the 200-period Simple Moving Average (SMA) as our primary technical confirmation. The energy sector is flashing opportunity signals, and it's time to work the levels like a seasoned professional.
📊 STRATEGY FRAMEWORK
Market Direction: Bearish Pullback from 200 SMA Resistance
Timeframe: Suitable for Swing & Day Trading Operations
Asset Class: Energies | WTI Crude Oil Spot
💰 THE LAYERED ENTRY STRATEGY (Multi-Level Approach)
This is where the Thief Method shines—stacking limit orders at key price levels to accumulate positions as the market comes to you:
Suggested Entry Layer Points:
Layer 1: 60.50 💧
Layer 2: 60.00 💧
Layer 3: 59.50 💧
Layer 4: 59.00 💧
⚠️ Pro Tip: Feel free to add or adjust layers based on your risk tolerance and position size. The beauty of this method is scalability—customize to YOUR account size and risk parameters.
🛑 STOP LOSS PLACEMENT
Primary SL Level: 61.00
Positioned at the nearest swing high/candle wick resistance above our entry cluster. This respects natural market structure and gives us a defined, measurable risk point.
⚡ DISCLAIMER ON RISK MANAGEMENT:
This is NOT financial advice. Risk management is YOUR responsibility. The suggested SL is based on technical structure, but YOU control your account. Set stops that align with YOUR risk tolerance. Trade only what you can afford to lose.
🎯 PROFIT TARGET STRUCTURE
Primary Target: 56.50
Secondary Support Level: 56.00 — A police barricade of strength where multiple factors converge:
Strong historical support confluence 📍
Oversold zone recognition ⚖️
Potential reversal trap (exit strategy alert) ⚠️
Exit Strategy: Consider banking profits at 56.50 before support intensifies at 56.00. Lock in gains as the technical structure suggests potential friction.
⚡ DISCLAIMER ON PROFIT TARGETS:
Again, these are TECHNICAL levels only. YOU decide your exit strategy. Whether you take full profits at 56.50, trail stops, or use partial exits—this is YOUR trading plan. No setup is guaranteed.
🔗 RELATED PAIRS TO WATCH (Correlation Check)
Understanding energy market interrelations helps you spot confirmation signals:
US Dollar Index ( TVC:DXY ) → Inverse correlation to crude oil. Strengthen USD = Bearish pressure on oil. Watch DXY for confirmation of our bearish bias.
CSEMA:S&P 500 ( AMEX:SPY / CME_MINI:ES1! ) → Risk sentiment indicator. If equities weaken, crude often follows bearish patterns. Check equity trends for macro confirmation.
Energy Select Sector ETF ( AMEX:XLE ) → Direct correlation. Tracks large-cap energy stocks. Oil weakness often precedes XLE drops.
FX:EURUSD → Global risk sentiment. Weak euro = risk-off environment = potential crude weakness. Monitor for macro context.
AMEX:USO (Crude Oil ETF) → Direct oil tracking instrument. Moves in lockstep with WTI. Use for backup confirmation.
📋 THE THIEF STRATEGY CHECKLIST
✅ Confirm 200 SMA as resistance/bearish context
✅ Stack limit orders—don't chase price
✅ Define your personal stop loss (around 61.00 structure)
✅ Target scale-outs near 56.50-56.00
✅ Use correlation pairs for macro confirmation
✅ Manage position size ruthlessly
✅ Accept losses—they're tuition in the market
💬 ENGAGEMENT BOOST
✨ If you find value in my analysis, a 👍 and 🚀 boost is much appreciated — it helps me share more setups with the community!
#WTI #CrudeOil #EnergyTrading #TechnicalAnalysis #ThiefStrategy #SwingTrading #DayTrading #Trading101 #ForexEnergy #MultiLayerEntry #RiskManagement #TradingSetup #FinancialMarkets #Energies #TradingCommunity
Crude oil: Consolidating sideways in the short term.Crude oil prices once hit a low not seen in over two weeks. In early trading on Monday, prices remained below the psychological threshold of $60 per barrel. Therefore, bullish traders should exercise caution before going long and adopt a prudent approach to positioning in anticipation of any substantial upward movement.
Crude oil is oscillating within a range in the short term. Prices have repeatedly crossed the moving average system, with the short-term objective trend direction being sideways consolidation. The MACD indicator is hovering around the zero line, reflecting a stalemate between bullish and bearish momentum. With oil prices trading in the middle of the range in early trading, it is expected that intraday crude oil movement will remain within the range, and a range-bound trading strategy is recommended.
Buy 58.8 - 59.3
SL 58.3
TP 59.8 - 60.3 - 61
Sell 60.4 - 61
SL 61.5
TP 59.1 - 58.5

Crude oil: test the upside potentialAfter completing the consolidation and foundation-building phase yesterday, crude oil has maintained a fluctuating upward trend today.
We will continue to monitor the strength and effectiveness of the rebound. Based on the momentum of the consolidation, crude oil should be able to extend its gains today. If the momentum is strong, it could reach around 61. Therefore, from a short-term perspective, we can still take long positions to test the upside potential.
Buy 58.8 - 59.3
SL 58.3
TP 59.8 - 60.3 - 61
Sell 61 - 60.5
SL 61.5
TP 59.5 - 59 - 58.5

Crude oil's downward space is expandingDue to a significant increase in U.S. crude oil inventories, WTI prices have extended their decline.
In the short term, crude oil’s trend saw a seesaw battle between bulls and bears near the lower edge of the range, with frequent shifts in momentum. Eventually, the bears prevailed, sending prices lower. The moving averages are in a bearish alignment, indicating an objectively downward short-term trend.
Oil prices have broken below the 60 support level. It is expected that crude oil’s intraday trend will continue to expand downward. And the short-term support is 58.5,If it breaks below 58.5, focus on the support level at 57.5, while resistance above is at 60.8.
Buy 58.5 - 58.8
SL 58
TP 59.3 - 59.8 - 60.3
Sell 60.5 - 60
SL 61
TP 59 - 58.5 - 58

Crude Oil Trading Strategy for TodayThe spot market and capital are in resonance, and short-term support is clear.
1.Strengthening of spot structure: The near-month WTI contract has returned to a spot premium structure, and the Brent-WTI spread is stable, reflecting the expectation of short-term supply tightness and providing a fundamental support for the current price.
2.Dual benefits of inventory and capital: U.S. EIA inventories have been reduced for several consecutive weeks, and the latest published value is significantly lower than expected, confirming the marginal improvement in demand; trend trading funds have recently increased their long positions, driving short-term short-squeeze momentum.
3.Cost and reserve support: Warren Buffett's Western Oil holdings imply a long-term equilibrium price of WTI at approximately $58.2, and the current price of $60.26 is close to the value support range; the U.S. SPR is at its lowest level since 1990, reducing its ability to stabilize oil prices and strengthening the bottom support.
Crude Oil Trading Strategy for Today
buy:59.5-60
tp:61-61.5
sl:58.5
Crude Oil Trading Strategy for Today"Smart money" quietly entered the market, and the buying power accumulated rapidly.
In the last three trading days, the speculative funds (hedge funds, investment banks, etc.) in the crude oil futures market suddenly increased their bullish positions by 150,000 lots, marking the largest weekly increase in 3 months. These funds began to build positions in batches when the oil price dropped below $60, just like when the oil price fell to $58 last year, it was also these funds that entered the market, and the oil price soon rebounded by $5. At the same time, the inflow of funds into crude oil ETFs also increased fourfold. Ordinary investors began to follow suit and enter the market, and the buying pressure changed from "scattered" to "concentrated", providing sufficient short-term upward momentum.
Crude Oil Trading Strategy for Today
usoil @ buy 61-61.5
tp:62-62.5
SL:60
