USOIL Bearish Continuation Setup | Technical & Macro ViewUSOIL (WTI Crude) Bear Plays 🔥 | Oversupply + Economic Cues 📉 | Day/Swing Trade Tech + Fundamental Edge
🎯 Asset: USOIL (WTI Crude Oil) — Energies Market Trade Opportunity (Day/Swing)
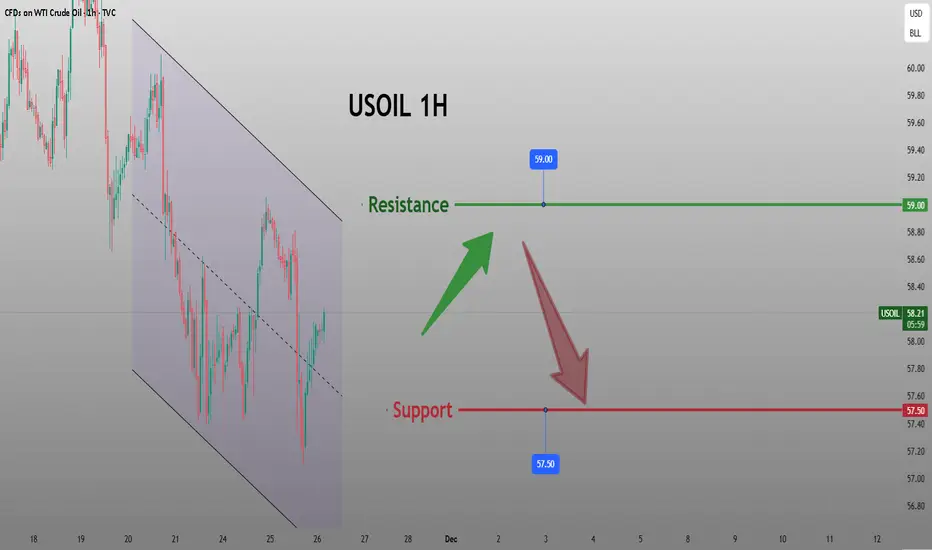
📉 Bias: Bearish setup — continuation pressure confirmed
📍 Current Price Context: ~57.3 USD/bbl (WTI) with downside structural momentum below key dynamic resistance, trend shows continued bearish bias with decaying demand and oversupply pressure.
🧠 TRADE PLAN
🔻 Entry: Any favorable lower level entry within bear momentum zones — look for rejects at lower highs and trend continuation.
❌ Stop-Loss (SL): This is thief SL @ 57.50 Dear Ladies & Gentleman (Thief OG's) Adjust your SL based on your strategy & own risk,
⚠️ Note: Dear Ladies & Gentleman (Thief OG's) iam not recommended to set only my SL. its your own choice you can make money then take money at your own risk.
🎯 Target: Police force act as a strong support + oversold + trap + correction is there so kindly escape with profits OUR target @ 55.00
⚠️ Note: Dear Ladies & Gentleman (Thief OG's) iam not recommended to set only my TP. its your own choice you can make money then take money at your own risk.
🔁 RELATED PAIRS / WATCHLIST & CORRELATIONS
📌 BLACKBULL:BRENT — If Brent extends weakness, USOIL often accelerates downside.
📌 OANDA:USDCAD — CAD tends to strengthen when oil drops, watch for confirmation.
📌 Energy Sector ETF ( AMEX:XLE ) — Weakness here often previews crude downside risk.
📌 NATGAS ( VANTAGE:NG ) — Not directly correlated but sentiment flow can affect broader energy trading appetite.
📌 Oil ETF ( AMEX:USO ) — Tracks broader oil sentiment and institutional positioning.
📌 TECHNICAL EDGE — KEY POINTS
📉 Descending channel dominance — confirmed lower highs & lower lows.
📊 Price respects dynamic resistance with weak bullish momentum.
⚠️ Breakdown of intermediate support can accelerate price toward lower demand zones.
🌍 FUNDAMENTAL & ECONOMIC FACTORS (CURRENT CONTEXT)
📉 Oversupply Pressure: Global crude supply continues to exceed demand, keeping price rallies capped and sellers in control.
📦 Inventory Dynamics: U.S. crude inventory changes show mixed signals, but structural supply remains elevated.
🌍 Geopolitical Watch: Ongoing geopolitical developments and production policy shifts remain volatility triggers.
📉 Demand Side Risk: Slower global growth expectations and industrial demand softness continue to weigh on crude.
📅 Economic Calendar Impact: U.S. labor data, inflation data, and central bank guidance can influence USD strength and risk sentiment, directly impacting oil prices.
🔔 KEY MARKET THEMES (LATEST)
🛢️ Oil prices remain pressured under supply-heavy outlook
📉 Sellers defending lower highs aggressively
⚠️ Volatility expected around macro data releases
Usoilsell

USOIL Price Analysis & Bearish Trade Execution🛢️ Asset: WTI “USOIL” – Energies Market Trade Opportunity Guide (Day/Swing Trade)
📉 Plan: Bearish Plan Confirmed
Momentum is weakening, liquidity pockets are exposed at the lower ranges, and the structure favors downside continuation. Price remains vulnerable to deeper drawdowns as volatility compresses.
🎯 Entry:
ANY PRICE LEVEL ENTRY
(Execute based on your personal confirmation rules, premium/discount zones, or volatility triggers.)
🛡️ Stop Loss (Risk Guide):
This is the Thief SL @ 58.500 🛑
Dear Ladies & Gentlemen (Thief OG’s), kindly adjust your SL based on your own strategy, volatility preference, and personal risk model.
Note: I am not recommending that you use only my SL. You can make money and take money at your own risk.
💰 Target:
Strong support + oversold conditions + liquidity trap identified below, so kindly aim to escape with profits.
🎯 Our Target: 55.500
Note: Dear Ladies & Gentlemen (Thief OG’s), I am not recommending using only my TP. It is your own choice—you can make money and take money at your own risk.
🌍 Related Pairs to Watch (Correlation Insights)
1️⃣ Brent Crude – “UKOIL”
Often moves in the same direction as WTI due to shared global demand/supply themes.
If UKOIL breaks structure first, USOIL usually follows shortly after.
2️⃣ Natural Gas – “NATGAS”
Not directly correlated but reacts to energy-sector sentiment.
A sharp move in NATGAS can shift commodity-flow risk appetite.
3️⃣ Canadian Dollar – “USD/CAD”
CAD strengthens when oil prices rise and weakens when oil drops.
For a bearish USOIL plan, watch for USD/CAD upward pressure.
4️⃣ S&P 500 Energy Sector – “XLE”
Tracks major oil companies.
Weakness in XLE often signals upcoming pressure on crude.
5️⃣ OPEC Headlines + API/EIA Reports
Sudden supply changes or inventory spikes can trigger fast volatility.
Keep monitoring these events closely during active trades.
✅ LIKE if you find this useful!
✅ FOLLOW for daily trade plans & market insights.
✅ COMMENT your entry or adjustments below!
#TradingView #USOIL #CrudeOil #SwingTrading #DayTrading #TradingIdeas #Forex #Commodities #Bearish #RiskManagement
Let’s grow together – trade smart, stay disciplined, and engage! 💼🔥

Analysis of Core Factors in the Short-Term Oil MarketSupply Side: The oversupply situation has become a consensus, and the geo-political support has failed
- Global supply remains consistently tight: The OPEC report in November adjusted the global oil situation to be in an oversupply state. The current daily production exceeds demand by 500,000 barrels, while the previous month's estimate was a shortage of 400,000 barrels. The IEA has continuously raised the expected global crude oil supply surplus for six consecutive months, and it is predicted that in 2026, there will be a record-breaking surplus of nearly 4 million barrels per day. At the same time, the supply increase in the United States is significant. As of the week of November 21, the total number of oil drilling rigs in the United States increased to 419. The Trump administration also plans to open new drilling areas in the west coast and the Arctic. Additionally, although OPEC+ has suspended production increases in the first quarter of next year, the overall supply growth trend remains strong, making it difficult to change the oversupply situation.
- Geopolitical risks have marginally eased: There have been signals of peace talks in the Ukraine conflict. US officials stated that Ukraine has agreed to the terms of the peace agreement, with only some details yet to be finalized. Zelensky expects to "as soon as possible" visit the United States to advance the agreement. This news has weakened the geopolitical risk premium for oil. Although Russian refineries and export ports have been attacked multiple times recently, Russia can buffer through methods such as temporary storage in floating tanks, and the short-term export pressure is limited, making it difficult to have a substantive impact on supply.
Crude Oil Strategy Analysis
sell:58.5-59
tp:58-57.5
sl:59.5
Supply sideThe situation of excess has become a definite trend, with weak supporting force
- OPEC + increased production, coupled with the conclusion of supply surplus, Securities Times e-Company: The OPEC report in November changed the global oil situation from healthy to surplus. Currently, the world's oil production exceeds demand by 500,000 barrels per day, while a month ago it was estimated to be a shortage of 400,000 barrels. Although OPEC + decided to suspend production increase in the first quarter of 2026, it will still increase production by 137,000 barrels per day in December, and the continuous rounds of production increase in the past have continuously accumulated market supply pressure. At the same time, the compensation for production cuts by some oil-producing countries can slightly offset the impact of production increase, but it is difficult to change the overall surplus situation.
- Non-OPEC oil-producing countries have high production: The U.S. crude oil production remains at a high level, with the production reaching 13.862 million barrels per day in the week of November 7th. Although it has slightly declined later, it still remains at a historical high level. EIA also raised the 2026 U.S. crude oil production by 200,000 barrels per day to 13.5 million barrels per day. Its continuous production increase further intensifies the expectation of global supply surplus.
Next week's crude oil strategy analysis
sell:58-58.5
tp:57.5-57
sl:59.5

The bearish trend of crude oil has been establishedDownward revision of global crude oil demand growth expectations, weak terminal consumption
Both OPEC and IEA have lowered their 2025 demand growth expectations. IEA predicts that the annual demand will only increase by 700,000 barrels per day, the slowest growth rate since 2009. The average weekly supply of US crude oil products has decreased by 0.91% year-on-year, European diesel consumption remains sluggish, and the replenishment demand of core Asian consuming countries shows "short cycle, low intensity" characteristics, making it difficult to form a sustained support. Currently, the demand side of crude oil lacks clear growth momentum, and the mismatch between supply and demand has further intensified.
The effect of renewable energy substitution continues, squeezing the space for crude oil demand
Global wind power and photovoltaic installations continue to expand. European wind power output has returned to normal levels, and Asian photovoltaic new installations maintain high growth rates. The electricity supply gap has narrowed, leading to a reduction in crude oil replenishment demand. At the same time, the share of biofuels in the transportation sector has steadily increased, even with short-term cost fluctuations, the long-term substitution trend has not changed, further limiting the growth potential of crude oil demand.
Crude oil trading strategy
sell:58.45-58.55
tp:58.25-58.35
sl:58.15

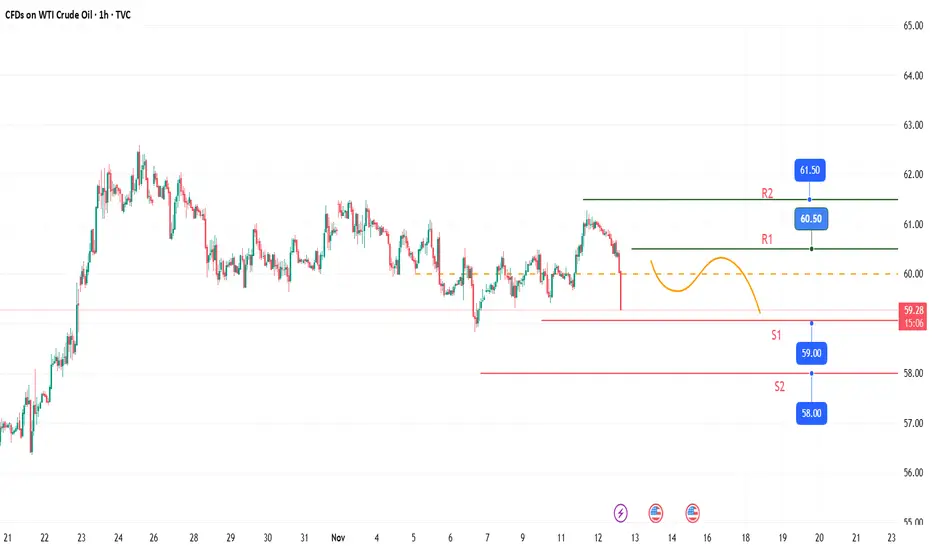
USOIL: Fluctuating declineCrude oil showed a trend of fluctuating decline today, breaking through key support levels, with a clear bearish dominance.
Key support below: In the short term, attention should be paid to the $59.00 integer mark. If this level is breached, oil prices may further drop to $58.00.
Resistance levels for rebound: If there is a technical rebound in oil prices, the first resistance level is at $60.50, and the second resistance level is at $61.50, with limited rebound space.
Trading Strategy:
Buy 59 - 59.5
SL 58.5
TP 60 - 60.5 - 61
Sell 60.5 - 61
SL 61.5
TP 59.1 - 58.5
Immediate data is negative, and inventory support has weakened. The inventory reduction process in the United States has come to an end, and the expectation of inventory accumulation is rising: The latest high-frequency data shows that the crude oil inventory in the Cushing area increased by 1.8 million barrels (to 36.8 million barrels, reaching a new high since October), ending the previous three-week reduction trend; the U.S. crude oil import volume remained at a high level of 6.1 million barrels per day, coupled with the refinery operating rate dropping from 88.6% to 86.2% (reduced profits led to a decrease in processing demand), short-term inventory accumulation pressure has emerged.
The weak signal on the demand side is clear: European diesel consumption decreased by 8% year-on-year, U.S. gasoline retail sales declined by 3.2% month-on-month, the demand for winter heating oil in the Northern Hemisphere did not start as expected (the spot price of heating oil in the New York port dropped by 5.3% in a week), and terminal demand is unable to support oil prices.
Crude Oil Trading Strategy for Today
sell:61-60.5
tp:60-59.5
sl:62
Crude Oil (WTI) Short Setup Bearish Reversal from Rising ChannelAsset: CFDs on Crude Oil (WTI)
Timeframe: 1 Hour (1H)
Pattern: Rising channel (ascending parallel channel)
Trade Type: Short (Sell) Setup
Risk/Reward: The trade is planned based on a channel breakdown, targeting a move down to the base of the move.
📊 Key Trade Levels
Type Price Level
Entry 6,709.7 – 6,711.0 (near upper channel resistance)
Stop Loss 6,762.0 – 6,762.3 (above recent highs)
Target 6,353.6 – 6,353.8 (near recent support)
🧠 Trade Rationale
Rising Channel Break: Price is currently within a rising channel, but recent candles show rejection at the upper boundary.
Fakeout Trap: There's a sketched projection suggesting a false breakout to the upside, followed by a sharp reversal into a short move.
Entry Zone: The trade is planned if price retests the upper zone (entry area), which aligns with the top of the channel.
Target Zone: The projected target is around the bottom of the channel or just below, implying a full retracement of the previous bullish leg.
Risk Management: Stop loss is placed slightly above the upper boundary to avoid getting stopped out by minor wicks.
📈 Technical Insights
Bearish Momentum Potential: If price fails to hold above the channel and re-enters with strong bearish volume, it supports a short entry.
Volume Analysis Needed: A confirmation with increasing volume on the breakdown would strengthen the setup.
Trend Reversal Signal: This setup may be hinting at a trend reversal or at least a significant pullback from the current upward trend.
✅ Conclusion
This is a high-probability short trade setup based on:
A break/retest of an ascending channel.
A potential false breakout trap.
Defined entry, stop loss, and take profit levels offering a solid risk/reward ratio.

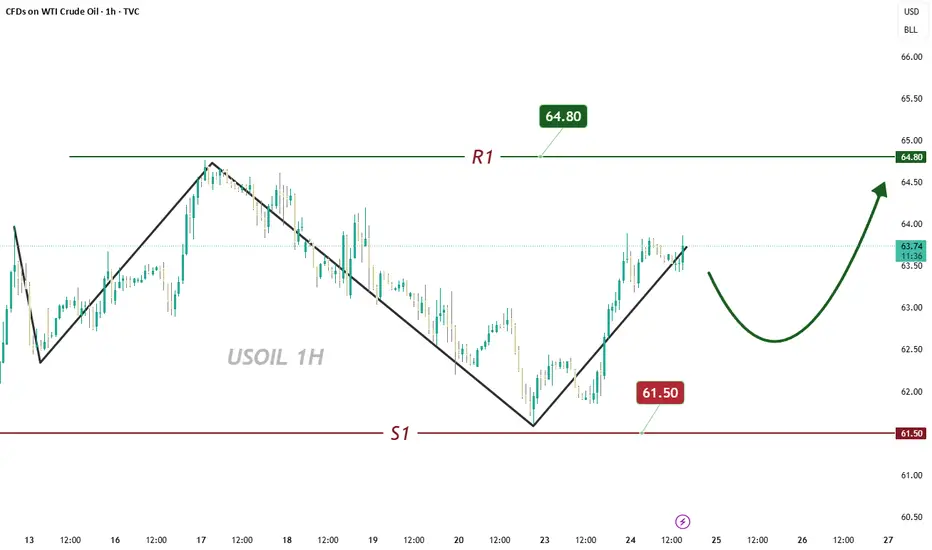
Clear Rebound Post-Pullback, Watch for 2nd Drop After a significant pullback, oil has now seen a clear rebound 📈
However, we need to watch out for a potential second pullback ⚠️ and can opt to go long at lower levels 🐂
Buy 62.2 - 62.6
TP 63.2 - 63.6 - 64.6
Accurate signals are updated daily 📈! If you encounter any issues during trading, these signals can serve as your reliable guide 🧭—feel free to refer to them anytime! I sincerely hope they’ll be of great help to you 🌟
Crude oil:short-term longCrude oil continued to rally during the US session, with a series of bullish candles on the chart. Note that short positions are not viable—focus on taking profits to break even on pullbacks. The wide ranging oscillation on the daily chart remains unchanged. The watershed for the small cycle is at 63.5, and the trend watershed is at 65.
Buy 62.5 - 62.8
TP 64 - 64.5
SL 62
Daily-updated accurate signals are at your disposal. If you run into any problems while trading, these signals serve as a reliable reference—don’t hesitate to use them! I truly hope they bring you significant assistance

US OIL SELL...Hello friends🙌
🔊As you can see, this chart works well in forming a channel, and now that
we have witnessed a price drop, the price has reached the bottom of the channel, and given the previous heavy drop, the channel shows that the power is currently in the hands of sellers and it is likely that the specified targets will move.
🔥Follow us for more signals🔥
Trade safely with us
USOIL:Narrow trading strategy
USOIL: There is no update in the past two days, because the oil price still continues to fluctuate in a narrow range, and the space for volatility is gradually reduced, which is not very different from our overall trading idea. The original long target of 65.9-66.4 can be adjusted to 65.8-66.2 with the reduction of the space for volatility. It is expected that the trend will come out this week, and we will adjust our thinking then.
Friends who do not trade at present can refer to the interval trading strategy within a day:
BUY@64.7-65
TP: 65.8 to 66.2
SELL@65.8-66.2
TP: 64.7-65
More detailed strategies and trading will be notified here ↗↗↗
Keep updated, come to "get" ↗↗↗

USOIL:Today's trading strategy
Oil prices have been sideways for the fourth trading day, volatility began to narrow, the market is brewing a new round of trend, short-term range 64-66.4. Today you can sell high and buy low around a narrow range.
Trading Strategy:
BUY@64.7-65.1
TP: 65.9-66.4
SELL: 66-66.4
TP: 65.1-64.5
More detailed strategies and trading will be notified here ↗↗↗
Keep updated, come to "get" ↗↗↗

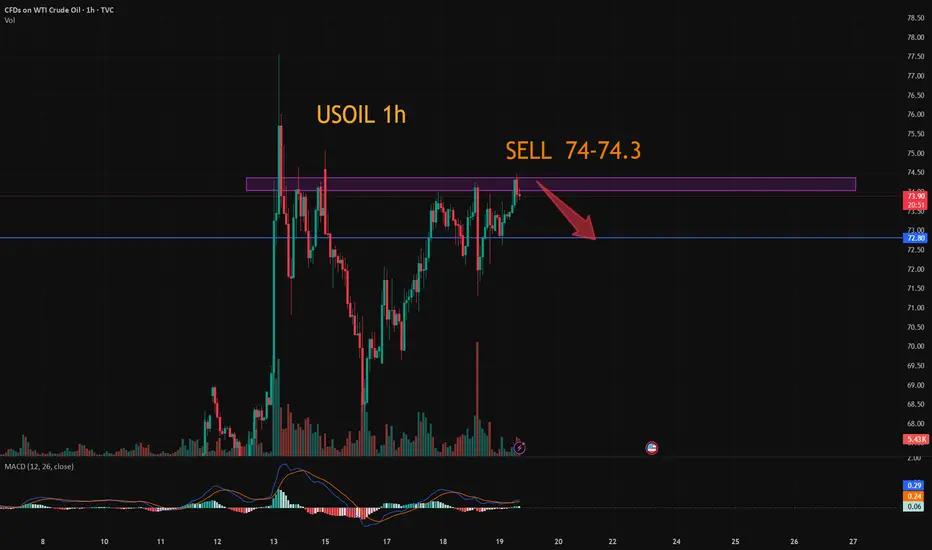
USOIL:The trading strategy of going short
USOIL: Consider shorting for now, as there are signs of a top above 74.5, but I think this is only a short-term high and will continue to surge higher. The trading idea is to sell short today and wait for the right position to be long.
Trading Strategy:
SELL@74-74.3
TP: 73.2-72.7
↓↓↓ More detailed strategies and trading will be notified here ↗↗↗
↓↓↓ Keep updated, come to "get" ↗↗↗
USOIL:Go short before you go long
The idea of crude oil is still to go long. Today, the more appropriate entry point is 72-72.3, there is still a little space at present, if you consider selling short first, then the more appropriate short point is 73-73.3 range. Give to the point to do, to wait to do more.
Trading Strategy:
SELL@73-73.3
TP: 72-72.3
BUY@72-72.3
TP: 73.7-74
↓↓↓ More detailed strategies and trading will be notified here ↗↗↗
↓↓↓ Keep updated, come to "get" ↗↗↗

USOIL 1 - Hour Chart AnalysisUSOIL 1 - Hour Chart Analysis
Key Levels
Support: ~69.50 (short - term), 67.70 (critical backup).
Resistance: 73.50 (major hurdle, tested before).
Trend, Pattern & Middle East Conflict
Price oscillates between support/resistance, with a potential “V - shaped reversal”. Middle East conflicts add high uncertainty:
Escalation: Fears of supply cuts could push price above 73.50 rapidly.
De - escalation: May pressure price down, but 67.70/69.50 still get support from lingering supply - risk worries.
Trading Strategies
Bullish: If 69.50 holds (e.g., long lower shadows/bullish candles), small - size long. Target 73.50; stop - loss ~69.20. Watch for sudden conflict news.
Bearish: If 69.50 breaks (consecutive closes below), short. Target 67.70; stop - loss ~69.80. Stay alert to conflict updates.
Note: Oil prices hinge on supply - demand, Middle East tensions, and the USD. Combine tech/fundamental analysis; manage risk strictly.
⚡️⚡️⚡️ USOil ⚡️⚡️⚡️
🚀 Buy@ 70.50 - 71.00
🚀 TP 73.00 - 74.00
Accurate signals are updated every day 📈 If you encounter any problems during trading, these signals can serve as your reliable guide 🧭 Feel free to refer to them! I sincerely hope they'll be of great help to you 🌟 👇
ULong

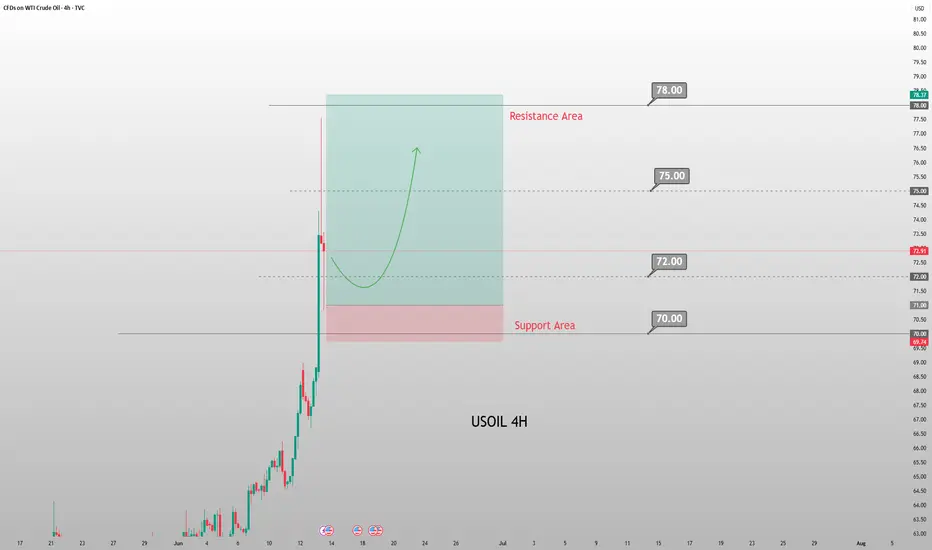
Today's Crude Oil Trend Analysis and Trading RecommendationsFrom a daily chart perspective, the violent rally in USOIL driven by external factors has completely disrupted prior technical expectations. The sharp surge has also significantly exhausted future upside potential, explaining today's gap-up and subsequent decline. With minimal likelihood of near-term de-escalation in the Iran situation, USOIL is likely to remain bullish. However, severe overbought conditions on technical charts have disrupted structural expectations, necessitating a price correction.
Technically, the $70-$75 range serves as a reasonable short-term consolidation zone, contingent on no severe escalation in Iran tensions. Given the high probability of worsening tensions, USOIL may retest $75 and even challenge $80 driven by geopolitical developments.
Thus, while the market remains focused on Iran-related risks, the short-term bias remains bullish. Avoid chasing the rally recklessly. Focus on the $70.5-$71.5 pullback zone early in the week—consider long entries only after price consolidation in this area.
USOIL
buy@70.50-71.50
tp:74-76-78
Investment itself is not the source of risk; it is only when investment behavior escapes rational control that risks lie in wait. In the trading process, always bear in mind that restraining impulsiveness is the primary criterion for success. I share trading signals daily, and all signals have been accurate without error for a full month. Regardless of your past profits or losses, with my assistance, you have the hope to achieve a breakthrough in your investment.

Next Week's Crude Oil Trend Analysis and Trading RecommendationsThe continued escalation of geopolitical tensions in the Middle East remains the core driver propelling oil prices higher. With U.S.-Iran relations at a critical juncture and the Ukrainian attack on the Crimean Bridge exacerbating the Russia-Ukraine conflict, markets are increasingly concerned about potential disruptions to Black Sea crude exports. As a key channel for 2% of global crude oil supplies, risks to Black Sea exports directly threaten supply chain security, triggering a surge in short-term market risk aversion and driving oil prices sustainably higher.
Since crude oil broke through the $64.8 resistance level with a solid candlestick last week, we have maintained a consistent bullish stance. After two weeks of consolidative oscillations, prices finally broke free from the trading range, fully demonstrating the dominance of bullish momentum. When oil prices pulled back to the $71.5–$72.0 range last Friday, we once again emphasized the short-term long strategy, which was subsequently followed by a sharp rally catalyzed by news developments. With the current trend clearly defined, we advise trading in line with the momentum: short-term long positions can be initiated above $71.0 at the start of the week.
USOIL
buy@71-72
tp:75-78
Investment itself is not the source of risk; it is only when investment behavior escapes rational control that risks lie in wait. In the trading process, always bear in mind that restraining impulsiveness is the primary criterion for success. I share trading signals daily, and all signals have been accurate without error for a full month. Regardless of your past profits or losses, with my assistance, you have the hope to achieve a breakthrough in your investment.
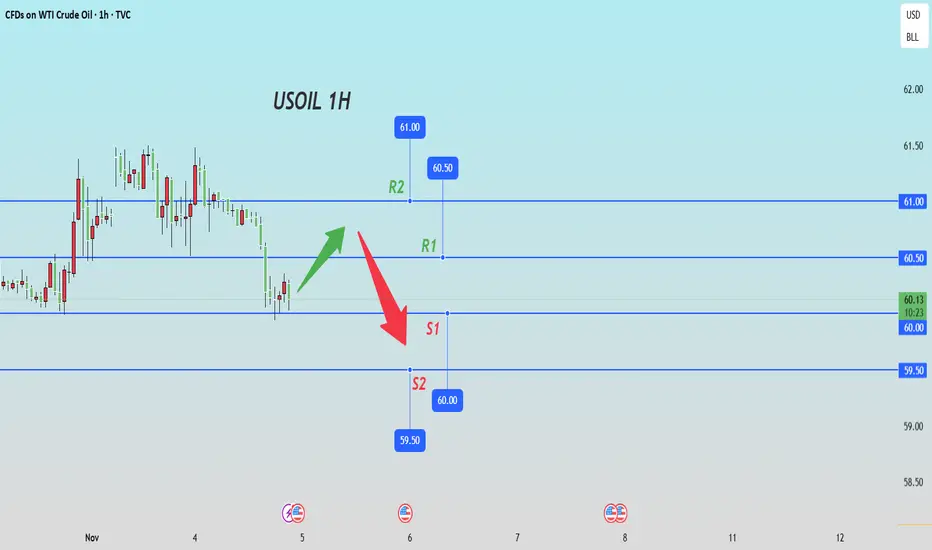
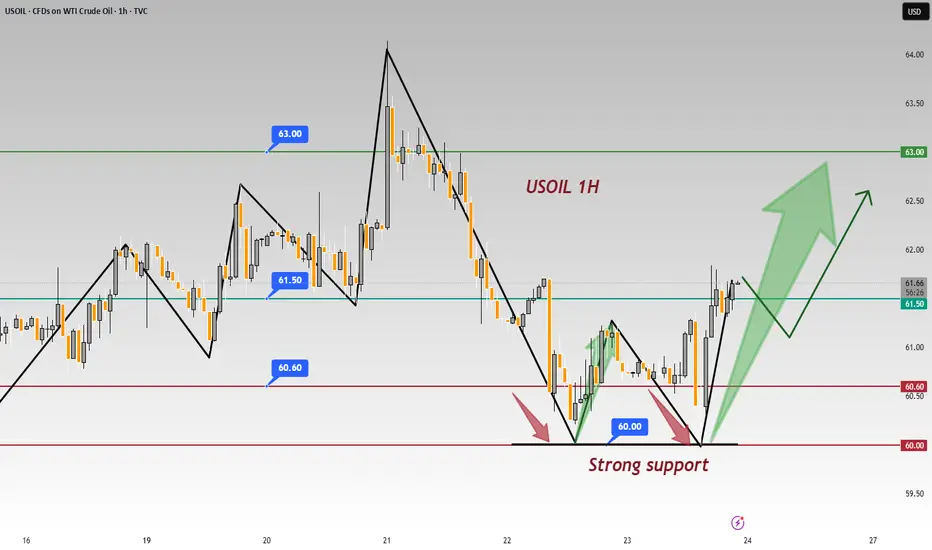
In - depth: USOIL 1 - hr Chart - Significance of 60.00 Support In the USOIL 1 - hour chart, 60.00 acts as a strong support 💪.
Support Validation
The price twice failed to break 60.00 and rebounded 📈. Psychologically, investors see 60.00 as a key level 🔑. Approaching it, buy orders pour in as they think crude oil is undervalued 📉. Technically, it's on a support line from prior lows, and repeated tests have fortified its support 🛡️.
⚡️⚡️⚡️ USOil ⚡️⚡️⚡️
🚀 Buy@ 60.00 - 60.60
🚀 TP 62.50 - 62.80
Accurate signals are updated every day 📈 If you encounter any problems during trading, these signals can serve as your reliable guide 🧭 Feel free to refer to them! I sincerely hope they'll be of great help to you 🌟 👇
Crude oil: 63.00 resistance & 60.00 support keyPrices are currently testing the upper resistance at $63.00 📈. These levels are suppressing the price 🔻. A decisive breakthrough above this level may trigger a more intense upward rally 🔥. Meanwhile, recent selling pressure has pushed the price down to $60.60 📉. Watch the pivot support at $60.00, the real downward target 🎯
Crude oil surplus expanded in April, and imports increased, reaching multi - month highs from some countries 🌍. If global benchmark oil prices rise in the future, purchases may be reduced 📉.
Crude oil fell first and then rose today 📊. After a deep dive to $60.9, it stabilized and started to rise 🔼. After the previous price increase and adjustment, it remains to be seen if the upward momentum will continue and break through upwards 🔍.
Overall, on the delivery day, oil prices are volatile 🔼🔽. Watch the resistance at $63.0 on the upside and the support at $60.60 - $60.0 on the downside 👀.
⚡️⚡️⚡️ USOil ⚡️⚡️⚡️
🚀 Sell@ 62.50 - 62.30
🚀 TP 61.50 - 60.60
Accurate signals are updated every day 📈 If you encounter any problems during trading, these signals can serve as your reliable guide 🧭 Feel free to refer to them! I sincerely hope they'll be of great help to you 🌟 👇

Summary of the Crude Oil Market This WeekThis week, the crude oil market witnessed a significant decline. Brent crude oil dropped by a cumulative 8.3%, and WTI crude oil fell by 7.5%. Both recorded their largest single-week declines since the end of March.👉👉👉
OPEC+ convened a production meeting ahead of schedule and planned to discuss the production increase plan for June. The market bets that the probability of a production increase is as high as 70%. Previously, OPEC+ unexpectedly announced in April that it would increase daily production by 411,000 barrels starting from May, which is three times the original planned increase. This move aimed to punish member states that had overproduced oil. If production is further increased in June, it will further intensify the supply pressure on the market.
Although the geopolitical tensions in the Middle East region have intensified, such as the postponement of the fourth round of nuclear negotiations between the United States and Iran, which has, to a certain extent, provided support for oil prices, judging from the overall market situation this week, this supporting effect has failed to offset the impact of increased supply and decreased demand.
Overall, this week, under the intertwined influence of factors such as increased supply, uncertain demand prospects, and changes in the geopolitical situation, the crude oil market showed a significant downward trend. The market's expectations for crude oil prices are rather pessimistic, and it is expected that crude oil prices will still face certain downward pressure in the coming period. However, if OPEC+ changes its production increase plan, or if there is an unexpected improvement in the global economy, crude oil prices may rebound.


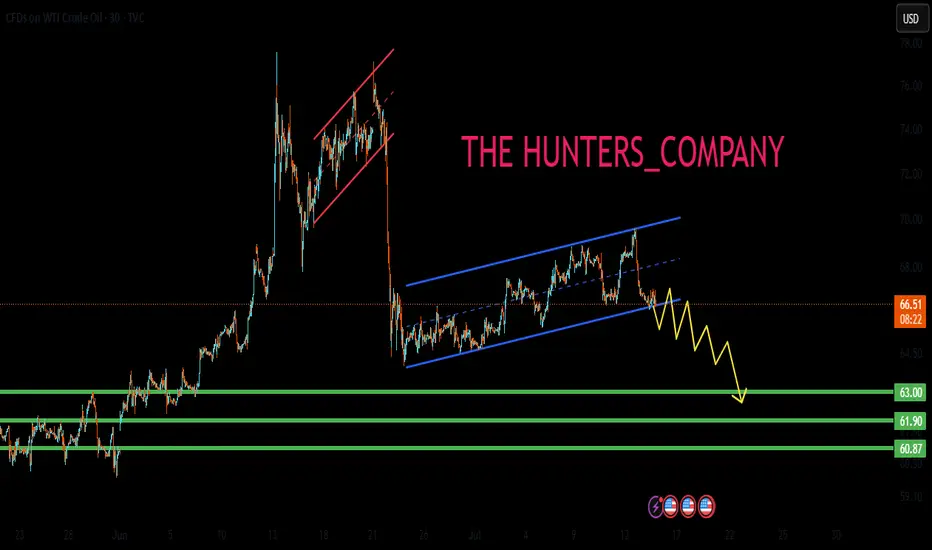
Bullish on USOILAs the chart shows, in the 1 - hour timeframe, USOIL is in an upward - trending channel 📈. The price fluctuates upwards between two trendlines. Despite pullbacks, the uptrend persists, suggesting short - term bullish dominance. Still, the frequent swings reveal ongoing bull - bear market battles.📈
⚡⚡⚡ USOIL ⚡⚡⚡
🚀 Buy@61.5 - 62.0
🚀 TP 63.5 - 65.0
Accurate signals are updated every day 📈 If you encounter any problems during trading, these signals can serve as your reliable guide 🧭 Feel free to refer to them! I sincerely hope they'll be of great help to you 🌟
