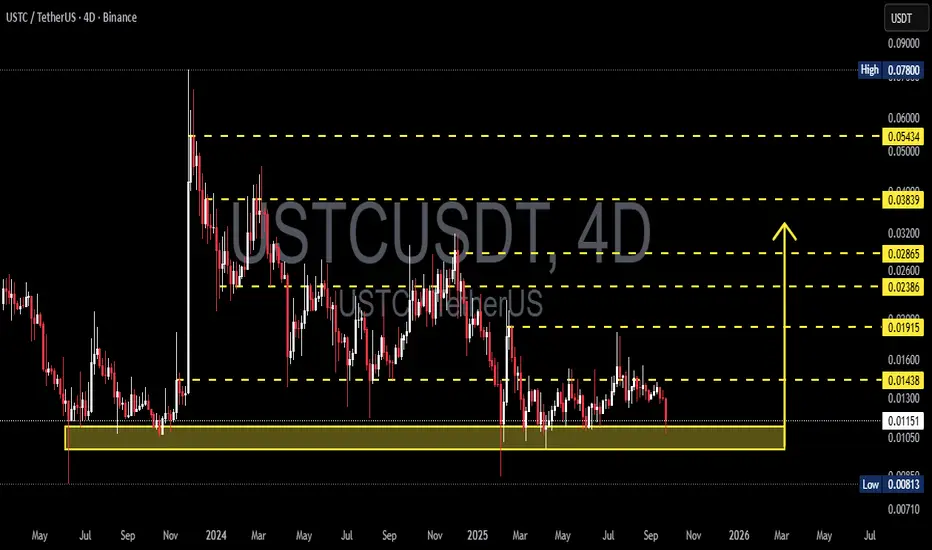
USTC/USDT — Key Demand Zone: Rebound or Breakdown Toward?USTC is once again trading at a crucial demand zone (0.0105 – 0.0115 USDT) on the 4D chart (Binance). This area has repeatedly acted as a strong support since 2024, absorbing heavy selling pressure and triggering notable rebounds.
This zone is not just a normal support — it’s an accumulation area that has historically sparked strong bounces. Long downside wicks confirm liquidity sweeps, followed by quick recoveries, signaling active demand around this region.
---
🔎 Structure & Pattern
1. Range / Sideways Accumulation
Price is moving within a wide range between this demand zone and layered resistances above, showing mid-term accumulation before a bigger move.
2. Lower Highs after Spikes
Each strong rally has failed to break above major resistance, forming lower highs and signaling persistent supply pressure.
3. Liquidity Sweeps
Multiple fake breaks below support (long wicks) indicate liquidity grabs, where stop losses are triggered before price returns inside the range.
---
🚀 Bullish Scenario
If the 0.0105 – 0.0115 support zone holds:
Confirmation comes from a bullish rejection candle (pin bar / engulfing) on the 4D timeframe.
Upside targets:
🎯 0.01438 (nearest resistance)
🎯 0.01915 (mid resistance)
🎯 0.02386 – 0.02865 if momentum expands further
Logic: Repeated defense of this zone suggests accumulation, with potential for short covering and fresh buying that can drive price back into mid-range resistances.
---
⚠️ Bearish Scenario
If 0.0105 breaks on a 4D close:
Breakdown would confirm weakness → likely downside to 0.00813 (historical low).
A move below this level may open the door for deeper bearish continuation.
Logic: Many stops are placed below this zone. A breakdown with strong volume could trigger panic selling and accelerate bearish pressure.
---
📌 Key Levels
Main Support: 0.0105 – 0.0115
Layered Resistances: 0.01438 → 0.01915 → 0.02386 → 0.02865 → 0.03839 → 0.05434
---
🎯 Conclusion
USTC is standing at a decision point:
Holding above 0.0105–0.0115 may trigger a rebound toward 0.01438 and 0.01915 with attractive risk-to-reward potential.
A confirmed breakdown below 0.0105 opens room toward 0.00813 and possibly lower.
Wait for a clear 4D close and volume confirmation before committing to either side.
---
#USTC #USTCUSDT #CryptoAnalysis #Altcoins #SupportResistance #ChartPattern #TechnicalAnalysis #CryptoUpdate #BullishOrBearish
Ustcidea
USTCUSDT 4D AnalysisUSTC ~ 4D Analysis
#USTC This trade is very high risk. Buy if you still have confidence in this coin. With a short term target of at least 15%++

USTCUSDT Forming Bullish WaveUSTCUSDT is currently displaying a bullish wave pattern, indicating the formation of a higher low structure that typically leads to strong continuation moves. This pattern, combined with increasing volume, suggests growing investor interest and the potential for a significant upside move. Technically, the pair looks well-positioned to achieve a breakout, with projected gains estimated between 40% to 50%+, making this a highly attractive opportunity for both short-term traders and long-term investors.
The current wave formation reflects healthy market behavior, with each pullback being met by strong buying pressure — a clear sign of accumulation. As momentum builds, USTCUSDT could target higher resistance levels quickly, particularly if broader market sentiment remains favorable. Traders watching this pair should pay close attention to volume spikes and confirmation candles, which will signal the start of a possible breakout move.
On a fundamental level, renewed activity surrounding algorithmic stablecoin narratives and the legacy of Terra projects has brought USTC back into the spotlight. While still a controversial asset for some, speculative interest has been surging, especially from traders seeking high-volatility setups. This resurgence in trading activity has helped lift volume and build technical structures with bullish potential.
If USTCUSDT maintains its current trajectory and continues to respect the bullish wave formation, we could see a rapid price acceleration. The blend of technical momentum, increasing trading volume, and market speculation presents a prime setup for explosive gains in the coming sessions.
✅ Show your support by hitting the like button and
✅ Leaving a comment below! (What is You opinion about this Coin)
Your feedback and engagement keep me inspired to share more insightful market analysis with you!

USTCUSDT 1D Analysis USTC ~ 1D Analysis
#USTC Buy after successfully breaking through this resistance line with a short-term target of at least 15%++ from here.

USTCUSDT 4D Analysis USTC ~ 4D Analysis
#USTC This trade is very high risk
Buy gradually if you still have confidence in this coin with a short term target of at least 10%+.

USTC trade planUSTC trade plan
USTC/USDT is not going to break this range resistance in one attempt. A 15-30% drop is coming.
key points
- strong resistance holding
- expecting a rejection and pullback
- risk is under your control, manage accordingly
- not financial advice, do your own research
trade wisely, stay disciplined

Long Idea on $USTC this coin is very cleverly manipulated, it's hard to tell when it's down or up. In my opinion, the point of cancellation is the base of the pump from 0.015 or 0.0018 if we go lower, not very good. if it holds as now, then only long. I know the risk, the profit is big, but the stop is very wide, keep this in mind when entering with a big shoulder. Optimally, 1x is the amount that can be lost in any case. There is a chance that this coin will be 1$ and this is even more profit. From the technical side, the instrument had an accumulation that lasted 1.5 years (that's a lot). Another disclaimer: I don't know how it will be, this is purely my opinion
