Falling towards pullback support?USTEC is falling towards the pivot and could bounce to the 1st resistance.
Pivot: 25,801.30
1st Support: 25,361.85
1st Resistance: 26,481.54
Disclaimer:
The opinions given above constitute general market commentary and do not constitute the opinion or advice of IC Markets or any form of personal or investment advice.
Any opinions, news, research, analyses, prices, other information, or links to third-party sites contained on this website are provided on an "as-is" basis, are intended to be informative only, and are not advice, a recommendation, research, a record of our trading prices, an offer of, or solicitation for, a transaction in any financial instrument and thus should not be treated as such. The information provided does not involve any specific investment objectives, financial situation, or needs of any specific person who may receive it. Please be aware that past performance is not a reliable indicator of future performance and/or results. Past performance or forward-looking scenarios based upon the reasonable beliefs of the third-party provider are not a guarantee of future performance. Actual results may differ materially from those anticipated in forward-looking or past performance statements. IC Markets makes no representation or warranty and assumes no liability as to the accuracy or completeness of the information provided, nor any loss arising from any investment based on a recommendation, forecast, or any information supplied by any third party
Ustec

EU “sell America” risks are weighing on the US big-techs.
Risk appetite deteriorated amid intensified geopolitical tensions over Greenland, pressuring tech shares. Trade-war concerns have resurfaced, reviving fears that Europe could reduce exposure to US assets, while a spike in Japanese yields driven by fiscal expansion concerns added further pressure on US equities.
Mike Wilson, CIO at Morgan Stanley, warned that if the European Union activates its Anti-Coercion Instrument and targets the services sector, US Big Tech stocks could face meaningful headwinds.
USTEC broke below the ascending trendline and slipped to around 24930. Converging EMAs indicate a potential shift toward a bearish trend. If USTEC breaks below the support at 24930, the index may retreat toward the next support at 24600. Conversely, if USTEC breaches above the immediate resistance at 25300 and the trendline, the index may advance toward the following resistance at 25600.

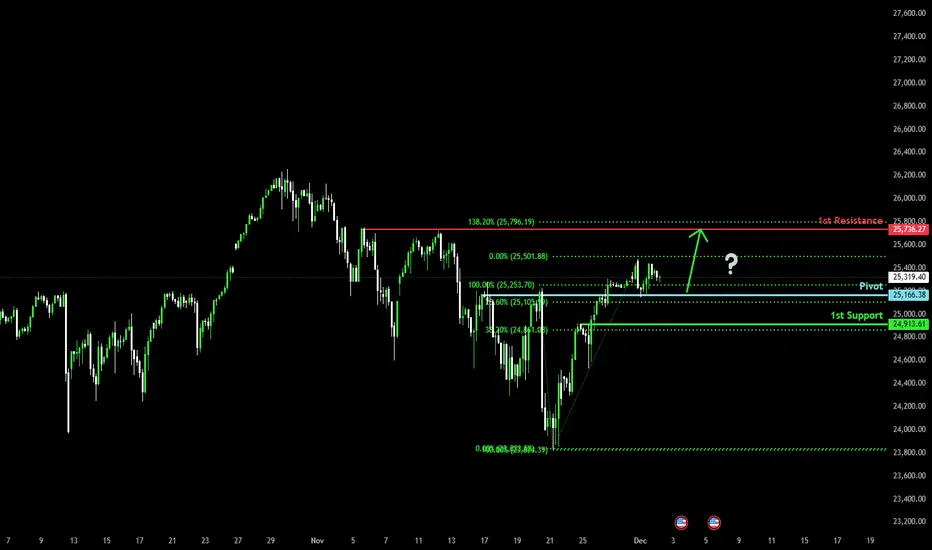
Bullish continuation setup?USTEC has bounced off the pivot and could potentially rise to the 1st resistance.
Pivot: 25,166.38
1st Support: 24,913.61
1st Resistance: 25,736.27
Disclaimer:
The opinions given above constitute general market commentary and do not constitute the opinion or advice of IC Markets or any form of personal or investment advice.
Any opinions, news, research, analyses, prices, other information, or links to third-party sites contained on this website are provided on an "as-is" basis, are intended to be informative only, and are not advice, a recommendation, research, a record of our trading prices, an offer of, or solicitation for, a transaction in any financial instrument and thus should not be treated as such. The information provided does not involve any specific investment objectives, financial situation, or needs of any specific person who may receive it. Please be aware that past performance is not a reliable indicator of future performance and/or results. Past performance or forward-looking scenarios based upon the reasonable beliefs of the third-party provider are not a guarantee of future performance. Actual results may differ materially from those anticipated in forward-looking or past performance statements. IC Markets makes no representation or warranty and assumes no liability as to the accuracy or completeness of the information provided, nor any loss arising from any investment based on a recommendation, forecast, or any information supplied by any third party.
US500 retreated on a hawkish Fed shift and a tech-sector fall
September nonfarm payrolls rose by 119k (cons. 51k), but August was sharply revised down to -4k from 22k, while continuing jobless claims increased by 28k from the prior week. The unemployment rate climbed to 4.4% (prev. 4.3%, cons. 4.3%), the highest in four years, further weighing on sentiment.
Fed commentary added to the pressure. Cleveland Fed President Mester noted that, despite signs of labor-market cooling, inflation remains elevated. Chicago Fed President Goolsbee also cautioned that inflation has not yet reached the 2% target, signalling reluctance toward additional rate cuts.
Today’s PMI and consumer expectations data will be key indicators of current US economic conditions.
US500 broke below the lower boundary of the ascending channel, extending its sharp decline. The diverging bearish EMAs indicate a potential continuation of the downtrend.
If US500 breaks below 6500, the index could retreat toward the next support at 6430.
Conversely, if US500 closes above 6650, where EMA21 intersects, the index may advance toward the following resistance at 6700.

AI-bubble fears dragged USTEC lower.
Alphabet (GOOGL) CEO Sundar Pichai added to the cautious mood, noting that the current AI boom shows signs of irrationality and warning that no company would be immune if the bubble bursts.
Meanwhile, ADP data showed private-sector jobs falling by roughly 2.5k per week over the four weeks to Nov 1, fueling worries about a labor-market slowdown. Fed Governor Waller reiterated his support for a December rate cut, citing ongoing softness and stagnation in the labor market.
This week’s NFP release may shape expectations for further Fed easing and add to market volatility.
USTEC extended its downtrend, breaking below 24525. The diverging bearish EMAs indicate a potential expansion of the bearish structure.
If USTEC breaks below 24300, the index could decline further toward the next support at 24000.
Conversely, if USTEC closes back above 24525, the index may advance toward the next resistance at 25200.

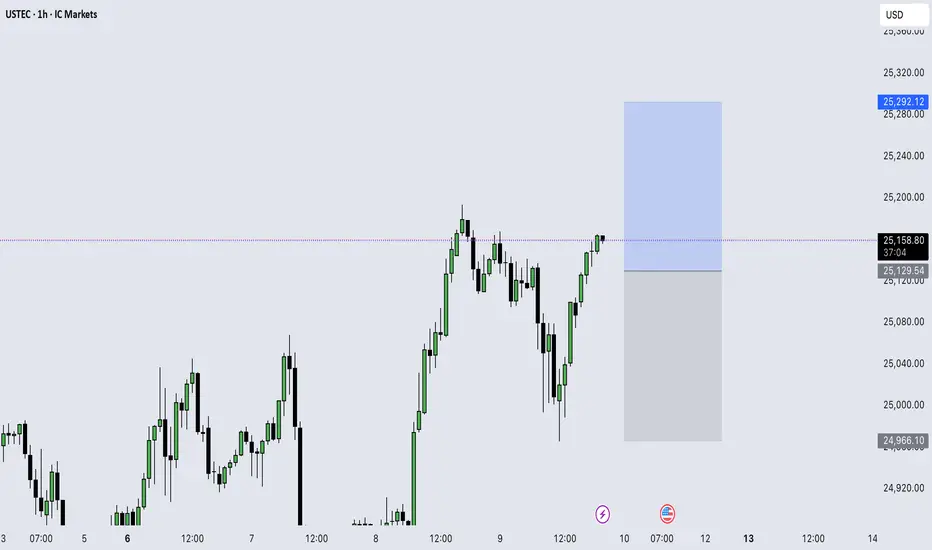
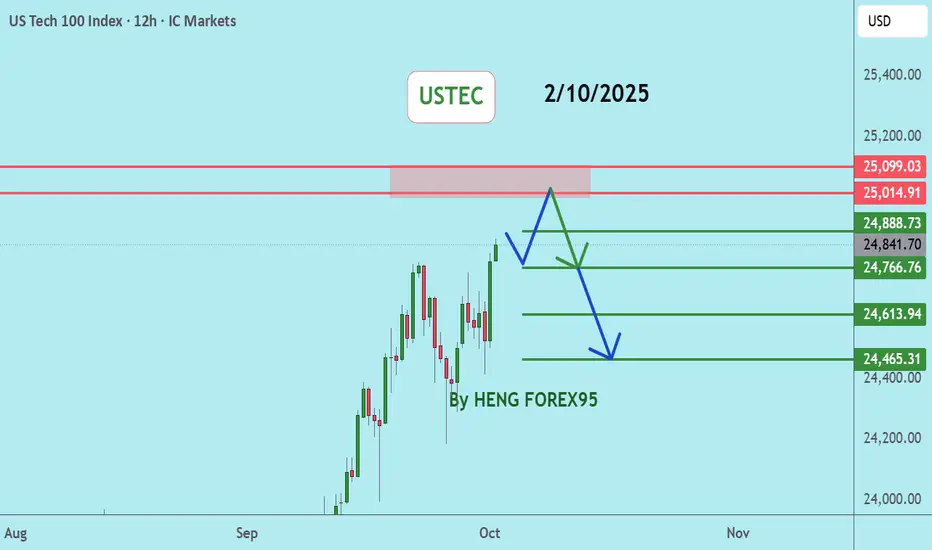
USTECUSTEC price is in the resistance zone 25237-25264. If the price cannot break through the 25264 level, it is expected that the price will likely go down in the short term. Consider selling in the red zone.
🔥Trading futures, forex, CFDs and stocks carries a risk of loss.
Please consider carefully whether such trading is suitable for you.
>>GooD Luck 😊
❤️ Like and subscribe to never miss a new idea!

Exness: The Convergence of Tech GiantsThe initial phase of the artificial intelligence (AI) rebound was driven by narrative and momentum; merely being associated with AI was enough to push up valuations. Now, we are entering a more mature phase where investors will demand tangible results and will penalize specific strategic missteps or unmitigated risks.
Although the AI theme remains dominant, news from specific companies is now triggering significant and differentiated reactions. For example, Apple is adjusting its entire AR/VR strategy due to product-specific difficulties, while Meta is grappling with an existential regulatory battle unrelated to its AI development. This differentiation means the market is beginning to distinguish between "AI beneficiaries" and "AI players who need to prove themselves."
Simply being among the "Magnificent Seven" is no longer enough; companies must now demonstrate their ability to navigate their unique challenges—be they competitive, regulatory, or operational.
Therefore, the next phase of the Nasdaq 100's performance will depend on how these individual giants execute their specific strategies, making company-level analysis more critical than ever.
NVIDIA's AI Empire: Solidifying the Moat or Building a House of Cards?
Nvidia recently announced a strategic cooperation intent, planning to invest up to $100 billion in OpenAI. This investment is closely linked to the deployment of at least 10 gigawatts of Nvidia systems, aimed at supporting OpenAI's next-generation AI infrastructure, with the first phase using its Vera Rubin platform by 2026. This is not just an investment; it's a self-reinforcing business cycle. Nvidia provides funding to OpenAI, and OpenAI then uses these funds to purchase Nvidia's core products (GPUs, networking systems), thereby effectively securing a large and long-term order channel, injecting strong momentum into both parties' revenue growth.
However, this arrangement has also drawn critical perspectives, arguing that it constitutes "The Infinite Money Glitch." Analysts have compared it to Cisco Systems' practices during the dot-com bubble, when Cisco provided funding to telecom companies to purchase its routers, a strategy that amplified the subsequent market collapse.
The risk is that Nvidia may be artificially inflating its own demand, which would make it very vulnerable if the AI capital expenditure boom slows down or OpenAI's business model encounters problems.
This investment can also be seen as a defensive move, aimed at preventing OpenAI from developing its own custom chips or deepening its cooperation with competitors like Broadcom, with whom OpenAI has already signed a $10 billion order.
Apple's Pragmatic Shift: From Vision to Sight
Recent reports confirm that Apple is pausing its planned overhaul of the Vision Pro headset to reallocate resources and accelerate the development of AI-powered smart glasses. The logic behind this strategic shift is that the Vision Pro, launched in February 2024, has struggled to maintain sales momentum due to its high price of $3,499, physical weight, and limited content ecosystem, leading to waning consumer interest.
This shift is a pragmatic admission by Apple that the path to the mass market lies in a different product form factor. According to the new roadmap, Apple is reportedly developing at least two models: a simpler display-less version (N50) that connects to the iPhone, and a more advanced version with an integrated display that directly competes with Meta's products. The development timeline is being accelerated, with a possible release as early as next year.
This strategic shift is less about abandoning spatial computing and more about finding a viable mass-market vehicle to counter its "AI laggard" label and establish a new, Apple-controlled AI platform.
Despite the launch of "Apple Intelligence," Apple is still widely considered to be playing catch-up in the generative AI field compared to Google and OpenAI.
Meta's Ambitious: Software to hardware while defending the core.
In this race, Meta is clearly in the lead. It has collaborated with Ray-Ban to launch multiple generations of smart glasses, and has introduced the $800 Ray-Ban Display, its first consumer model with a built-in screen. They are setting the pace, forcing Apple to react. However, at the same time, Meta's core advertising business is facing unprecedented and escalating legal attacks in the EU. This includes a €550 million lawsuit filed by over 80 Spanish media organizations, accusing it of unfair competition; similar lawsuits exist in France; and its "consent or pay" model faces fundamental challenges under GDPR and the Digital Services Act (DSA).
Meta's aggressive push in smart glasses and the metaverse is not just a pursuit of new growth, but a strategic necessity driven by the existential threat to its underlying advertising business model. Meta's primary revenue and profit engine – personalized advertising based on user data – is facing fundamental, systemic challenges in one of its largest markets (the EU). This regulatory pressure creates a powerful incentive for it to develop new platforms (such as smart glasses operating systems) where Meta can control the ecosystem, set data collection rules, and build new, diversified revenue streams (e.g., hardware sales, AR app stores).
Therefore, succeeding in this new hardware race is not only an offensive growth strategy, but also a crucial defensive move to reduce the company's reliance on a business model that is increasingly untenable from a regulatory perspective.
Microsoft's Quiet Restructuring for the Future of its AI Center
Microsoft has undergone a major internal reorganization to strengthen its focus on AI. This includes the appointment of Judson Althoff as CEO of the commercial business, a move explicitly aimed at allowing CEO Satya Nadella to focus on high-level technical work in AI, data center architecture, and product innovation. Meanwhile, the company has for the first time since 2018 unified its Windows engineering division under one leader, Pavan Davuluri. The clear goal is to accelerate the realization of Windows as an "Agentic OS" – an AI-driven operating system that can proactively perform tasks for users.
Microsoft's strategy is fundamentally different from Apple's and Meta's. Instead of chasing new consumer hardware categories, Microsoft is doubling down on its existing enterprise and operating system strongholds, deeply integrating AI into the fabric of its core products to increase user engagement and drive consumption within its ecosystem. Recent news from Microsoft is not about novel gadgets, but about organizational structure and a long-term operating system vision. The changes in commercial leadership are to optimize the sales process for AI-enhanced enterprise services (such as Azure AI and Microsoft 365 Copilot). The changes in Windows are to redefine the core PC experience in the age of AI.
This is a lower-risk, more defensive strategy. They are not trying to create a new market from scratch, but rather are using AI to fortify their existing multi-trillion-dollar enterprise and consumer software moats. The measure of Microsoft's success will not be hardware sales units, but rather Azure consumption growth, Copilot subscription numbers, and increased enterprise license value.
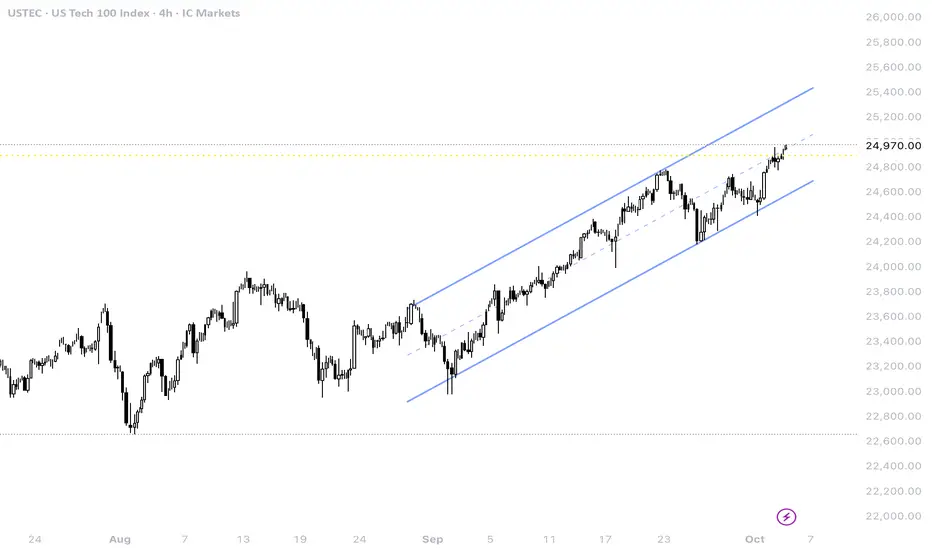
USTEC reached the 100% Fibonacci Extension at around 24955 before retracing. The index awaits a potential breakout from the range of 24800-24955.
If USTEC breaks above 24955, the index may test the 161% Fibonacci Extension at around 25265.
Conversely, returning below 24700-24800 may lead to a retest of EMA21 and the channel’s lower bound.
Combining the above analysis, the performance of the Nasdaq 100 index will be the ultimate resultant force of these competing powers. This ecosystem is interconnected: Nvidia's ability to execute its large-scale infrastructure construction is the foundation for the AI ambitions of companies like Microsoft and Meta. The success of Apple's and Meta's hardware battle will define the next major consumer computing platform and create new ecosystems. Microsoft's solid position in the enterprise sector provides a stabilizing force, while Meta's regulatory battles in Europe remain the most significant idiosyncratic risk facing a major component of the index.
This is not a prediction, but a guide to what matters most in the coming quarters:
For Nvidia: Track gross margins for its Blackwell and upcoming Vera Rubin platforms and any comments on pricing power. Watch for any official regulatory investigations initiated by the US or EU regarding its partnership with OpenAI and its ecosystem impact.
For Apple and Meta: Sales data in the first 6-12 months after the launch of any new smart glasses, and more importantly, user engagement metrics will be crucial. The quality and capability of Apple's revamped Siri (Project Linwood) upon full release will be a key leading indicator of its AI competitiveness.
For Meta (EU): Rulings in media lawsuits in Spain and France will be key (the trial in Spain is scheduled for October 2025). Any decision invalidating the "consent or pay" model would force a fundamental restructuring of its European operations and could have significant financial implications.
For the Macro Environment: Monthly non-farm payroll reports are key data points. A sustained trend below expectation would significantly increase the probability of a recession and could outweigh the positive sentiment from potential interest rate cuts, shifting market focus from valuation support to fundamental earnings risk.
By Eric Chia, Financial Market Strategist at Exness
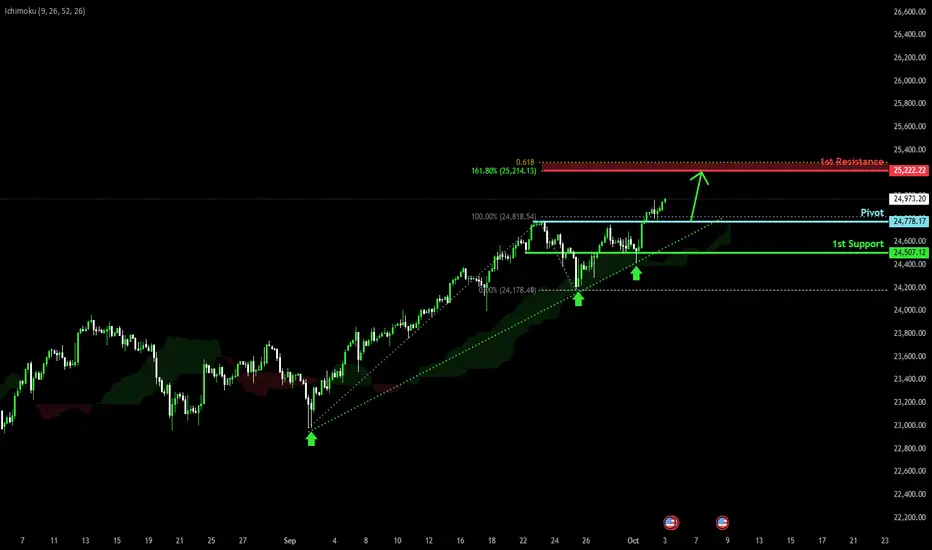
Bullish continuation?USTEC has bounced off the pivot which is a pullback support and could potentially rise to the 1st resistance.
Pivot: 24,778.17
1st Support: 24,507.12
1st Resistance: 25,222.22
Disclaimer:
The above opinions given constitute general market commentary, and do not constitute the opinion or advice of IC Markets or any form of personal or investment advice.
Any opinions, news, research, analyses, prices, other information, or links to third-party sites contained on this website are provided on an "as-is" basis, are intended only to be informative, is not an advice nor a recommendation, nor research, or a record of our trading prices, or an offer of, or solicitation for a transaction in any financial instrument and thus should not be treated as such. The information provided does not involve any specific investment objectives, financial situation and needs of any specific person who may receive it. Please be aware, that past performance is not a reliable indicator of future performance and/or results. Past Performance or Forward-looking scenarios based upon the reasonable beliefs of the third-party provider are not a guarantee of future performance. Actual results may differ materially from those anticipated in forward-looking or past performance statements. IC Markets makes no representation or warranty and assumes no liability as to the accuracy or completeness of the information provided, nor any loss arising from any investment based on a recommendation, forecast or any information supplied by any third-party.
USTEC, NASDAQNasdaq price is still in a strong uptrend, there is a chance to test the 25014-25124 level. If the price cannot break through the 25124 level, it is expected that the price will have a chance to go down. Consider selling in the red zone.
🔥Trading futures, forex, CFDs and stocks carries a risk of loss.
Please consider carefully whether such trading is suitable for you.
>>GooD Luck 😊
❤️ Like and subscribe to never miss a new idea!
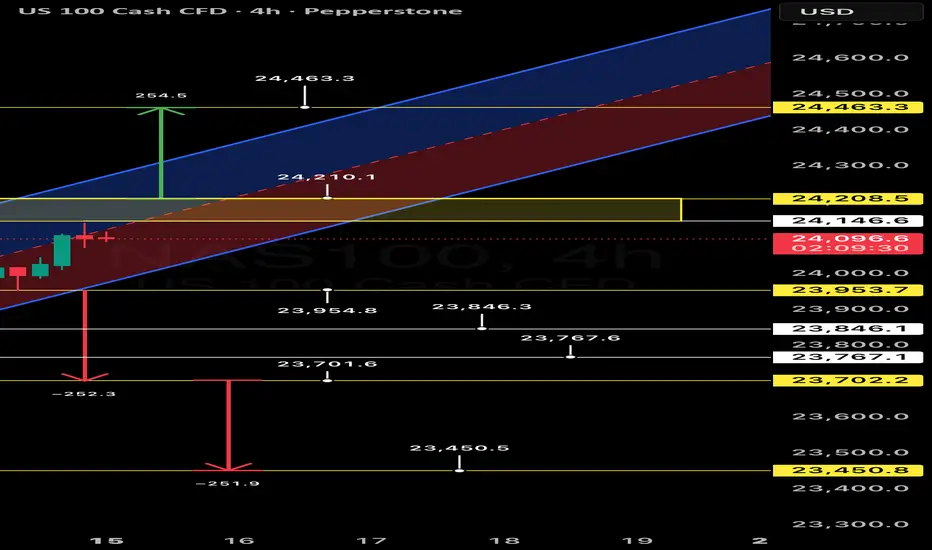
NASDAQ 100: A Tipping Point on the 4H ChartKey Takeaway
NASDAQ 100 (NAS100) is at a critical juncture, hovering at a potential inflection point around the 24,000 level. A clear breakout above or breakdown below this psychological and technical area will likely dictate the next major move for the index, presenting distinct opportunities for both bulls and bears.
Macro View
NASDAQ 100 has been in a strong rising trend channel for the medium to long term, indicating persistent investor optimism. The overall technical outlook remains positive. However, recent price action on the 4hour chart suggests a period of indecision, with the index consolidating just below its recent highs. This consolidation, combined with the emergence of a potential head and shoulders pattern, signals that a significant move is imminent.
Bearish Outlook: A Breakdown Scenario
A breakdown below the key support level at 23,800 would be a significant bearish signal. This level is crucial as it marks the lower boundary of the current consolidation zone.
• Target 1: 23,700 A move below the first key support could quickly see the index test the 23,700 level, which has acted as a previous point of interest.
• Target 2: 23,450 A break of the 23,700 support would confirm a deeper correction, with the next major target being 23,450. This level coincides with a significant volume node and previous support, making it a strong magnet for price.
Risk Management: A stoploss should be placed just above the resistance to mitigate risk in a false breakdown.
Bullish Outlook: A Breakout Scenario
The bullish case is contingent on the index successfully holding the 24,000 psychological level and breaking above the key resistance at 24,208.5.
• Target 1: 24,463 A confirmed breakout would likely propel the index toward the upper boundary of the rising channel, with a primary target of 24,463. This level represents a key extension of the current trend.
• Target 2: 24,600 A decisive move beyond 24,463 would suggest a continuation of the bullish momentum, with a secondary target at 24,600. This level aligns with a major extension and could see the index set new all-time highs.
Risk Management: A stop loss should be placed just below the support to protect against a trend reversal.
Conclusion
NASDAQ 100 is at a pivotal moment. Traders should watch for a clear break in either direction before entering a position. The 24,000 level is a critical pivot, and the ensuing price action will provide a clear roadmap for the market's next move.
US equities advanced despite concerns over Fed independence
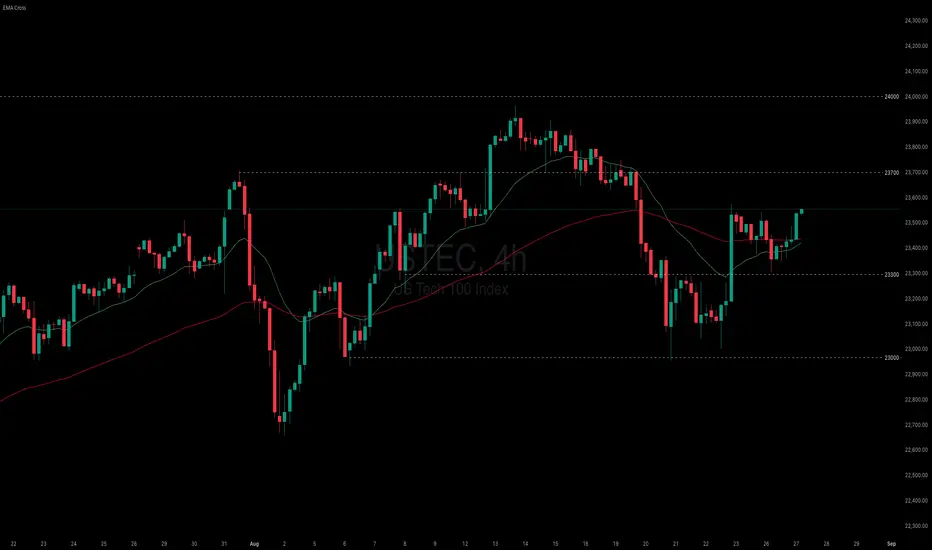
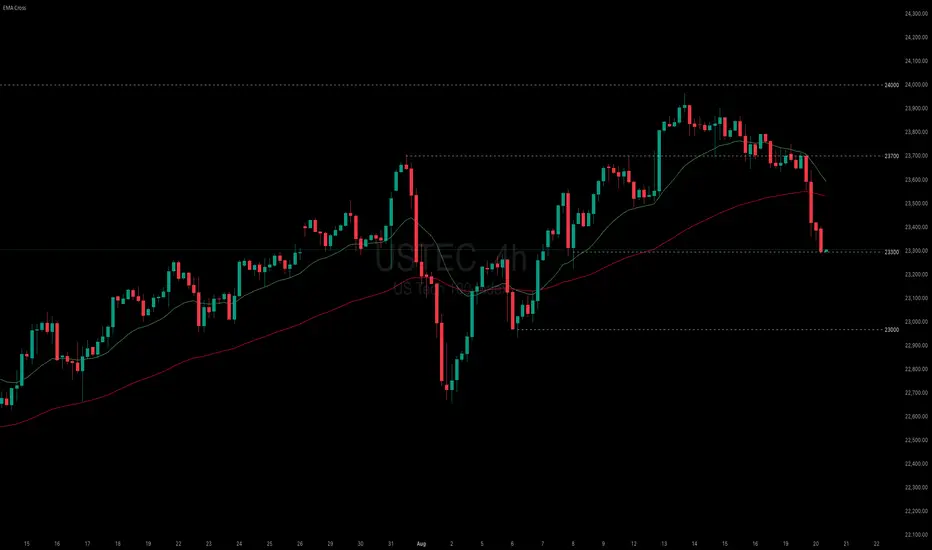
Despite the uncertainty following President Trump’s dismissal of Fed Governor Cook, USTEC advanced slightly.
President Trump dismissed Fed Governor Cook due to allegations of mortgage fraud, raising concerns over the Fed's independence. JPMorgan warned the move could set a precedent for politically driven dismissals of other board members.
Meanwhile, the August CB Consumer Confidence Index rose to 97.4, indicating a more positive outlook on current conditions. However, 12-month inflation expectations rose from 5.7% to 6.2%, while the share of respondents viewing jobs as plentiful decreased from 29.9% to 29.7%.
USTEC has risen above both EMAs, signaling an attempt at a trend reversal. The narrowing distance between EMA21 and EMA78 suggests a potential shift toward bullish momentum. If USTEC holds above both EMAs, the index may gain upward momentum toward the resistance at 23700. Conversely, if USTEC falls back below both EMAs, the index could retreat toward the support at 23300.
Bearish drop off?USTEC has rejected off the pivot and could drop to the 1st support which acts as a multi swing low support.
Pivot: 23,523.60
1st Support: 22,967.13
1st Resistance: 23,920.26
Risk Warning:
Trading Forex and CFDs carries a high level of risk to your capital and you should only trade with money you can afford to lose. Trading Forex and CFDs may not be suitable for all investors, so please ensure that you fully understand the risks involved and seek independent advice if necessary.
Disclaimer:
The above opinions given constitute general market commentary, and do not constitute the opinion or advice of IC Markets or any form of personal or investment advice.
Any opinions, news, research, analyses, prices, other information, or links to third-party sites contained on this website are provided on an "as-is" basis, are intended only to be informative, is not an advice nor a recommendation, nor research, or a record of our trading prices, or an offer of, or solicitation for a transaction in any financial instrument and thus should not be treated as such. The information provided does not involve any specific investment objectives, financial situation and needs of any specific person who may receive it. Please be aware, that past performance is not a reliable indicator of future performance and/or results. Past Performance or Forward-looking scenarios based upon the reasonable beliefs of the third-party provider are not a guarantee of future performance. Actual results may differ materially from those anticipated in forward-looking or past performance statements. IC Markets makes no representation or warranty and assumes no liability as to the accuracy or completeness of the information provided, nor any loss arising from any investment based on a recommendation, forecast or any information supplied by any third-party.

NASDAQ Technicals
NASDAQ (NAS100) Technical Analysis
Based on the 4 hour chart, NASDAQ (NAS100) is currently showing range bound price action, indicating a period of consolidation after a recent downtrend. This price behavior suggests a tug of war between bulls and bears, with neither side able to decisively break through key support or resistance levels.
Key Levels and Price Zones
The market is trading within a defined range. The key support zone is identified around 23,055 to 22,958. This is a critical area, as a clean break below it would signal a continuation of the previous bearish trend. The primary resistance zone is located between 23,309 and 23,418. This zone must be broken and held for a potential bullish reversal to be considered.
Bullish and Bearish Scenarios
* Bullish Scenario: For a bullish trend to resume, the price needs to break above the 23,418 resistance level. A confirmed breakout with a subsequent retest of this level as support could open the door for a move towards the higher resistance at 23,736. Traders should watch for a strong bullish candle closing above this zone and an increase in buying volume to confirm the breakout.
* Bearish Scenario: The bearish outlook remains intact as long as the price stays below the resistance zone. A break below the support zone around 22,958 would be a significant bearish signal. This could lead to a further drop toward the lower range's support at 22,690. A strong bearish candle closing below the support zone would provide confirmation.
Risk Management and Final Thoughts
Given the current consolidation, traders should be cautious about initiating new positions without clear confirmation. The most prudent approach is to wait for a definitive breakout above resistance or a breakdown below support. Trading within the range can be highly volatile and is generally considered higher risk. Placing stop loss orders outside of the key support and resistance zones is crucial to manage potential risks effectively. The current technical screenshot of NAS100 is one of indecision, and a significant move is likely on the horizon once one of the boundaries is breached.

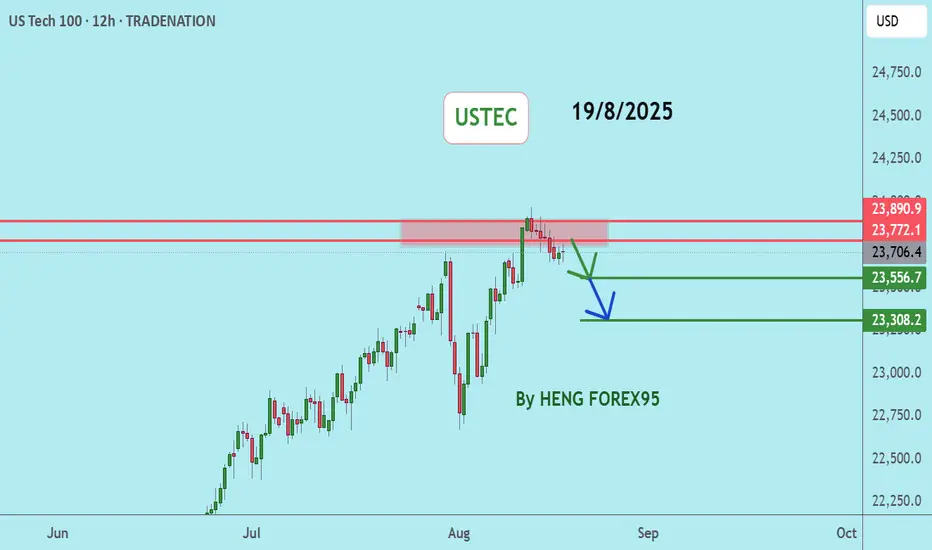
USTECUSTEC price is near the resistance zone 23772 - 238920. If the price cannot break through the 23920 level, it is expected that the price will likely go down in the short term. Consider selling in the red zone.
Could elevated valuations start weighing heavily on USTEC?
US equities fell sharply under pressure from stretched AI valuations. OpenAI CEO Altman cautioned that investors are overly excited about AI, warning that valuations have become “out of control.” Adding to the drag, Nvidia shares tumbled as China mandated domestic AI chips account for over 50% of local data center usage, raising concerns over export reliance. Markets now turn their focus to Fed Governor Waller’s speech and the FOMC minutes for clues on the rate-cut outlook.
USTEC is sliding lower, approaching the support at 23300. The narrowing gap between EMA21 and EMA78 points to a possible shift toward bearish momentum. If USTEC breaks below 23300, the index could decline further toward the next support at 23000. Conversely, if USTEC climbs back above both EMAs, the index may gain upside traction toward the resistance at 23700.
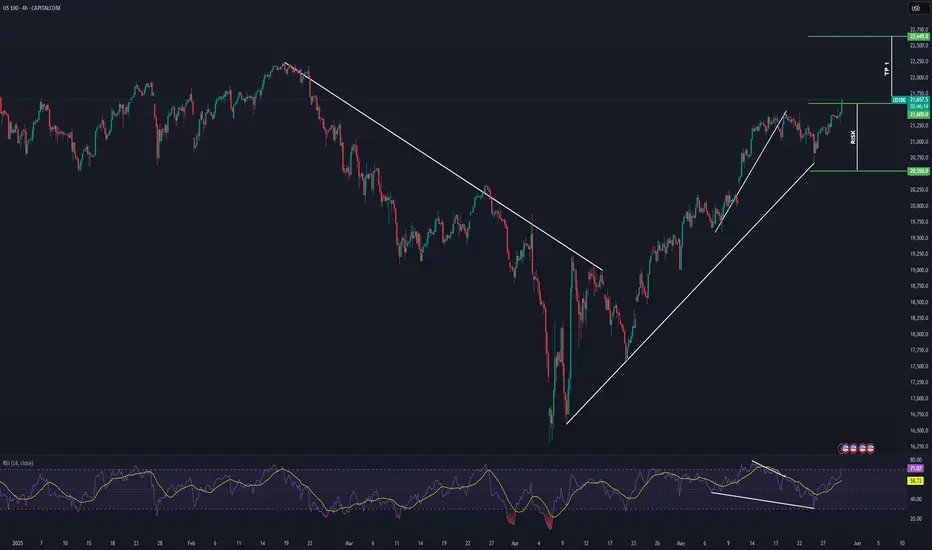
NASDAQ Potential Bullish ContinuationNASDAQ price action seems to exhibit signs of potential Bullish momentum as the price action may form a credible Higher High (after tarriff delays on the EU) with multiple confluences through key Fibonacci and Support levels which presents us with a potential long opportunity.
Trade Plan:
Entry : 21600
Stop Loss : 20550
TP 1: 22649
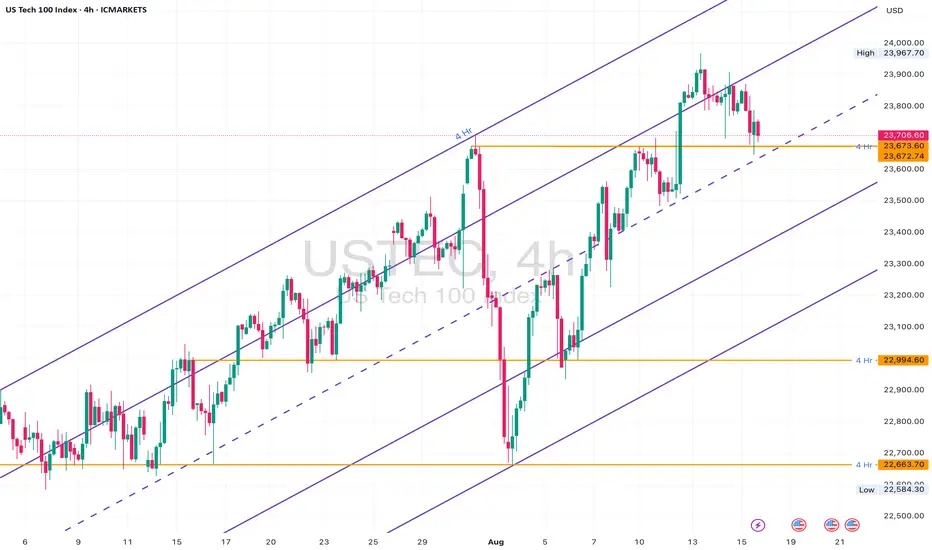
NAS100 4H Channel: Bounce or Breakdown?NASDAQ100 has been trending within a clean ascending channel on the 4H timeframe. We’re now sitting at a crucial decision point — the midline and horizontal support around 23,670.
This zone has historically acted as a strong S/R pivot. If price holds, we could see another bullish bounce toward 24,000+. But if it breaks and closes below, we may get a clean drop toward the bottom of the channel — with 23,200 and 22,663 as targets.
Plan:
• Wait for a 4H close above or below the 23,670 level
• Bullish scenario: Bounce toward upper channel (~24,300)
• Bearish scenario: Drop to lower channel boundary with incremental TP levels
Structure:
• 4H rising channel structure still intact
• Price testing midline zone
• Horizontal level at ~23,670 adds confluence
• No confirmed break of channel yet
Key Zones:
• Support: 23,670 (midline + structure support)
• Bullish flip zone: 23,967
• Bearish continuation zones:
‣ 23,200
‣ 22,994
‣ 22,663
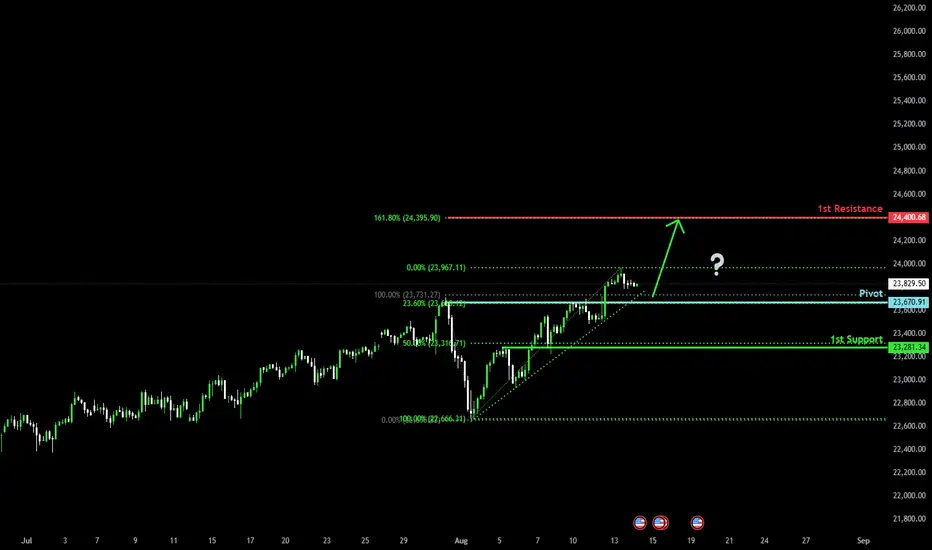
Bullish continuation?USTEC is falling towards the pivot which has been identified as a pullback support and could bounce to the 1st resistance.
Pivot: 23,670.91
1st Support: 23,281.34
1st Resistance: 24,400.68
Risk Warning:
Trading Forex and CFDs carries a high level of risk to your capital and you should only trade with money you can afford to lose. Trading Forex and CFDs may not be suitable for all investors, so please ensure that you fully understand the risks involved and seek independent advice if necessary.
Disclaimer:
The above opinions given constitute general market commentary, and do not constitute the opinion or advice of IC Markets or any form of personal or investment advice.
Any opinions, news, research, analyses, prices, other information, or links to third-party sites contained on this website are provided on an "as-is" basis, are intended only to be informative, is not an advice nor a recommendation, nor research, or a record of our trading prices, or an offer of, or solicitation for a transaction in any financial instrument and thus should not be treated as such. The information provided does not involve any specific investment objectives, financial situation and needs of any specific person who may receive it. Please be aware, that past performance is not a reliable indicator of future performance and/or results. Past Performance or Forward-looking scenarios based upon the reasonable beliefs of the third-party provider are not a guarantee of future performance. Actual results may differ materially from those anticipated in forward-looking or past performance statements. IC Markets makes no representation or warranty and assumes no liability as to the accuracy or completeness of the information provided, nor any loss arising from any investment based on a recommendation, forecast or any information supplied by any third-party.
Rate-cut optimism fueled risk-on mood, lifting US equities
July CPI showed little inflationary impact from tariffs, amplifying expectations for a September Fed cut. Optimism also returned for small-cap firms, previously seen as most vulnerable to tariff pressures. Headline CPI rose 2.7% YoY in July, 0.1% lower than a year earlier, with a 1.1% MoM drop in energy prices contributing to the overall decline.
BlackRock CIO Rick Rieder noted that shelter costs, the largest CPI component, slowed to their lowest since 2021, significantly boosting the odds of a September cut. He added that the Fed could take a more aggressive approach, with a 50bp cut at the September FOMC.
USTEC extended its sharp uptrend after breaching above the 23700 high. The widening gap between both EMAs indicates the potential continuation of bullish momentum. If USTEC holds above 23700, the index may gain upward momentum toward the psychological resistance at 24000. Conversely, if USTEC breaks below 23700, the index could retreat toward 23300.

US indices paused as fragile macro data undermined recent gains
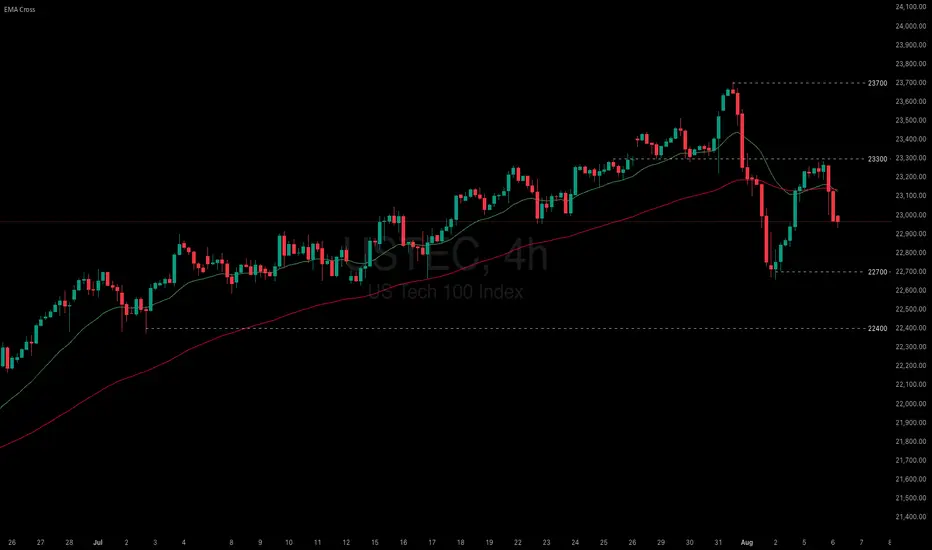
US equity gains paused amid President Trump’s renewed tariff threats and weakening economic data. Trump warned of steep tariff hikes on India and a potential 35% levy on the EU if obligations are not met. Meanwhile, the US July Services PMI fell from 50.8 to 50.1, missing the 51.5 consensus. New orders dropped to 50.3, while employment declined to 46.4—the lowest since March.
USTEC briefly tested 23300 before breaking below both EMAs. The widening gap between EMA21 and EMA78 suggests a potential shift toward bearish momentum. If USTEC fails to break above the resistance at 23300, the index could decline further toward 22700. Conversely, if USTEC breaks above both EMAs and 23300, the index may gain bullish traction toward 23700.
Alphabet (GOOGL) extends its rally on upbeat 2Q earnings
US equities continue to post record highs, driven by stronger-than-expected 2Q earnings and optimism over ongoing trade agreements. Alphabet’s (GOOGL) Q2 results reaffirmed the accelerating pace of AI-led growth. The company’s cloud revenue surged 32% YoY, up from 28% in 1Q, and it raised its full-year capex guidance from $75B to $85B.
Alphabet (GOOGL) remains firm within its ascending channel. The price solidly holds above both EMAs, indicating the potential extension of bullish momentum. If Alphabet (GOOGL) holds above EMA21, the price may gain upside traction toward the previous high at 198.00. Conversely, if Alphabet (GOOGL) breaks below the support at 189.50, the price could retreat to the next support at 184.30.

NASDAQ100 continue its strength due to the strong earning seasonFundamental:
USTEC (NASDAQ100) continues its strength, propelled by robust Alphabet (GOOG) earnings that buoyed technology companies. Cloud services recorded the largest growth at 32% YoY, primarily driven by AI. Concurrently, the company plans to allocate $85 bln to capital expenditure in 2025 for AI, an increase from $75 bln, signaling continued surging demand for AI infrastructure.
In addition, recent US economic data indicated strong consumption and optimism, with the July Services PMI expanding to 55.2 from 52.9 in the previous month. Initial Jobless Claims also fell to 217k, the lowest in 14 weeks, reinforcing optimism regarding the labor market, alongside stronger-than-expected Nonfarm Payrolls from early July.
Inflation data showed a minor impact from tariffs, and tariff negotiations have progressed favorably. Trade deals have been secured with Vietnam, Indonesia, Japan, and the Philippines, and potential trade agreements with the Eurozone and India are anticipated before the deadline.
Major earnings releases are slated for next week, including MSFT, META, and QCOM on July 30. AMZN and APPL's results the following day could provide a clearer picture of USTEC's overall earnings.
Meanwhile, USTEC's forward P/E currently stands at 27x, aligning with its 5-year average despite reaching a new record high, suggesting further upside potential.
Technical:
The index is trading above its EMAs, which are extending, signaling a continuation of the rally.
If USTEC sustains its momentum, the index may reach 24000 upon breaking above the potential resistance at 23400.
Conversely, a pullback near the swing high may suggest a retest of the support at 23000.
