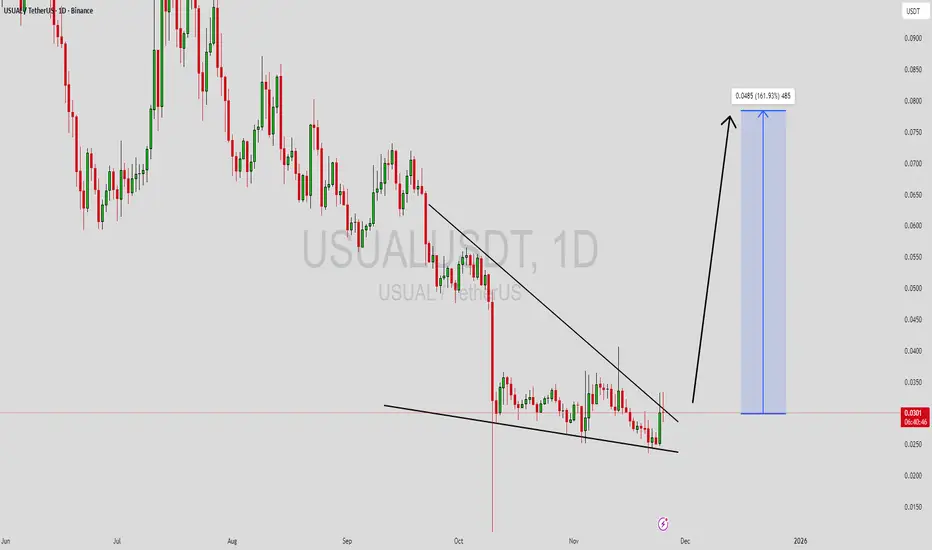
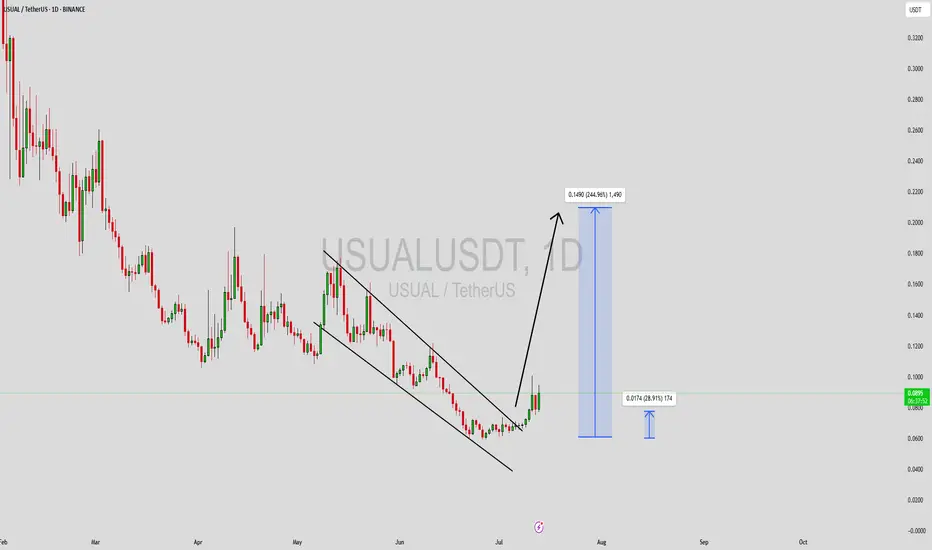
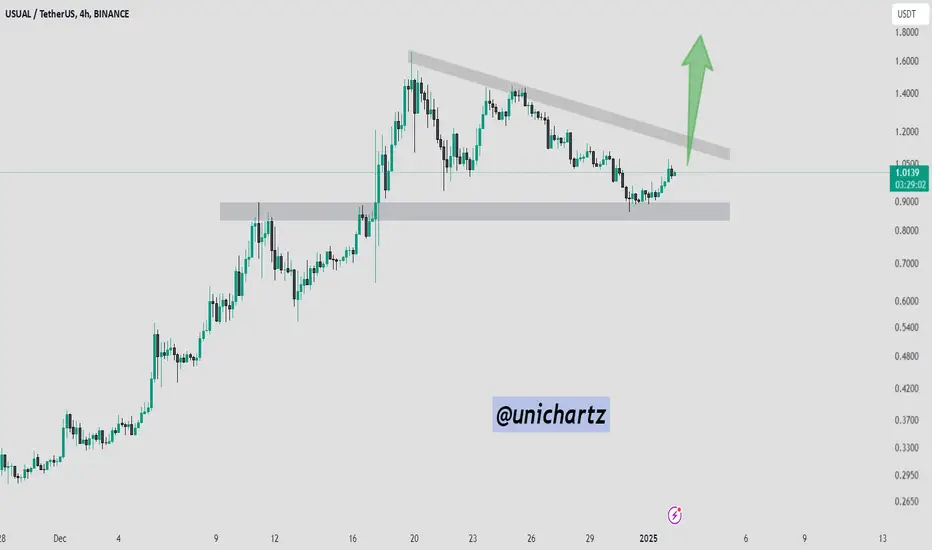
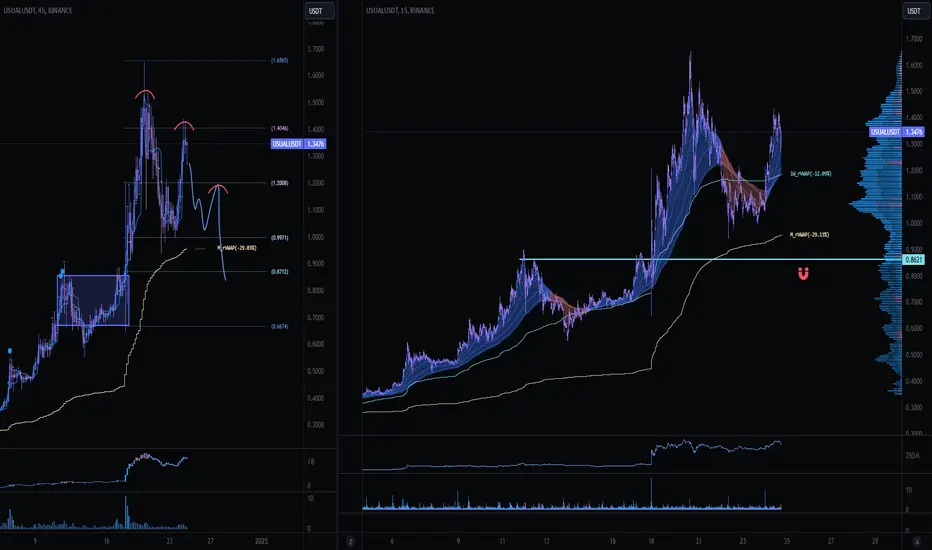
USUALUSDT Forming Falling WedgeUSUALUSDT is forming a clear falling wedge pattern, a classic bullish reversal signal that often indicates an upcoming breakout. The price has been consolidating within a narrowing range, suggesting that selling pressure is weakening while buyers are beginning to regain control. With consistent volume confirming accumulation at lower levels, the setup hints at a potential bullish breakout soon. The projected move could lead to an impressive gain of around 90% to 100% once the price breaks above the wedge resistance.
This falling wedge pattern is typically seen at the end of downtrends or corrective phases, and it represents a potential shift in market sentiment from bearish to bullish. Traders closely watching USUALUSDT are noting the strengthening momentum as it nears a breakout zone. The good trading volume adds confidence to this pattern, showing that market participants are positioning early in anticipation of a reversal.
Investors’ growing interest in USUALUSDT reflects rising confidence in the project’s long-term fundamentals and current technical strength. If the breakout confirms with sustained volume, this could mark the start of a fresh bullish leg. Traders might find this a valuable setup for medium-term gains, especially as the wedge pattern completes and buying momentum accelerates.
✅ Show your support by hitting the like button and
✅ Leaving a comment below! (What is your opinion about this Coin?)
Your feedback and engagement keep me inspired to share more insightful market analysis with you!
Usual
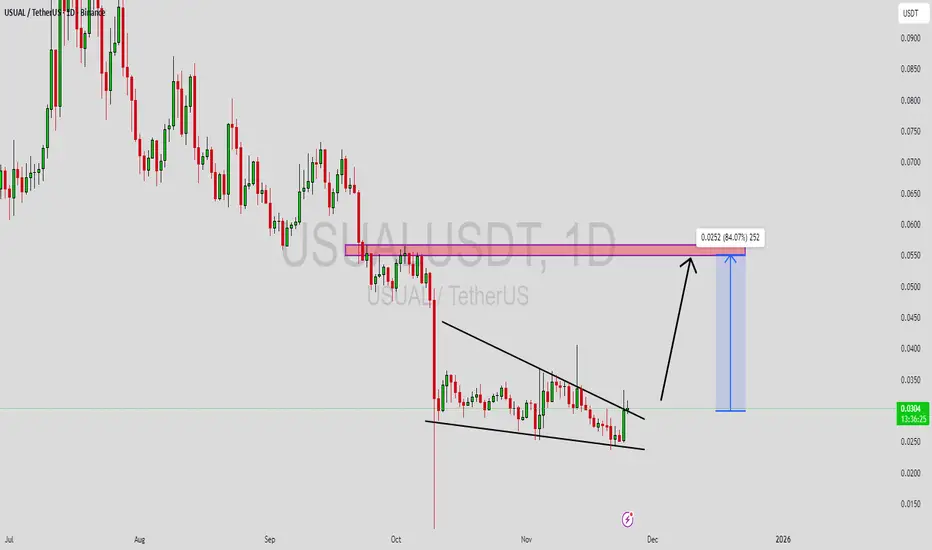
USUALUSDT ReadyUSUALUSDT is forming a clear falling wedge pattern, a classic bullish reversal signal that often indicates an upcoming breakout. The price has been consolidating within a narrowing range, suggesting that selling pressure is weakening while buyers are beginning to regain control. With consistent volume confirming accumulation at lower levels, the setup hints at a potential bullish breakout soon. The projected move could lead to an impressive gain of around 40% to 50% once the price breaks above the wedge resistance.
This falling wedge pattern is typically seen at the end of downtrends or corrective phases, and it represents a potential shift in market sentiment from bearish to bullish. Traders closely watching USUALUSDT are noting the strengthening momentum as it nears a breakout zone. The good trading volume adds confidence to this pattern, showing that market participants are positioning early in anticipation of a reversal.
Investors’ growing interest in USUALUSDT reflects rising confidence in the project’s long-term fundamentals and current technical strength. If the breakout confirms with sustained volume, this could mark the start of a fresh bullish leg. Traders might find this a valuable setup for medium-term gains, especially as the wedge pattern completes and buying momentum accelerates.
✅ Show your support by hitting the like button and
✅ Leaving a comment below! (What is your opinion about this Coin?)
Your feedback and engagement keep me inspired to share more insightful market analysis with you!
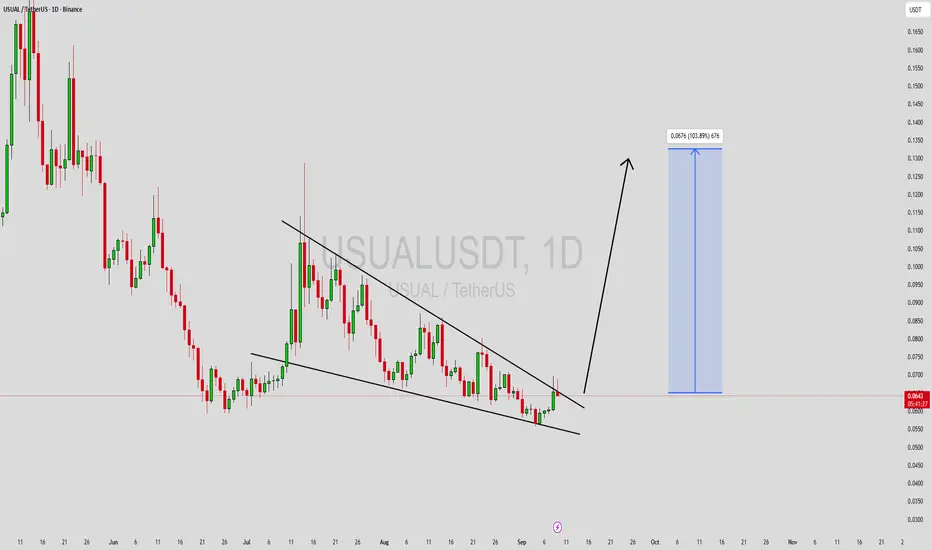
USUALUSDT Forming Falling WedgeUSUALUSDT is currently displaying a falling wedge pattern, one of the most reliable bullish reversal signals in technical analysis. The narrowing price action indicates that selling pressure is fading, while buyers are gradually gaining strength. With trading volume remaining healthy, the setup points toward a potential breakout, with expected gains in the range of 90% to 100% once momentum fully shifts to the upside.
This structure often precedes strong rallies as it reflects accumulation by investors who anticipate significant upward movement. In the case of USUALUSDT, market participants are increasingly taking interest, positioning themselves ahead of a potential breakout. The wedge formation highlights the compression of price before expansion, which can fuel rapid gains when resistance is broken.
Investor sentiment around this project continues to improve, supported by consistent volume and growing market activity. This alignment of technical signals and investor participation strengthens the likelihood of a bullish move. Traders who monitor this setup closely may find a high-probability opportunity as the breakout level approaches.
In conclusion, USUALUSDT has all the elements of a bullish setup, with the falling wedge pattern pointing toward a breakout rally of 90% to 100%. Strong volume support and increasing investor confidence could push this pair into a powerful upward trajectory in the near term.
✅ Show your support by hitting the like button and
✅ Leaving a comment below! (What is You opinion about this Coin)
Your feedback and engagement keep me inspired to share more insightful market analysis with you!
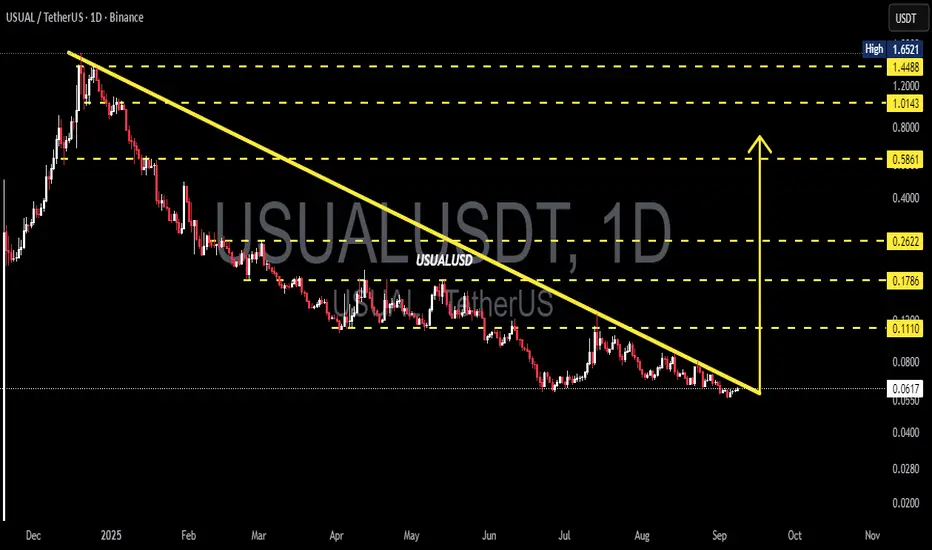
USUAL/USDT — End of Pressure? Breakout or Breakdown Ahead📊 Full Analysis (Daily Chart):
Since peaking around $1.65, USUAL/USDT has remained under heavy selling pressure, forming a clear long-term downtrend with a descending trendline acting as a major resistance. Price is now trading near $0.0614, exactly at the critical $0.05–0.07 support zone.
The structure is shaping into a descending triangle, where price keeps making lower highs while holding a flat support base. This pattern is often seen as a bearish continuation, but if bulls manage to break above the trendline with strong volume, it could trigger a major trend reversal.
---
🔼 Bullish Scenario (Potential Reversal)
Trigger: Daily close above $0.07–0.08 with convincing volume.
Extra confirmation: Successful retest of the broken trendline as new support.
Upside targets:
1. $0.1110 (minor resistance)
2. $0.1786 (mid supply zone)
3. $0.2622 – $0.5861 (major recovery levels if momentum expands).
Risk management: Stop loss below $0.05 to avoid false breakouts.
📌 Interpretation: A breakout could signal the end of prolonged selling, inviting bargain hunters and possibly triggering a short squeeze rally.
---
🔽 Bearish Scenario (Continuation of the Downtrend)
Trigger: Daily close below $0.05 with heavy selling volume.
Downside targets: $0.03 → $0.02 (psychological support levels + measured move projection of the descending triangle).
Risk management: For shorts, stop loss above $0.075–0.08.
📌 Interpretation: If the support base fails, the descending triangle confirms as a bearish continuation pattern, likely driving price to new lows.
---
🔎 Technical Pattern in Play
Descending Triangle: A structure often seen as bearish, but also a potential launchpad if broken upward with volume.
Breakout Case: A strong bullish breakout would flip market sentiment and shift momentum upward.
Breakdown Case: Failure to hold support would accelerate downside pressure.
---
🎯 Trading Outlook
USUAL/USDT is now at a make-or-break level. Price compression between the trendline and support is setting up for a decisive move. Patience is key here — waiting for a daily close with strong volume confirmation is safer than guessing the direction.
Short-term traders may play the current range, while swing traders should wait for a confirmed breakout or breakdown before committing to larger positions.
---
#USUAL #USUALUSDT #CryptoAnalysis #Altcoin #TechnicalAnalysis #Breakout #Bearish #Bullish #DescendingTriangle
USUAL · Futures Trading Trade-NumbersAre you going to focus on the short-term or the long-term?
Are you a day-trader or an investor?
How are you approaching this market?
Look at USUALUSDT: In our reality, this is a great opportunity. In our world, this is an awesome chart.
USUAL is trading at bottom prices but with a bullish bias. USUAL is now trading within the "opportunity buy zone." The best possible entry level before a major bullish cycle.
The bullish bias comes from the fact that the market already experienced a major bearish wave. This wave is hard to ignore on the chart (left side).
Since USUALUSDT already went through this corrective process, we know it doesn't need to go through the same. That's one.
The next one is the fact that prices are higher in August 2025 compared to the April low. A higher low. Sellers are not present. Nobody is selling at the bottom and that's why support is found higher. And, this is the second one, also supports higher prices.
_____
LONG USUALUSDT
ENTRY: 0.0660 - 0.0710 (STOP: 0.0655)
TARGETS: 0.0774, 0.1031, 0.1444, 0.1702, 0.1958
_____
Thanks a lot for your continued support.
If you enjoy the content, choose to follow me.
Questions are welcomed in the comments section. Opinions as well.
Namaste.
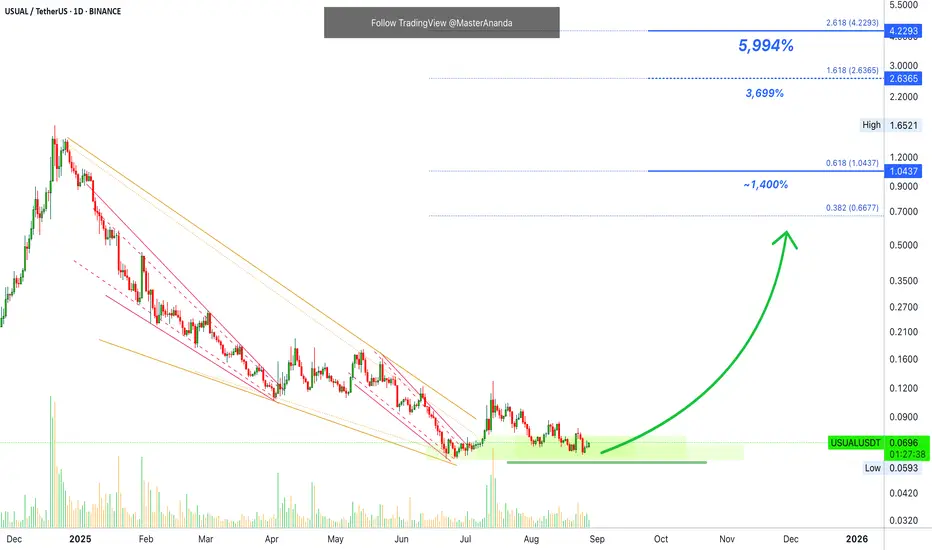
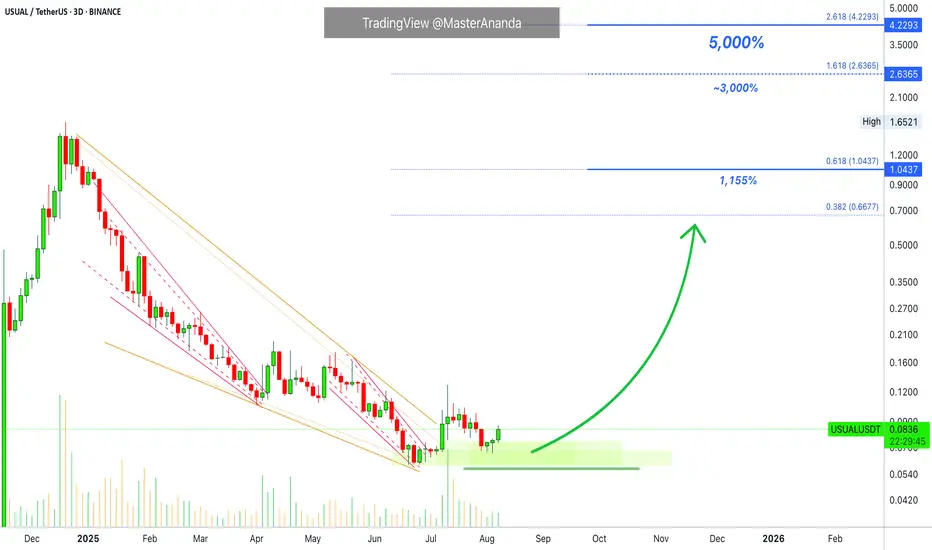
Usual Protocol 5000% Bullish Potential ExposedThe highest volume since December 2024 happened last month, July. This is a high volume bar that signals the bulls are back in the game.
As USUALUSDT was moving lower volume was also dropping. After the bottom was hit, volume did rise but on the buying side. The bearish wave lost its momentum and ran its course.
This is going to be a huge project. I should say, this trading pair will produce big gains. You can see with me the huge growth potential shown on the chart. These numbers are based on the 2024 high, and we have 3,000% and 5,000% potential for growth. Imagine what numbers we would get if we had data coming from 2021.
Some pairs I mention more than others because they are safe and have huge potential for growth. It is easier to choose if you see a pair often.
When in doubt, keep reading.
If you don't know what to choose and there are too many options, then you need to read some more. There is always time and the market always offers a second chance. Keep reading and everything becomes clear.
It is normal to not understand at first. It is normal to start understanding things after several weeks. It is very normal to have a map of what is happening after just a few months. You will be able to tell the difference easily from when you are reading and when you are not. The market is not going away. But, if you want to know what the market is actually doing, read @MasterAnanda
Thank you for your continued support.
Namaste.
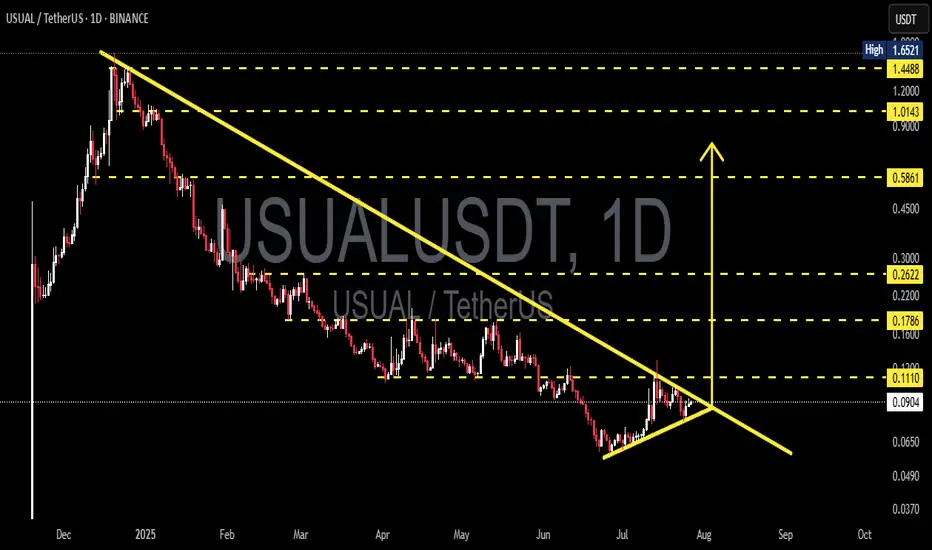
USUALUSDT Ready to Explode? Major Breakout From Downtrend?USUALUSDT is currently displaying a very compelling technical structure on the daily timeframe. After a long downtrend since early 2025, the price is now forming an accumulation pattern with increasing buying pressure.
---
📊 Pattern & Chart Structure Overview:
🔹 Descending Triangle Formation:
The price has been forming a series of lower highs with a gradually rising base, indicating a classic compression or accumulation pattern that often precedes a major breakout.
🔹 Rising Buying Pressure:
Notice the formation of higher lows since early July—this suggests that buyers are gradually stepping in, despite the macro downtrend still intact.
🔹 Low Volume = High Breakout Potential:
Volume remains relatively low, which is typical in the final stages of consolidation. Once a breakout occurs, it’s likely to be accompanied by a significant spike in volume.
---
🟢 Bullish Scenario (Confirmed Breakout):
If the price breaks above the descending trendline (~0.1110) with a strong daily candle and increased volume, it may ignite a bullish move with the following targets:
🎯 Upside Targets:
1. 0.1786 – Previous consolidation resistance
2. 0.2622 – Psychological zone and prior seller control area
3. 0.5861 – Medium-term target if momentum builds
4. 1.0143 and 1.4488 – Long-term bullish targets upon full trend reversal
🚀 The upside potential is massive as the price has a lot of room above once resistance is broken.
---
🔴 Bearish Scenario (Failed Breakout):
If the price gets rejected at the descending resistance and breaks down below the ascending support:
📉 Downside Targets:
1. 0.0650 – Minor support from July's accumulation zone
2. 0.0490 – 0.0370 – Previous cycle lows and potential bounce zones
⚠️ A breakdown would invalidate the current accumulation setup and suggest sellers still dominate.
---
🔍 Conclusion & Strategy:
USUALUSDT is now at a critical decision zone. The combination of a descending triangle, rising higher lows, and low volume makes it clear that a major move is brewing.
📌 Breakout = Big swing trade opportunity
📌 Breakdown = Avoid entries, wait for lower support zones
---
📈 Trader Recommendations:
✅ Set alerts above 0.1110
✅ Confirm breakout with strong candle + volume
✅ Aggressive stop loss below 0.0750
✅ Swing trade targets based on historical resistance & fib levels
#USUALUSDT #CryptoBreakout #AltcoinSetup #DescendingTriangle #CryptoAnalysis #BullishSetup #BearishSetup #BreakoutIncoming #TechnicalAnalysis
Usual 1,122% Target Mapped · Can Go Higher Late 2025Usual grew 700% in one month, between November and December 2024. Then the market went on to produce a major lower low bottom and now everything is changing. I am sharing this one again because I believe it will produce a massive bullish wave.
Good evening my fellow Cryptocurrency trader, how are you feeing in this wonderful day?
A new week starts and with the new week we will have a new set of top performers. Remember that a rising tide lifts all boats. It is not only one project but the majority of the altcoins that are set to grow. It is a long drawn out process, do not be distracted by the illusion of easy or fast gains. If you can hold and do so strong, patiently, you can end up with big gains. The big wins accumulate after months. Buy the bottom, 7-April, 22-June and hold. Comeback in 2-3 months and see how the market is doing. Sell those trading high, buy those trading low.
USUALUSDT is now trading above EMA55 and EMA34. A strong candle and high volume came up to break each of these resistance levels. The same levels that rejected growth many times in the past three months.
In April, USUALUSDT tried to turn bullish but was rejected by EMA55 and EMA34. This same dynamic repeated once more in late April and then twice in May. When the market fails to conquer a resistance zone it tens to move lower looking for strength. That did it. After a major low and rounded bottom, we are now on the bullish zone.
USUALUSDT can easily grow 500% to 800% in the coming months. Without hitting a new all-time high, we have 1,122% potential for growth. From a previous chart, the 1,122% target gives us 1,950%. This is huge growth and it is possible that a new all-time high will be hit later during the bull run phase.
This is a friendly reminder. Opportunities are endless in this market.
Thank you for reading.
Namaste.

USUALUSDT Forming Falling WedgeUSUALUSDT is starting to capture the attention of crypto traders as it forms a well-defined falling wedge pattern on the charts — a classic signal for a potential bullish reversal. This technical setup is often sought after because it combines a declining trend with contracting price action, suggesting that selling pressure is losing steam and that a significant breakout could be on the horizon. The volume profile for USUALUSDT is also showing healthy signs, with increasing accumulation, reinforcing the case for a strong move upwards once the wedge’s resistance is broken.
A falling wedge breakout is a powerful indicator that buyers are regaining control and that the market sentiment is shifting. For USUALUSDT, the projected gain of 220% to 230% makes this an incredibly attractive play for traders who look for high-risk, high-reward setups. This type of pattern, when combined with a supportive volume surge, can deliver rapid and sustained price action, especially in the volatile crypto markets where sentiment can flip quickly.
Beyond the technicals, investors are increasingly taking interest in the USUAL project’s fundamentals and future potential. The team’s consistent development progress and growing community support are creating a solid foundation for long-term growth. As the market eyes this pair, a confirmed breakout from the wedge could attract even more traders and institutional investors seeking to capitalize on its upside potential.
✅ Show your support by hitting the like button and
✅ Leaving a comment below! (What is You opinion about this Coin)
Your feedback and engagement keep me inspired to share more insightful market analysis with you!
USUAL: Worst Case Scenario +950%; Strong Bull Market = 4,000%+First bull then bear then sideways with a slight downward bent. Notice how the candles are almost invisible now... This is the end of the current phase. When volume drops to a halt and the candles become almost invisible you can be certain that change is approaching this market. The pair in question is USUALUSDT—RWA.
The late 2024 bullish wave started from ~2000 sats and total growth reached ~700%.
Current price is ~650 sats and this opens the doors for 10, 20 or even 30X in the coming months. 20X is possible even without a new all-time high. I am adding this one to my list as it has huge growth potential and it is available on so many top exchanges.
The action went below 100%. This is good, we know there won't be any compulsion for prices to move lower. Once a bearish move goes beyond the low of the previous move, we are faced with a potential buy opportunity. That's what we have here.
There is basically no recovery in April, this is also good, it means the bulls have not used their ammunition while the bears must be running out. Many pairs produced a strong move in April and are recovering now in June.
The most interesting part is the easy target, it goes as high as 950%. Worst case scenario, we get 950% to 1,500% total growth within the next six months. If things go well, we will see a new all-time high with profits potential going off the chart. Beyond 4,000% is possible.
Thanks a lot for your support.
Namaste.

USUAL Looks Bullish (12H)A double bottom pattern has formed on the chart, leading to a breakout from the price channel.
A support zone has been established, and a bullish CH has appeared on the chart.
Considering the breakout and the bullish structure, we can set up a buy position on this coin.
Targets are marked on the chart, and reaching the third target is also possible.
The invalidation of this setup will occur if a daily candle closes below the invalidation level.
For risk management, please don't forget stop loss and capital management
When we reach the first target, save some profit and then change the stop to entry
Comment if you have any questions
Thank You

USUALUSDT 1D Analysis USUAL ~ 1D Analysis
#USUAL Buy gradually from here with a short term target of at least 15%+ from here. These are the early signs when whales start to accumulate.

$USUAL - Triple Bottom Scalp Long$USUAL | 4h
**Weekend scalp long setup**
We're seeing a potential **triple bottom** forming on the local timeframe, indicating strong demand around this support zone. Price has tested this level three times without a breakdown, suggesting seller exhaustion.
If we hold above the most recent low, we can look for a long entry, targeting a bounce toward the nearest resistance or VWAP.
We can start scaling into longs at the current market price .11s, with a stop just below 0.105 or if you can extend it to .10
Targets:
.124 to .13
.137 to .142
.146 to .15

USUAL Idea - USUAL/TheterHey traders!
Sorry, no chart Analysis!
My suggestion is to enter above the $0.1530 price range
With targets:
1- $0.1650
2- $0.1790
3- $0.1900
There is a possibility of a price correction to the $0.1400 range
Good luck

USUAL is waking up - the beginning of a new bullish wave?This analysis is an update of the analysis you see in the "Related publications" section
We previously had accurate analyses of USUAL, correctly identifying the highs and lows.
Based on the type of custom order flow visible on the chart and recent candlestick formations, it seems that the buy orders in the lower green zone have been sufficient to trigger a trend reversal.
We’ve now identified a new zone. the upper green zone. as a rebuy area, where we’ll be looking for buy/long positions.
Targets are marked on the chart.
A daily candle closing below the upper green zone would invalidate this outlook.
For risk management, please don't forget stop loss and capital management
When we reach the first target, save some profit and then change the stop to entry
Comment if you have any questions
Thank You

USUAL ANALYSIS (8H)After wave A was completed, from the point where we placed the red arrow on the chart, it seems the price has entered wave B.
Wave B is a bearish symmetrical wave, and it currently appears that we are in the early stages of wave I, which is a bearish wave.
From the supply zone, we expect a rejection towards the Fibonacci levels of wave a to i, which corresponds to the green zone.
A daily candle closing above the invalidation level will invalidate this analysis.
For risk management, please don't forget stop loss and capital management
Comment if you have any questions
Thank You

USUAL analysis (4H)It seems that the correction for this asset has started from the point where we placed the red arrow on the chart.
This correction appears to be a diamond-shaped diametric.
Currently, we seem to be in wave F of this diametric. The price may reject downward from the red zone.
A daily candle closing above the invalidation level will invalidate this analysis
For risk management, please don't forget stop loss and capital management
Comment if you have any questions
Thank You

SUSUAL - Long Trade IdeaUSUAL price is currently holding its key support, a bounce is due at this level, and could potentially retest the supply above
Buying zone: 0.34 to 0.32
Local resistance is around 0.50 (bearish orderblock + hvn)
Stop below .295
Potential targets:
0.50
0.67
0.86

USUALUSDT: What Price Action Is Telling Us Today - Usual◳◱ With Super Trend in play and the price at 0.5389, the market whispers opportunity. Breaking past 0.8931 | 1.196 | 1.6671 could spark a rally, while 0.422 | 0.2538 anchors bullish sentiment.
◰◲ General Information :
▣ Name: Usual
▣ Rank: 288
▣ Exchanges: Binance, Kucoin, Gateio, Mexc
▣ Category / Sector: N/A
▣ Overview: Usual project overview is currently unavailable. I'll try to update this in the upcoming analysis.
◰◲ Technical Metrics :
▣ Current Price: 0.5389 ₮
▣ 24H Volume: 92,622,307.521 ₮
▣ 24H Change: -3.145%
▣ Weekly Change: -13.97%%
▣ Monthly Change: -41.17%%
▣ Quarterly Change: N/A%
◲◰ Pivot Points :
▣ Resistance Level: 0.8931 | 1.196 | 1.6671
▣ Support Level: 0.422 | 0.2538
◱◳ Indicator Recommendations :
▣ Oscillators: BUY
▣ Moving Averages: STRONG_SELL
◰◲ Summary of Technical Indicators : SELL
◲◰ Sharpe Ratios :
▣ Last 30 Days: 1.10
▣ Last 90 Days: 3.20
▣ Last Year: 3.20
▣ Last 3 Years: 3.20
◲◰ Volatility Analysis :
▣ Last 30 Days: 3.18
▣ Last 90 Days: 2.94
▣ Last Year: 2.94
▣ Last 3 Years: 2.94
◳◰ Market Sentiment :
▣ News Sentiment: N/A
▣ Twitter Sentiment: N/A
▣ Reddit Sentiment: N/A
▣ In-depth BINANCE:USUALUSDT analysis available at TradingView TA Page
▣ Your thoughts matter! What do you think of this analysis? Share your insights in the comments below. Your like, follow, and support are greatly valued and help sustain high-quality content.
◲ Disclaimer : Disclaimer
The content provided is for informational purposes only and does not constitute financial, investment, or trading advice. Always conduct your own research and consult a qualified professional before making any financial decisions. Use of the information is solely at your own risk.
▣ Explore the Power of Charting with TradingView
Unlock a wide range of financial analysis tools, data, and features to elevate your trading experience. Take a tour and see the possibilities. If you decide to upgrade your plan, you can receive up to $30 back. Discover more here - affiliate link -

Key Support Holds: USUAL/USDT Eyes a Bullish Breakout USUAL/USDT pair is showing a strong rebound from the key support zone, suggesting a successful retest of the breakout levels. However, the price is currently facing rejection from the descending, narrow resistance zone.
Based on the current setup, we predict a breakout from this zone, potentially leading to further bullish momentum in the coming sessions.
$USUAL - One of the Top DeFi TokenUSUAL (usualmoney) skyrocketed, with a massive 644% increase in just one month since it hit the market.
Usualmoney is like an on-chain version of Tether or Circle, but it actually shares its revenue with token holders.
Usual is all about issuing stablecoins backed by real-world assets (RWA), and they're big on giving back to their community through the USUAL token.
We're seeing a huge shift in RWA stablecoins, with $USUAL hitting 1B dollar in TVL thanks to backing from Binance and Kraken. Binance Labs threw some serious cash at $USUAL, investing in @usualmoney.
No doubt, this is one of the top DeFi tokens out there.
TECHNICAL OUTLOOK:
Price failed to break its ATH and is now gently correcting.
It would be a perfect entry if we can retest the 4-hour demand around 0.87 to 0.80, in confluence also with our golden zone fib level.
$USUAL Token Surge 267% After Listing: What’s Driving the Rally?The cryptocurrency market witnessed a standout performer in $USUAL, which surged 267% after its listing on major exchanges, including Binance. This Ethereum-based altcoin soared from $0.35 to a peak of $1.28 within hours, showcasing significant investor interest. Let’s delve into the fundamental and technical factors fueling this impressive performance.
About $USUAL
$USUAL powers the Usual Protocol, a decentralized fiat stablecoin issuer with a unique governance structure. It integrates three tokens into its ecosystem:
1. USD0: A stablecoin fully backed by short-term, liquid, and risk-free assets, ensuring composability and transparency in DeFi.
2. USD0++: A liquid staking token that distributes rewards in $USUAL.
3. $USUAL: A governance token directly tied to protocol revenue, granting ownership and decision-making rights to its holders.
This innovative structure aligns user incentives and drives adoption of USD0, making $USUAL pivotal to the ecosystem’s growth. Its intrinsic value, derived from real cash flows, positions it as a game-changer in the DeFi landscape.
Fundamental Highlights
Listing Impact: The token’s debut on Binance, Bitget, and other prominent exchanges significantly boosted liquidity and visibility, propelling its price to an all-time high of $1.29.
Market Activity: With a 195.60% increase in trading volume, totaling $1.64 billion in the last 24 hours, $USUAL has captured the market’s attention.
Market Cap & FDV: At $552 million, $USUAL ranks #183 on CoinGecko, with a fully diluted valuation of $571 million.
Technical Analysis
The daily chart of $USUAL depicts the formation of a symmetrical triangle, a pattern often associated with potential breakout scenarios. A breakout above the triangle’s resistance could initiate another rally, targeting higher highs and reaffirming bullish sentiment.
Immediate support lies near $0.80, reflecting investor confidence in this price zone.
While the RSI IS not overbought, $USUAL’s momentum indicates strong buying interest, bolstered by its fundamentals and ecosystem utility.
Future Potential
$USUAL’s unique proposition as a governance token tied to real cash flows, combined with its stablecoin backing and staking mechanisms, positions it for sustained growth. However, traders should remain cautious, as breakout patterns may also lead to short-term corrections.
Conclusion
The $USUAL token is making waves with its robust performance, driven by a strong listing impact and innovative ecosystem fundamentals. As the DeFi space evolves, $USUAL’s decentralized approach to stablecoin governance and intrinsic value alignment could redefine the sector. Investors and traders should watch for a breakout from the symmetrical triangle for further bullish momentum.

USUAL | UNUSUAL PUMPsUSUAL Suspects: The Stablecoin Revolution Nobody Saw Coming!
After 300% pump lets see whats unusual here
USUAL is like the cool kid of stablecoin projects focused on making secure, decentralized fiat stablecoins while letting the community call the shots. The magic happens with the USUAL token, giving users control over governance. Using multi chain tech, USUAL grabs Real World Assets (RWAs) from big league players like BlackRock and Mountain Protocol, turning them into USD0 a stablecoin that’s on-chain, transparent, and way more trustworthy than your flaky ex.
Why Is USUAL "Unusually" Cool?
1.Multi-Chain Mastery: Plays nice with multiple blockchains, so USD0 isn’t stuck on one network like your grandma’s ancient landline.
2.RWA Wizardry: Collects tokenized real-world assets from legit pros and backs the stablecoin like it’s guarding Fort Knox.
3.Power to the People: Governance is decentralized, meaning you (yes, YOU!) help steer the ship with the USUAL token
4.OnChain Transparency: USD0 is like that one friend who overshares—totally transparent and verifiable, plus it’s compatible with your favorite DeFi apps.
5. Community Takeover:It’s all about the users power, value, and decision-making are in your hands. No middlemen allowed.
USUAL’s Price Parade
- Today’s Price: $0.603 (up a spicy +23.8% in the last 24 hours).
- All-Time High: $0.632 (Dec 9, 2024 so close, yet so far at -4.57%).
- Supply Stats: 494.6M tokens circulating, with a max supply of 4B tokens.
- Trading Volume: $52.76M in the last 24 hours, traded across 2 markets and 4 exchanges (Binance being the star)
- Market Cap: $299M, grabbing 0.01% of the crypto market pie.
Basically, USUAL is doing the stablecoin hustle while keeping things unusually exciting
