USUAL/USDT — End of Pressure? Breakout or Breakdown Ahead📊 Full Analysis (Daily Chart):
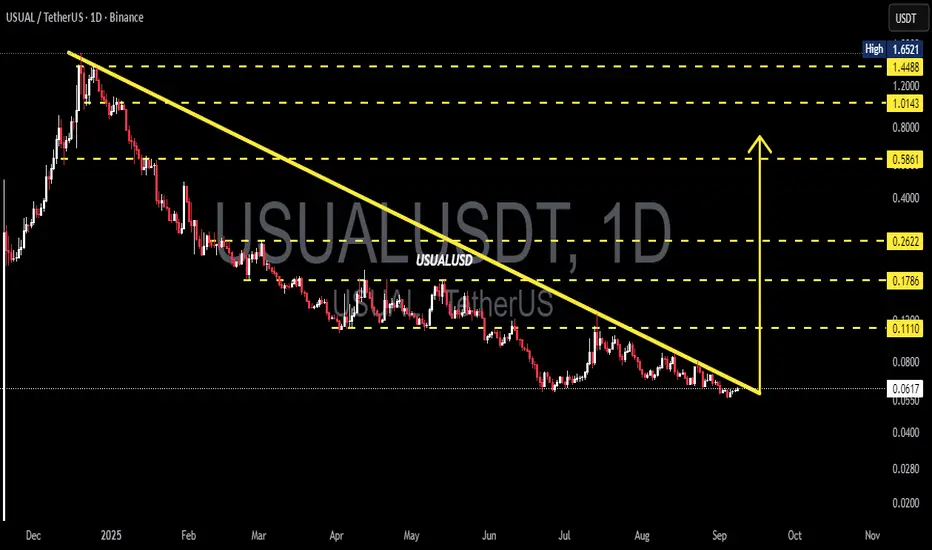
Since peaking around $1.65, USUAL/USDT has remained under heavy selling pressure, forming a clear long-term downtrend with a descending trendline acting as a major resistance. Price is now trading near $0.0614, exactly at the critical $0.05–0.07 support zone.
The structure is shaping into a descending triangle, where price keeps making lower highs while holding a flat support base. This pattern is often seen as a bearish continuation, but if bulls manage to break above the trendline with strong volume, it could trigger a major trend reversal.
---
🔼 Bullish Scenario (Potential Reversal)
Trigger: Daily close above $0.07–0.08 with convincing volume.
Extra confirmation: Successful retest of the broken trendline as new support.
Upside targets:
1. $0.1110 (minor resistance)
2. $0.1786 (mid supply zone)
3. $0.2622 – $0.5861 (major recovery levels if momentum expands).
Risk management: Stop loss below $0.05 to avoid false breakouts.
📌 Interpretation: A breakout could signal the end of prolonged selling, inviting bargain hunters and possibly triggering a short squeeze rally.
---
🔽 Bearish Scenario (Continuation of the Downtrend)
Trigger: Daily close below $0.05 with heavy selling volume.
Downside targets: $0.03 → $0.02 (psychological support levels + measured move projection of the descending triangle).
Risk management: For shorts, stop loss above $0.075–0.08.
📌 Interpretation: If the support base fails, the descending triangle confirms as a bearish continuation pattern, likely driving price to new lows.
---
🔎 Technical Pattern in Play
Descending Triangle: A structure often seen as bearish, but also a potential launchpad if broken upward with volume.
Breakout Case: A strong bullish breakout would flip market sentiment and shift momentum upward.
Breakdown Case: Failure to hold support would accelerate downside pressure.
---
🎯 Trading Outlook
USUAL/USDT is now at a make-or-break level. Price compression between the trendline and support is setting up for a decisive move. Patience is key here — waiting for a daily close with strong volume confirmation is safer than guessing the direction.
Short-term traders may play the current range, while swing traders should wait for a confirmed breakout or breakdown before committing to larger positions.
---
#USUAL #USUALUSDT #CryptoAnalysis #Altcoin #TechnicalAnalysis #Breakout #Bearish #Bullish #DescendingTriangle
Usualpredition
USUALUSDT Ready to Explode? Major Breakout From Downtrend?USUALUSDT is currently displaying a very compelling technical structure on the daily timeframe. After a long downtrend since early 2025, the price is now forming an accumulation pattern with increasing buying pressure.
---
📊 Pattern & Chart Structure Overview:
🔹 Descending Triangle Formation:
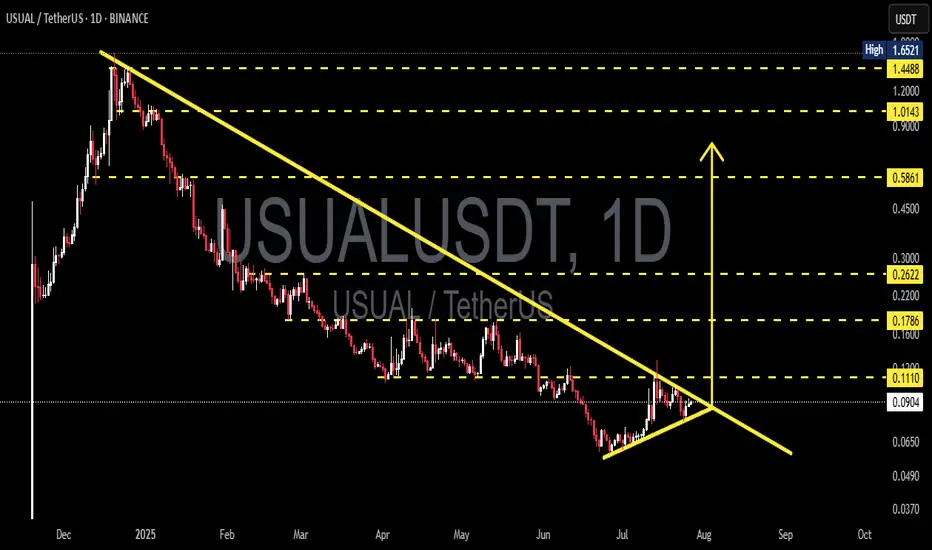
The price has been forming a series of lower highs with a gradually rising base, indicating a classic compression or accumulation pattern that often precedes a major breakout.
🔹 Rising Buying Pressure:
Notice the formation of higher lows since early July—this suggests that buyers are gradually stepping in, despite the macro downtrend still intact.
🔹 Low Volume = High Breakout Potential:
Volume remains relatively low, which is typical in the final stages of consolidation. Once a breakout occurs, it’s likely to be accompanied by a significant spike in volume.
---
🟢 Bullish Scenario (Confirmed Breakout):
If the price breaks above the descending trendline (~0.1110) with a strong daily candle and increased volume, it may ignite a bullish move with the following targets:
🎯 Upside Targets:
1. 0.1786 – Previous consolidation resistance
2. 0.2622 – Psychological zone and prior seller control area
3. 0.5861 – Medium-term target if momentum builds
4. 1.0143 and 1.4488 – Long-term bullish targets upon full trend reversal
🚀 The upside potential is massive as the price has a lot of room above once resistance is broken.
---
🔴 Bearish Scenario (Failed Breakout):
If the price gets rejected at the descending resistance and breaks down below the ascending support:
📉 Downside Targets:
1. 0.0650 – Minor support from July's accumulation zone
2. 0.0490 – 0.0370 – Previous cycle lows and potential bounce zones
⚠️ A breakdown would invalidate the current accumulation setup and suggest sellers still dominate.
---
🔍 Conclusion & Strategy:
USUALUSDT is now at a critical decision zone. The combination of a descending triangle, rising higher lows, and low volume makes it clear that a major move is brewing.
📌 Breakout = Big swing trade opportunity
📌 Breakdown = Avoid entries, wait for lower support zones
---
📈 Trader Recommendations:
✅ Set alerts above 0.1110
✅ Confirm breakout with strong candle + volume
✅ Aggressive stop loss below 0.0750
✅ Swing trade targets based on historical resistance & fib levels
#USUALUSDT #CryptoBreakout #AltcoinSetup #DescendingTriangle #CryptoAnalysis #BullishSetup #BearishSetup #BreakoutIncoming #TechnicalAnalysis
USUALUSDT Forming Falling WedgeUSUALUSDT is currently displaying a falling wedge pattern, a powerful bullish reversal signal in technical analysis. This formation typically precedes a breakout to the upside, particularly when accompanied by increasing volume, which is present here. The compression of price within the wedge signals diminishing selling pressure and a buildup of momentum, potentially setting the stage for a strong rally. The expected upside for this setup is projected between 90% to 100%+, making this an attractive opportunity for traders seeking mid to long-term gains.
Investor interest in the USUAL project is steadily growing, likely due to its unique positioning and use-case within the broader crypto and DeFi ecosystem. As awareness around smaller-cap tokens with strong fundamentals and appealing chart structures increases, USUAL is becoming a notable mention. This trend of renewed interest often acts as a catalyst, pushing price action significantly once technical confirmation is met.
The falling wedge is nearing its apex, indicating a possible breakout is imminent. Traders should closely monitor key resistance levels for a decisive breakout candle supported by high volume. Once this occurs, rapid movement toward key resistance zones and Fibonacci targets can be expected. Historically, similar setups on altcoins have yielded quick and sizable returns post-breakout.
With market sentiment improving and technical indicators aligning, USUALUSDT may be poised for a major bullish breakout. It’s a pair worth watching for traders who focus on breakout patterns, trend reversals, and volume-based confirmations.
✅ Show your support by hitting the like button and
✅ Leaving a comment below! (What is You opinion about this Coin)
Your feedback and engagement keep me inspired to share more insightful market analysis with you!

USUALUSDT 1D Analysis USUAL ~ 1D Analysis
#USUAL Buy gradually from here with a short term target of at least 15%+ from here. These are the early signs when whales start to accumulate.

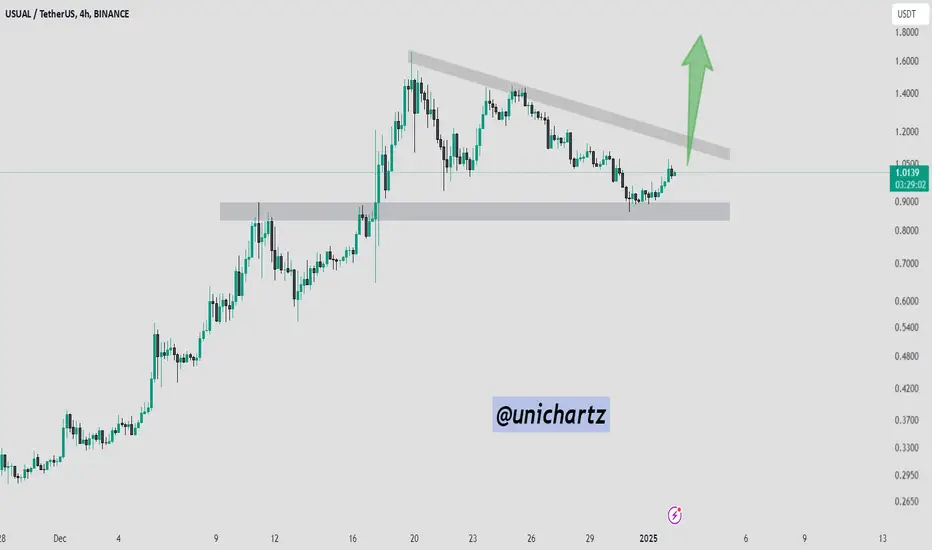
Key Support Holds: USUAL/USDT Eyes a Bullish Breakout USUAL/USDT pair is showing a strong rebound from the key support zone, suggesting a successful retest of the breakout levels. However, the price is currently facing rejection from the descending, narrow resistance zone.
Based on the current setup, we predict a breakout from this zone, potentially leading to further bullish momentum in the coming sessions.