USUAL/USDT — End of Pressure? Breakout or Breakdown Ahead📊 Full Analysis (Daily Chart):
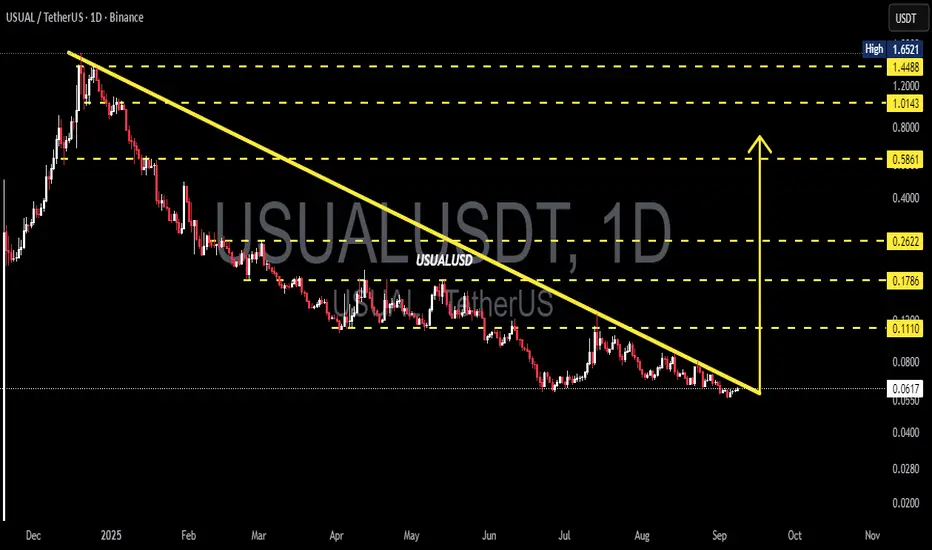
Since peaking around $1.65, USUAL/USDT has remained under heavy selling pressure, forming a clear long-term downtrend with a descending trendline acting as a major resistance. Price is now trading near $0.0614, exactly at the critical $0.05–0.07 support zone.
The structure is shaping into a descending triangle, where price keeps making lower highs while holding a flat support base. This pattern is often seen as a bearish continuation, but if bulls manage to break above the trendline with strong volume, it could trigger a major trend reversal.
---
🔼 Bullish Scenario (Potential Reversal)
Trigger: Daily close above $0.07–0.08 with convincing volume.
Extra confirmation: Successful retest of the broken trendline as new support.
Upside targets:
1. $0.1110 (minor resistance)
2. $0.1786 (mid supply zone)
3. $0.2622 – $0.5861 (major recovery levels if momentum expands).
Risk management: Stop loss below $0.05 to avoid false breakouts.
📌 Interpretation: A breakout could signal the end of prolonged selling, inviting bargain hunters and possibly triggering a short squeeze rally.
---
🔽 Bearish Scenario (Continuation of the Downtrend)
Trigger: Daily close below $0.05 with heavy selling volume.
Downside targets: $0.03 → $0.02 (psychological support levels + measured move projection of the descending triangle).
Risk management: For shorts, stop loss above $0.075–0.08.
📌 Interpretation: If the support base fails, the descending triangle confirms as a bearish continuation pattern, likely driving price to new lows.
---
🔎 Technical Pattern in Play
Descending Triangle: A structure often seen as bearish, but also a potential launchpad if broken upward with volume.
Breakout Case: A strong bullish breakout would flip market sentiment and shift momentum upward.
Breakdown Case: Failure to hold support would accelerate downside pressure.
---
🎯 Trading Outlook
USUAL/USDT is now at a make-or-break level. Price compression between the trendline and support is setting up for a decisive move. Patience is key here — waiting for a daily close with strong volume confirmation is safer than guessing the direction.
Short-term traders may play the current range, while swing traders should wait for a confirmed breakout or breakdown before committing to larger positions.
---
#USUAL #USUALUSDT #CryptoAnalysis #Altcoin #TechnicalAnalysis #Breakout #Bearish #Bullish #DescendingTriangle
Usualprotocol
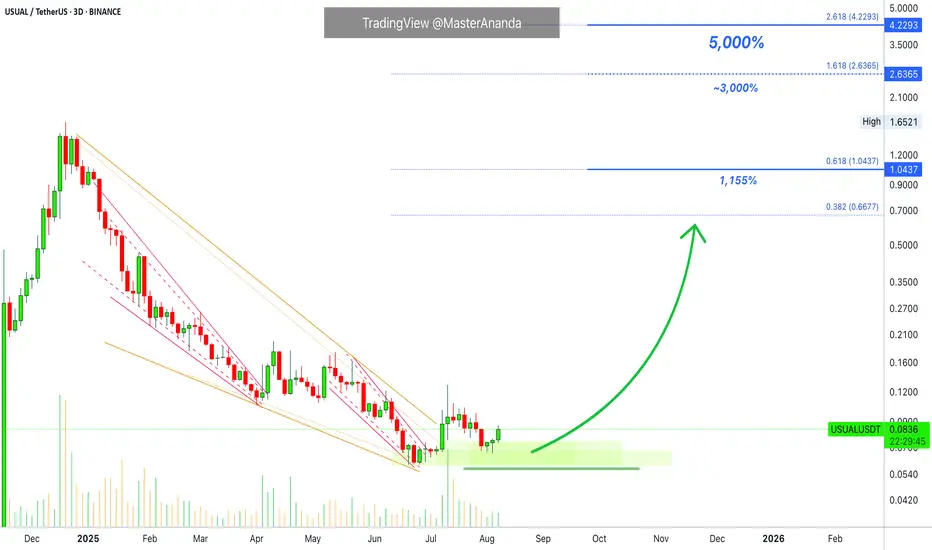
Usual Protocol 5000% Bullish Potential ExposedThe highest volume since December 2024 happened last month, July. This is a high volume bar that signals the bulls are back in the game.
As USUALUSDT was moving lower volume was also dropping. After the bottom was hit, volume did rise but on the buying side. The bearish wave lost its momentum and ran its course.
This is going to be a huge project. I should say, this trading pair will produce big gains. You can see with me the huge growth potential shown on the chart. These numbers are based on the 2024 high, and we have 3,000% and 5,000% potential for growth. Imagine what numbers we would get if we had data coming from 2021.
Some pairs I mention more than others because they are safe and have huge potential for growth. It is easier to choose if you see a pair often.
When in doubt, keep reading.
If you don't know what to choose and there are too many options, then you need to read some more. There is always time and the market always offers a second chance. Keep reading and everything becomes clear.
It is normal to not understand at first. It is normal to start understanding things after several weeks. It is very normal to have a map of what is happening after just a few months. You will be able to tell the difference easily from when you are reading and when you are not. The market is not going away. But, if you want to know what the market is actually doing, read @MasterAnanda
Thank you for your continued support.
Namaste.