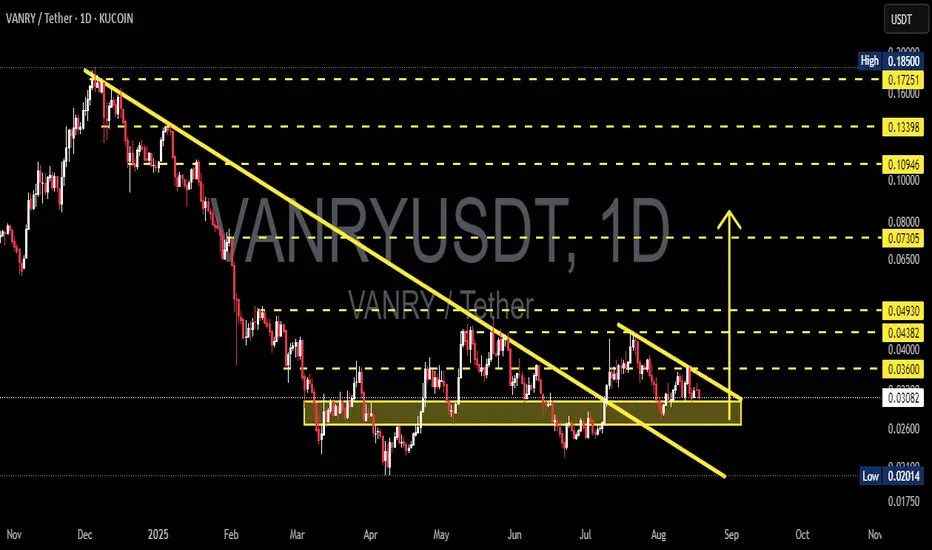
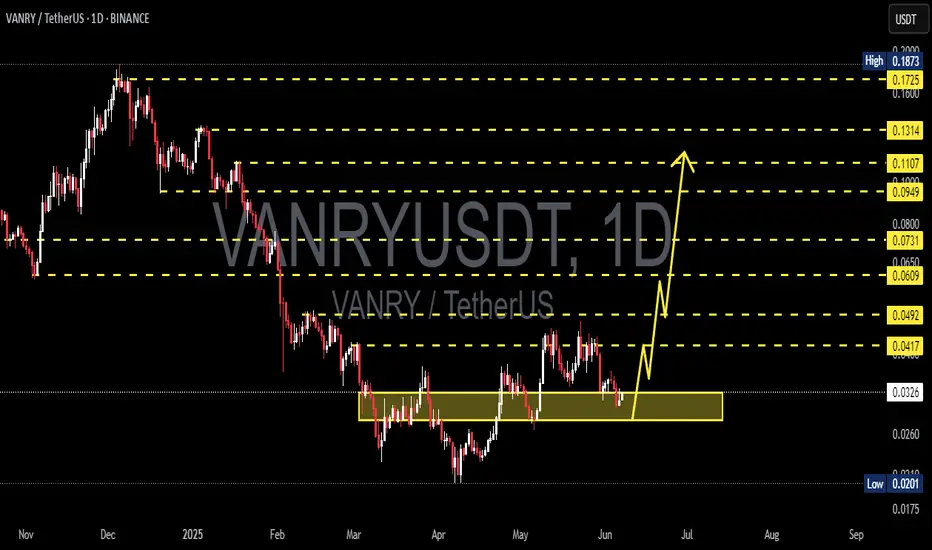
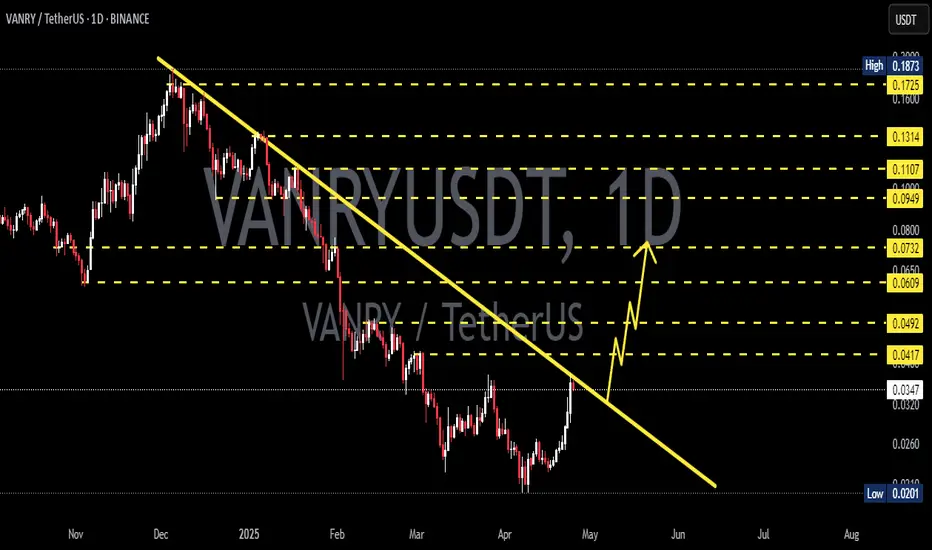
VANRY/USDT — Critical Support, Accumulation or Breakdown?The VANRY/USDT pair on the 2D timeframe is currently at a decisive stage. After a prolonged downtrend since early 2025, price is now consolidating at the key support zone of 0.02014 – 0.02362 USDT (yellow box). This zone has acted as a strong “buyer defense” multiple times in the past and remains highly significant.
---
🔎 Technical Overview
1. Main Trend: Overall downtrend remains intact, but price is showing signs of sideways / re-accumulation at the lows.
2. Support Zone: 0.02014 – 0.02362 → the foundation for any potential reversal.
3. Key Resistance Levels:
0.03367 – 0.04414 → nearest resistance and first breakout test.
0.07673 – 0.11156 – 0.13336 – 0.16694 – 0.18500 → extended upside targets if bullish momentum strengthens.
4. Volume: Breakouts must be supported by increasing volume to confirm strength; without it, risks of false breakout remain high.
---
🟢 Bullish Scenario
If price holds above 0.02014 and forms a bullish reversal candle, first target lies at 0.03367 (TP1).
A confirmed breakout above 0.03367 opens the door to 0.04414 (TP2), with extended targets up to 0.07673 – 0.11156.
Conservative strategy: wait for a confirmed 2D close above 0.03367.
Aggressive strategy: enter near support with tight SL below 0.020 (higher risk but high R:R).
Example R:R (entry 0.0236, SL 0.019):
TP1 = 0.0336 → +42% upside, R:R ≈ 2.18.
TP2 = 0.0441 → +86% upside, R:R ≈ 4.4.
---
🔴 Bearish Scenario
A confirmed breakdown below 0.02014 with strong volume signals bearish continuation.
Next major target sits near 0.014, a psychological and historical support level.
False breakdowns (bear traps) are possible — watch for rapid recoveries back above support.
---
📌 Chart Pattern
Currently forming a horizontal range / box consolidation at the bottom of a downtrend.
Possible double bottom or accumulation pattern if support holds and a reversal forms.
Failure to hold → pattern shifts into bearish continuation breakdown.
---
🎯 Conclusion
0.020 – 0.0236 zone is the key battleground.
Holding support → potential for reversal rally.
Breakdown → bearish continuation toward 0.014.
Traders can adjust based on risk profile: conservative wait for breakout, aggressive trade support with tight SL.
For long-term investors, this zone could be an accumulation area, but risk of deeper downside remains.
---
#VANRY #VANRYUSDT #crypto #altcoin #support #resistance #breakout #bearish #bullish #priceaction #riskmanagement
Vanryusdtanalysis

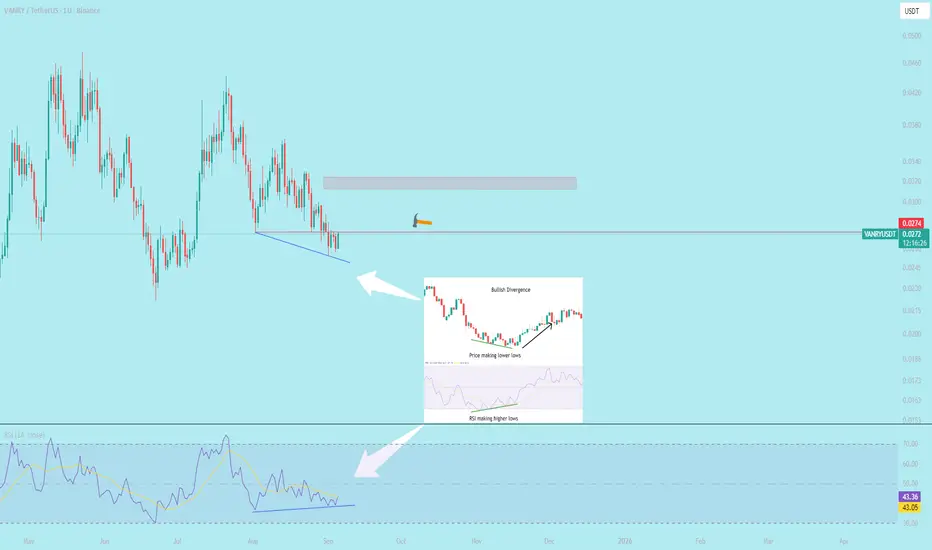
$Vanry LOOKS Bullish with (RSI) bullish divergence The Relative Strength Index (RSI) bullish divergence is a pattern in technical analysis that signals a potential upward reversal in an asset's price. It occurs when an asset's price reaches lower lows, but the RSI, a momentum oscillator, forms higher lows.
VANRY/USDT – Symmetrical Triangle, Major Breakout Approaching!🔎 Chart Overview
VANRY/USDT is currently in a consolidation phase after a prolonged downtrend since early 2025. Key observations:
Price is stuck inside the demand zone 0.028 – 0.036 USDT (yellow box), which has acted as strong support for months.
A symmetrical triangle pattern is forming, indicating accumulation before a decisive move.
The descending trendline is still pressing the price down, but the apex is approaching → a major breakout or breakdown is imminent.
---
🚀 Bullish Scenario
Trigger:
✅ Daily close above 0.036 USDT with strong volume → breakout from the triangle and descending trendline.
Potential targets:
🎯 First target: 0.040 – 0.04382 USDT (minor resistance + triangle height projection).
🎯 Next target: 0.04930 USDT (key resistance).
🎯 With strong momentum: extension toward 0.07305 USDT, and potentially 0.109 – 0.133 USDT in the mid-term.
Additional bullish confirmation:
Successful retest of 0.036 as new support after breakout.
Increased buying volume confirming buyer dominance.
---
🐻 Bearish Scenario
Trigger:
❌ Daily close below 0.030 – 0.028 USDT → breakdown of the demand zone and triangle.
Potential targets:
🎯 First target: 0.026 USDT.
🎯 Next target: 0.024 USDT (triangle breakdown projection).
🎯 If selling pressure intensifies, price may revisit the historical low at 0.02014 USDT.
Additional bearish confirmation:
Breakdown supported by high volume.
Weak or no rebound after falling below 0.028.
---
📌 Conclusion
VANRY is at a critical stage. The symmetrical triangle within the demand zone signals price compression that will soon resolve.
A breakout above 0.036 USDT could spark a strong rally.
A breakdown below 0.028 USDT could open the way toward 0.02014 USDT.
👉 Key levels to watch: 0.036 (bullish breakout) and 0.028 (bearish breakdown) with daily close and volume confirmation.
#VANRY #VANRYUSDT #CryptoAnalysis #PriceAction #SymmetricalTriangle #Breakout #CryptoTrading #AltcoinAnalysis #TechnicalAnalysis
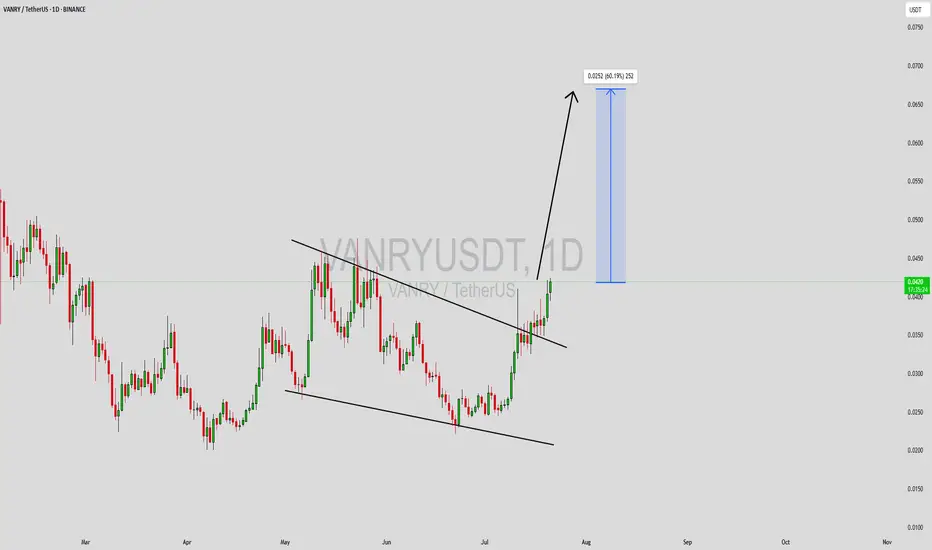
VANRYUSDT Forming Potential BreakoutVANRYUSDT is currently showing a potential breakout pattern, making it one of the more exciting altcoins to keep an eye on in the short term. The price structure has tightened in recent sessions, often a precursor to explosive movement. With strong volume backing the recent price action, the possibility of an upward breakout becomes increasingly likely. Based on the technical setup and broader sentiment, an expected gain of 50% to 60%+ could be achievable in the coming weeks if momentum sustains.
Vanar Chain (VANRY) is beginning to catch the attention of investors due to its innovative blockchain infrastructure and expanding ecosystem. As the project builds utility and demonstrates consistent development, interest from both retail and strategic backers is on the rise. This growing traction is contributing to the observed increase in trading activity, further fueling the potential breakout scenario from a technical standpoint.
The current chart suggests price consolidation near a key resistance level, which, once breached, could trigger a significant upward push. Traders watching this setup may consider entering upon confirmation of the breakout with volume, targeting higher levels based on recent price history and measured move projections. This makes VANRYUSDT an attractive play for breakout traders and momentum investors.
✅ Show your support by hitting the like button and
✅ Leaving a comment below! (What is You opinion about this Coin)
Your feedback and engagement keep me inspired to share more insightful market analysis with you!
VANRY/USDT: Major Breakout from Downtrend – Is This the Start?
After months of downward pressure, VANRY/USDT has finally shown a strong technical breakout, potentially marking a shift in momentum and the beginning of a bullish phase.
📊 Technical Pattern & Market Structure
🔻 1. Descending Trendline Breakout
Price has successfully broken above a long-term descending trendline that has capped the market since November 2024. This breakout is a key signal of a potential trend reversal, suggesting the sellers are losing control.
🟨 2. Accumulation Zone Breakout
For over 3 months, the price consolidated within a clear accumulation zone between 0.02600 – 0.03300 USDT. The breakout from this zone indicates that accumulation may be complete, and price is now entering a markup phase.
🔁 3. Retest Confirmation
After the breakout, VANRY has successfully retested the previous resistance as new support (0.03300 – 0.03500), confirming the breakout as valid. This is often considered a textbook bullish setup.
✅ Bullish Scenario
As long as the price holds above the breakout zone, the bullish outlook remains intact. Key resistance levels to watch:
Target Price Level Notes
🎯 Target 1 0.04393 USDT Minor resistance
🎯 Target 2 0.04902 USDT Key psychological level
🎯 Target 3 0.07311 USDT Mid-term bullish target
🎯 Target 4 0.10610 – 0.13427 USDT Long-term rally potential
🚀 Final Target 0.17085 USDT Previous swing high
> As long as price sustains above 0.035, these targets remain highly achievable in the coming weeks.
❌ Bearish Scenario
In case of a failed breakout or rejection from key resistances, the bearish case still exists:
🔻 Drop below 0.03200 could signal a failed breakout
📉 Downside targets: 0.02700 → 0.02200 → 0.02014 (strong historical support)
⚠️ Daily close below 0.03100 confirms a potential fakeout
🎯 Trading Strategy & Risk Management
Ideal Entry Zone:
→ Retest range of 0.03300 – 0.03550
Stop Loss:
→ Below 0.03100 (invalidates bullish thesis)
Take Profit Levels:
→ Scale out profits at 0.043 / 0.049 / 0.073 / 0.106 etc.
> Using a trailing stop or scaling out strategy can maximize profits as the trend develops.
🔍 Technical Summary
This is a classic Breakout + Retest setup. The combination of trendline breakout, horizontal resistance flip, and retest creates a high-probability bullish pattern.
From a Wyckoff perspective, this could be the transition from accumulation to markup phase, especially if volume increases.
📢 DISCLAIMER:
This analysis is for educational purposes only and does not constitute financial advice. Always do your own research and manage risk accordingly.
#VANRY #VANRYUSDT #CryptoBreakout #AltcoinSetup #BullishRetest #DescendingTrendlineBreakout #CryptoTechnicalAnalysis #WyckoffAccumulation #BreakoutStrategy
VANRYUSDT 1D AnalysisVANRY ~ 1D Analysis
#VANRY Buy back gradually from here if you still have confidence in this coin with a short term target of at least 15%++
VANRYUSDT 1D Analysis VANRY ~ 1D Analysis
#VANRY Buy gradually after successfully breaking through this resistance line with a short-term target of at least 15%+ And long term target $0.185
VANRYUSDT 1D VANRY Analysis VANRY ~ 1D Analysis
#VANRY Buy back gradually from here if you still have confidence in this coin with a short term target of at least 15%+ from here.
#VANRY/USDT#VANRY
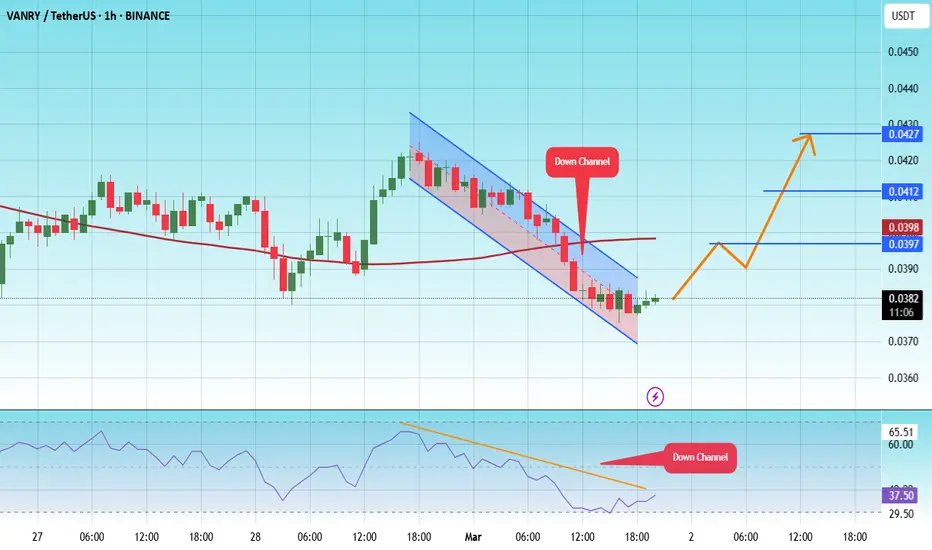
The price is moving in a descending channel on the 1-hour frame and is expected to continue upwards
We have a trend to stabilize above the moving average 100 again
We have a descending trend on the RSI indicator that supports the rise by breaking it upwards
We have a support area at the lower limit of the channel at a price of 0.0374
Entry price 0.0381
First target 0.0397
Second target 0.0412
Third target 0.0427
VANRYUSDT 1D AnalysisVANRY ~ 1D Analysis
#VANRY Buy after successfully penetrating this resistant line with a short -term target of at least 10%+ from here.
VANRY Long Trade SetupOn 4hr time frame, clean Change Of Character (ChoCh) has been observed indicating sign of strength. Price is at demand , Stoploss: 0.022, Targets: 0.0423 & 0.05

VANRYUSDT 2DVANRY ~ 2D Analysis
#VANRY on Time Frame 2D retesting this support,. buy from here if you still have Conviction on this coin. with a minimum target of 20%++

VANRY planThis is my VANRY plan, I'm expecting a bounce around the 0.75 fib level. That is where I will enter

VANRY/USDT:Preparing for a Breakout After Reboundng from supportVANRY/USDT: Preparing for a Breakout After Rebounding from Trendline Support
VANRY/USDT is showing promising signs 📈 as it bounces off a strong trendline support and makes its way toward a critical resistance zone 📊. The pair is setting up a potential breakout scenario 💥, which could ignite a powerful bullish rally 🚀. Stay alert and wait for confirmation before taking action 👀.
Key Insights:
1. Trendline rebound: VANRY/USDT has successfully held its ground at a key trendline support, showing strong buyer interest at this level.
2. Approaching resistance: The price is now nearing a significant trendline resistance. A breakout above this zone could lead to substantial bullish momentum.
3. Bullish signals: Momentum indicators such as RSI and MACD are recovering and aligning with a bullish outlook ⚡.
Steps to Confirm the Breakout:
Monitor the resistance zone: Watch for a 4H or daily candle closing above the trendline resistance 📍.
Check trading volume: A noticeable surge in volume during the breakout is critical to confirm strong buyer activity 🔥.
Look for a retest: A successful retest of the broken resistance as new support can validate the breakout ✅.
Beware of fake-outs: Keep an eye on sharp reversals or wicks above the trendline that can indicate false breakouts ⚠️.
Risk Management Strategies:
Use stop-loss orders below the trendline support to limit potential losses 🔒.
Position sizing should be aligned with your overall trading plan to manage risk effectively 🎯.
Outlook:
If the breakout occurs, VANRY/USDT could kickstart a significant bullish rally, providing excellent trading opportunities for those who plan their entries wisely.
This analysis is for educational purposes only and not financial advice. Always conduct your own research (DYOR) 🔍 before making investment decisions.

VANRYUSDTVANRY ~ 1D
#VANRY If you have Conviction on this coin. This support block is a very good price to start buying again.

VANRYUSDTVANRY ~ 1D
#VANRY If you have Conviction on this coin. This support block is a very good price to start buying again.

VANRYUSDT is gearing up for a big jump!!VANRYUSDT is showing strong bullish potential after successfully breaking key resistance levels and completing a healthy retracement. It’s maintaining its position above the 200 EMA, indicating a solid uptrend, supported by good trading volume. We’re expecting a significant upward movement soon. now is the time to watch this pair closely! Don't miss out on the opportunity to capitalize on this potential breakout! 📈
VANRYUSDT Currently trading at $0.11
Buy level: Above $0.109
Stop loss: Below $0.102
TP1: $0.114
TP2: $0.118
TP3: $0.13
TP4: $0.14
Max Leverage 3x
Follow Our Tradingview Account for More Technical Analysis Updates, | Like, Share and Comment Your thoughts

VANRYUSDT Is on Critical Rebound or Deeper Decline Ahead?Yello, Paradisers! Is #VANRYUSDT at a make-or-break moment? Let’s dive into this potential move and what it means for your next trade.
💎#VANRY’s price is currently sitting on a crucial demand zone, and a rebound here is necessary for any continued upward movement. If we see this bounce, the price is likely to push higher, especially since the recent pattern has already broken to the upside. The first target will be the minor resistance area, where we might see a reaction. However, if VANRY successfully breaks through that minor resistance, there's a strong probability we’ll witness a significant upward move, with the next target being the major resistance level.
💎On the downside, if VANRY fails to rebound from the demand zone around 0.093 and breaks below it, the price could revisit the major support area. Historically, this zone has been respected multiple times, with the price rebounding each time it was tested.
💎The bullish scenario becomes invalid if VANRY fails to rebound at the major support level of 0.0786, and the daily candle closes below 0.093. In this case, we could see a continuation of downward movement and further dips ahead.
Stay focused, patient, and disciplined Paradisers.
MyCryptoParadise
iFeel the success🌴

VANRYUSDTVANRY ~ 2D
#VANRY Do you have Conviction on this Coin. If yes, you need to pay attention to this key Support. We think it's going to be a pretty strong reversal from here.

VANRYUSD 1DVANRY ~ 1D
#VANRY Make small purchases in these demand zones. with a minimum target of 15%+

#VANRY has the potential to go 5x!🚀About Vanar Chain
Welcome to the world of VANAR Chain, a cutting-edge blockchain ecosystem where efficiency, speed, and security converge. At the heart of this revolutionary platform is VANRY, our native gas token, designed to fuel transactions and smart contract operations within the VANAR Chain.
Our strategy is to accumulate the coin on every dip. This means that when the price experiences a temporary decrease or correction, we take advantage of the lower prices to increase our position in the coin. This approach is based on the belief that the overall trend of the coin is positive and that buying during dips could lead to potential profits when the price rises again.
We highlight the relatively mid-cap market capitalization of $279 million for #VANRY, which could be seen as an opportunity for growth, especially in challenging market conditions. Smaller and mid-cap market caps have the potential for higher volatility and greater price movements.
The accumulation zone for VANRY is above $0.196.
#DYOR

#VANRY/USDT TREAD SETUP#VANRY TRADE SETUP
VANRY breaks this symmetrical triangle pattern and correctly retests it, We anticipate a significant bounce of up to 70% to 100% following the breakout of this pattern.
Entry: CMP and add up to $0.178
DYOR, NFA
#Crypto

VANRYUSD 1DVANRY ~ 1D
#VANRY Make purchases gradually from here, or buy after successfully breaking through the resistance line of this pattern, with a minimum target of 15%+
