See if it finds support near 0.2983 and can rally
Hello, fellow traders!
Follow us to get the latest information quickly.
Have a great day!
-------------------------------------
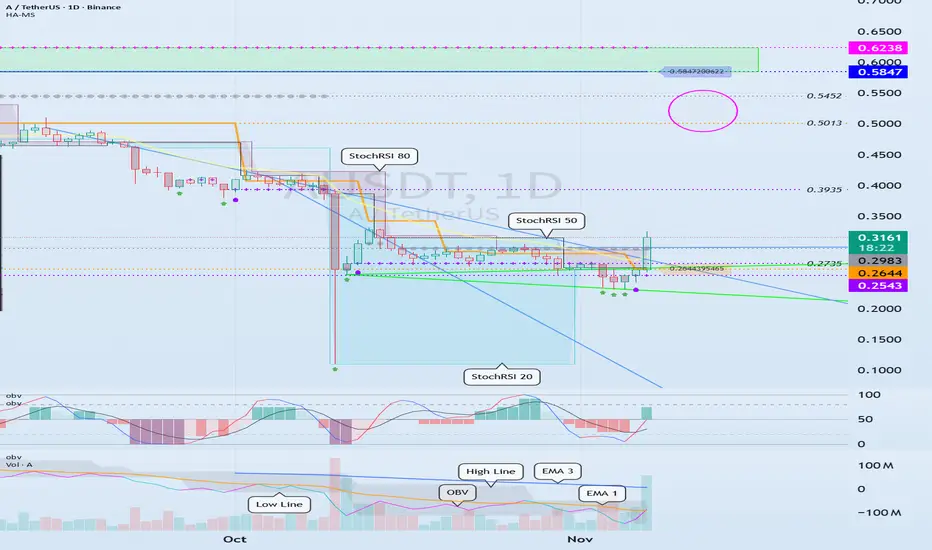
(AUSDT 1D chart)
The StochRSI indicator was added shortly after the chart was created.
The key is whether it can find support around 0.2644-0.2983 and rise to around 0.5847.
-
To sustain the uptrend, the price must remain above the StochRSI 80 level.
Therefore, whether support is found around 0.2983 is crucial.
The basic trading strategy is to buy in the DOM(-60) ~ HA-Low range and sell in the HA-High ~ DOM(60) range.
However, if the price rises in the HA-High ~ DOM(60) range, a stepwise upward trend is likely, while a decline in the DOM(-60) ~ HA-Low range is likely to lead to a stepwise downward trend.
Therefore, a split trading strategy is recommended.
The end of a stepwise downward trend is an uptrend, and the end of a stepwise upward trend is a downtrend.
Therefore, when the price is near the HA-Low or HA-High indicators, it's time to focus on finding a trading opportunity.
-
To sustain an uptrend after breaking above a key point or range,
1. The StochRSI indicator must be trending upward. If possible, it should not be overbought.
2. The TC (Trend Check) indicator must be trending upward. If possible, it should remain above the zero level.
3. The On-By-Value (OBV) indicator must be trending upward. If possible, it should remain above the High Line.
If the above conditions are met, the uptrend is more likely to continue.
-
Thank you for reading to the end.
I wish you successful trading.
--------------------------------------------------
Vaulta
EOS — old / A — new. After the rebrand. 10 10 2025Comparative analysis. The old EOS chart history (8 years) and its continuation in the new coin A (Vaulta), after the rebranding.
EOS on exchanges that haven't yet rebranded . On some exchanges (usually low-liquidity ones and DEXs), the old ticker is still trading. They're swaying the price, and the order book is half-empty, so they can sell off the remaining coins on the exchanges. You can exploit this volatility at your own risk, but remember, you could end up holding a coin that's impossible to sell anywhere if EOS isn't exchanged for A, and EOS is delisted, and then, later, A is listed.
A (Vaulta) is trading on exchanges that supported the rebranding and the exchange of the old for the new without any hassle. The chart shows a 3-day timeframe.
Secondary trend. The downtrend, which has formed a channel, is currently dominant.
Local trend. The short targets of the descending triangle, which was broken downwards, are currently being fulfilled.
Currently, there is sideways consolidation at the median of the descending channel, which could become a descending flag if support is broken, opening the way to the lower zone of the channel. Then, a reversal to the upper part of the channel.
If, after consolidation, the price moves up , then the movement towards resistance of the descending channel. A breakout will break the trend, or return to the descending channel according to its logic.
In the medium and long term , it's worth accumulating this Vaulta (working from zones and for a breakthrough), but don't overdo it. It's important to understand that this is a scam project, albeit one with a large marketing slant and the support of contractors from the “money masters” of the USDT issuer and a bunch of liquid exchanges. EOS is the longest-running ICO, and the most lucrative one. “Investors” have buried (let's be honest, they've laundered) billions of dollars in it. Therefore, it's possible, like the already scammed EOS, they'll exploit their brainchild during a "hamster isn't scared" period—a repeat of 2017 and a shot in the arm for a repeat of the scam (not likely).

EOS -> Vaulta : (0.5013 support is the key)
Hello, traders.
If you "Follow", you can always get new information quickly.
Have a nice day today.
-------------------------------------
EOS switched from banking to blockchain during the network reorganization.
(AUSDT 1D chart)
The key is whether it can rise to around 0.5013 and receive support.
If not, it is likely to show a step-down trend.
-
(4h chart)
In terms of day trading,
Support range: 0.4942-0.4822
Resistance range: 0.5959-0.6394
We need to see whether it can receive support and rise in the above range.
However, since the M-Signal indicator of the 1D chart is passing around 0.5013, it is important to see how the volume profile formed around this area and 0.5389 will rise.
-
Thank you for reading to the end.
I hope you have a successful trade.
--------------------------------------------------
- Here is an explanation of the big picture.
(3-year bull market, 1-year bear market pattern)
I will explain the details again when the bear market starts.
------------------------------------------------------

EOS (rebranding to Vaulta) - Technical & Sentiment OutlookKeeping it simple: I've outlined a clear trading channel on the chart. Following recent news about the "EOS" rebrand to "Vaulta" Banking in May 2025, it appears we've already formed a local double bottom around the $0.40 level.
The next logical short-term target is $1.20, which I expect could be reached by the end of May, provided momentum continues.
Beyond that, the long-term potential opens up significantly. I've highlighted my long-term target zone in yellow, while the bold green levels represent more speculative, optimistic scenarios—likely achievable only in the event of a broader altcoin supercycle.
My realistic long-term price target stands at $6, which I believe is entirely attainable under favorable conditions. Anything beyond that would be considered a bonus.
