Divi’s Laboratories — Technical Breakout SetupDivi’s Laboratories — Technical Breakout Setup
CMP: ₹6,686
Stop Loss: ₹6,200
Target: ₹8,233
🔍 Price Action View
Divi’s Lab is shaping up very clean technically. The structure resembles a Cup & Handle / VCP (Volatility Contraction Pattern) with a rounding bottom, where each consolidation leg is getting progressively smaller.
This compression of volatility, along with higher lows and tight consolidation near the top, clearly indicates strong accumulation. Such setups often lead to powerful upside expansion and can precede a fresh all-time high move.
A box consolidation breakout looks imminent (possibly this week). That said, with the broader market remaining choppy, execution discipline is critical.
⚠️ Trading Approach
This is a patience trade, not a momentum chase
Controlled position sizing is essential
Let the price structure work over time
Avoid over-leveraging; give the setup enough room
⚠️ Clarification:
This is an independent analysis based purely on technical and market study. No part of Religare is involved in this view or recommendation.
📝 Important:
I am not responsible for any loss or profit incurred. I am not taking any fees for these views – just sharing my analysis for educational and informational purposes.
📉 Disclaimer:
Not SEBI-registered. Please do your own research or consult a financial advisor before taking any investment decision.
Vcppattern

Technical Analysis is All About Pattern RecognitionNYSE:RDDT : The Cup-and-Handle and VCP Breakout Setup
RDDT has established a clear "rhythm": after a two-month consolidation, it consistently reclaims the 20-day SMA (Red Line), followed by a volatility contraction phase where the price stops making new lows.
The stock just completed a Cup-and-Handle pattern, forming a 1 to 1.5-month Volatility Contraction Pattern (VCP) before breaking out, signaling that supply has been fully absorbed.
The recent +5.23% move on expanding volume successfully cleared the $240 psychological level, marking a fresh breakout from the consolidation high. This "breakout within a base" confirms that the trend is ready for its next leg higher.
Summary: By reclaiming the SMA 20 and breaking out of the tightest part of the pattern, RDDT is showing a high-probability continuation signal. As always, manage your risk and keep stops below the previous swing low.

IIFL CAPITAL SERVICES – Pre-emptive Breakout | ATH Setup📲 IIFL CAPITAL SERVICES – Pre-emptive Breakout | ATH Setup 🔓
📌 Trade / Swing Setup
• CMP: ₹377
• SL: ₹321
• Targets: ₹448 → ₹575 → ₹704
📍 Structure & Logic
• Long consolidation completed
• Rounding bottom / VCP (Volatility Contraction Pattern) in formation
• Price compression after base = energy build-up
• Structure supports a pre-emptive move towards all-time highs
🧠 Approach:
• This is a structure-based swing / positional setup, not a chase
• Patience, discipline & controlled position sizing required
• Avoid excitement — let the structure work
⚠️ Clarification:
Independent technical view based purely on market study. No part of Religare involved.
📉 Disclaimer:
Not SEBI-registered. Please do your own research before taking any investment decision.

NEGG VCPReasoning:
Strong Industry/Sector
50MA Pullback
If Labelled a Swing trade(2-6 Week Holds)
Entry: Full position on breakout
Profit Taking: Sell 1/3 at Goal 1
Final Exit: Remainder at Goal 2
If labelled a long term trade (3-12 Month Holds)
Entry: Full position on breakout
Profit Taking: Sell 1/4 to 1/5 at Goal 1
Exit Signal: Close below 20-day EMA (your trend guide) or 50EMA
Why: Strong moves are hard to time at the top, but the 20EMA acts as a reliable trend filter
Note:
Remember: Every long-term investment alert can also be played as a swing trade.
I normally use half the risk that I show here, this is because I am okay re-entering if it fails and it gives a better R/R ratio

#BHARATFORG - VCP BO in DTFScript: BHARATFORG
Key highlights: 💡⚡
📈 W Bottom Patter in the WTF
📈 VCP BO in DTF
📈 Volume spike seen during Breakout
📈 MACD Bounce
⚠️ Important: Always Exit the trade before any Event.
⚠️ Important: Always maintain your Risk:Reward Ratio as 1:2, with this RR, you only need a 33% win rate to Breakeven.
✅Boost and follow to never miss a new idea! ✅
Disclaimer: I am not SEBI Registered Advisor. My posts are purely for training and educational purposes.
Eat🍜 Sleep😴 TradingView📈 Repeat 🔁

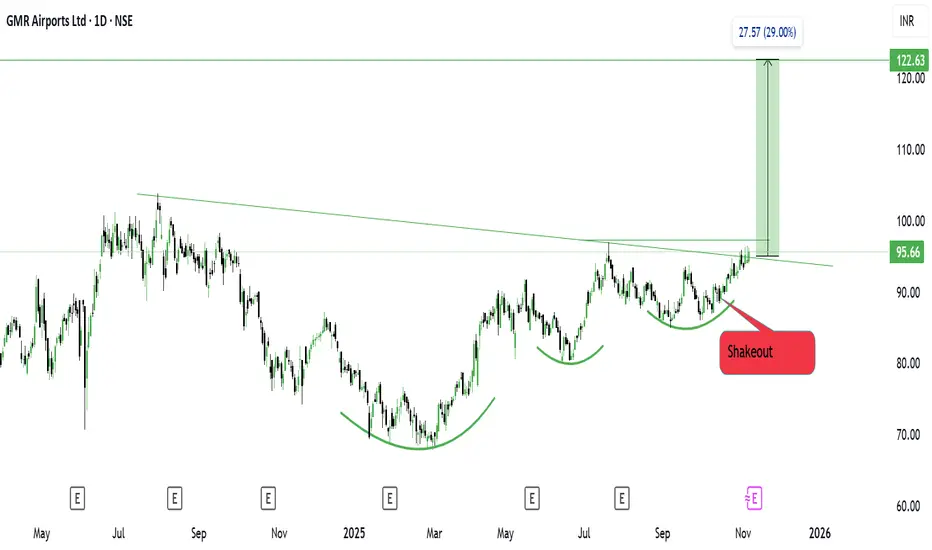
GMR Airports Ltd – 3T VCP Breakout FormationGMR Airports Ltd – 3T VCP Breakout Formation
NSE:GMRAIRPORT
📈 Pattern & Setup:
GMR Airports is setting up a classic 3T Volatility Contraction Pattern (VCP) on the daily chart. The stock has gone through three clean contraction phases, each with tighter price swings and reduced volatility — a textbook sign of institutional accumulation.
The latest shakeout near 85-90 acted as a final test, shaking out weak hands before the price started tightening just below the descending trendline. Now it’s attempting a breakout above the 95–96 zone, supported by a noticeable uptick in volume.
The entire structure represents controlled absorption — supply drying up, volatility compressing, and price coiling for a potential expansion move.
📝 Trade Plan:
✍Entry: Above 97 (decisive breakout confirmation)
🚩Stop-Loss: 91 (below last contraction low)
🎯Targets:
Target 1 → 110
Target 2 → 122.50 (approx. 29% potential move)
💡 Pyramiding Strategy:
1. Enter 60% position above 97 with a high-volume breakout
2. Add 40% above 101 after follow-through candle
3. Trail stop-loss to 94 once price sustains above 106
🧠 Logic Behind the Setup:
The 3T VCP setup shows tightness and volume contraction after a broad base — a clear footprint of smart money accumulation. Once the breakout triggers, volatility expansion can drive a swift move toward the upper targets.
Keep Learning. Keep Earning.
Let’s grow together 📚🎯
🔴Disclaimer:
This analysis is for educational purposes only. Not a buy/sell recommendation. Please do your own research or consult your financial advisor before trading.
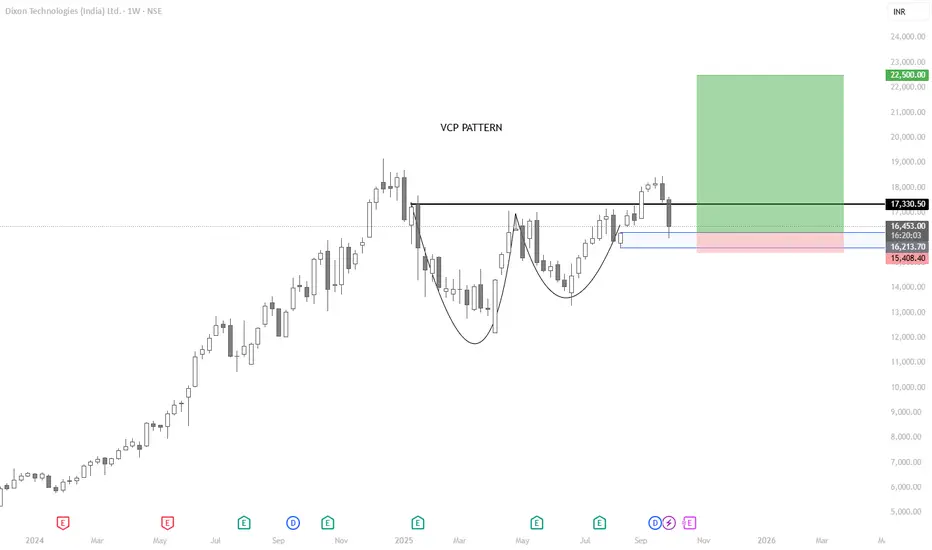
DIXON - VCP setup with good RRDIXON - a perfect vcp pattern with good RR. Expecting TGT 22500. SL 15500 WCB
SUDARSHANCHEMSUDARSHANCHEM showing very good strength and consolidating since a month near ATH. Result is expected tomorrow on 25-Aug. If it declares bumper result then we may see next leg of steep rally. In recent time accumulation has been observed. Provided that if it closes above 1380 level then one may get very good risk-reward trade from hereon. Keep a stock in watch list. Just a small volume may push it above resistance line.

TFCILTDTFCILTD seems too strong and trading above all resistance zone. Strong volume has also been observed. Support can be seen near 275 levels. Seems too promising. Keep it on radar

BIKAJI : Breakout Candidate#bikaji #vcppattern #vcpsetup #trendline #breakout
BIKAJI : Swing Trade
>> Good Strength in stock
>> Volumes Dried up
>> Trendline Breakout
>> VCP Structure - Ready to Blast
>> Low Risk High Reward Trade
Swing Traders can lock profit at 10% and keep trailing
Disc : Charts shared are for Study Purpose, Do your own Analysis and consult your Financial Advisor before taking Position in it. Take Position as per Proper Risk Management.
Pls Boost, Comment & Follow us for More Learnings.

Rigetti Computing to breakout soonRigetti Computing Inc NASDAQ:RGTI – Breakout Trade Setup 💪🔥🚀
Entry: Above $12.50 for confirmation
Stop Loss: $10.50 to manage risk
Target: $31.63 based on measured move projection
Risk-Reward Ratio: High potential reward compared to risk
Why This Trade? 📚💡
The stock has been consolidating under a descending trendline and is attempting a breakout. High volume suggests strong buying interest. The measured move target shows significant upside potential.
Risk Management ☔
Use a tight stop below $10.50 in case of a false breakout. Consider scaling out profits near $20 to lock in gains before reaching the full target. Monitor price action for confirmation.
Final Thoughts ✅
RGTI presents a strong breakout opportunity with high growth potential. Watch for sustained momentum before entering the trade.

Insecticides - Poised for a 25% upmove Swing Trade1) The stock is about to break out of a multi year Trend Line, 2017, 2022 in Monthly timeframe.
2) The stock is in up trend in all major time frames.
3) Daily shows a god trigger of a breakout soon indicated through a Volatility contraction Pattern.
For a 3% SL, 25% Targets expected , around 1000 Rs.
My entries - 789
SL - 767 Daily closing Basis
Target Around 1000
Sector : Chemical - Momentum Sector - AGroChemical.

BJCORP. Classic stock after 1998 crisis 18/July/24Berjaya Corporation. A Conglomerate in Malaysia where many investors have xx experience .. after 1998 Asia Fianacial crisis. But with coming "new"....

Swing Trade Idea- SANDHAR TechnoSwing Trade Idea- SANDHAR
Entered at 580,
T1 610
T2 630
Let' see how it reacts in this volatile market!

Bharat Dynamics (BDL): Cup & Handle or VCPBharat Dynamics which was already in nice uptrend has currently taken a pause.
When it was move up, it formed big range candle with big volume (in May month), then when it halted, its first pulled back with lower volume.
Whenever there is green candle, there is big volume and where there is red candle there is low volume.
Volume completely dried at second pullback, it means less and less supply is coming, supply is getting absorbed.
So could be the short term trading good opportunity.

Long Term Breakout in Grindwell Norton
Strong relative strength on hourly TF
sharp v shaped reversal after failed BO in feb
Breakout and retest done of a multiyear base
uptick in volume and volatility
Entry 2628 SL 2425 target 3RR

Electronica Mart India Ltd #EMIL After a monster post IPO rally EMIL has been cooling off for 6 months, forming a nice base to potentially launch another rally
Showing v strong Relative Strength on hourly TF
hovering on the top of a 27%/ 25wks base
forming an inverse head & shoulders type pattern
Volatility falling and volume drying up
Entry 225 SL 211 Target 3RR

Anuh Pharma - The Non-stop Blaster, but its Just about to Start Anuh Pharma - Going non-stop. Another 6.3% up today. Multi-year VCP Pattern BO happening. Volume build up is good. Just let it sustain above 261 levels until Weekly Close for rockets to Fly....Target 320, 445 (Still 2x to go from here). But fresh entries wait for BO confirmation on weekly. Remember - this is a Monthly Pattern. Even WEEKLY confirmation of BO is not good enough, but atleast we need to wait for this minimum
Disclaimer:
3+ Years Teaching Experience in Stock Market - Technical Analysis, Advanced Patterns, Emotional Management, News based Trading...
We are NOT SEBI Registered and Our focus is NOT providing Buy/Sell Recommendations/calls. Primary Objective is to provide detailed analysis of how to review a chart, explain multi-timeframe views purely for Educational Purposes.
We strongly suggest our followers to "Learn to Ride the Tide irrespective of its Side"
*** Important *** Consult your Financial Advisors before taking any positions
If you like our detailed analysis, please do rate us with your Likes, Boost and share your comments
-Team Stocks-n-Trends

Pidilite is back breaking out of a VCPBullish on my Long term holding.. Its broken out of a consolidation above 2700 after a VCP was formed for a long time..
T1 3300
T2 3700
T3 4100

Solarinds all coiled up. Ready for an explosive move 🧨Stock has made beautiful VCP pattern and Volatility and volume have both dried up suggesting that there may be no more sellers left. The Q3 result has also been declared. One can also see a clear triangle pattern although the stock has not broken out. To me it looks set to make new highs.

ASX:BXB - Brambles perfect volatility contraction before 🌋 ASX:BXB
Simple price action analysis for Brambles stock listed in Australian market
gives you clear understanding how VCP pattern works
I don't have position , no recommendation

Understanding the Volume Contraction Pattern (VCP)The VCP is an essential pattern for swing traders, as it signals the potential for a significant price move. The pattern occurs when a stock goes through a series of contractions in price and volume, indicating that selling pressure is waning and the stock is setting up for a potential breakout.
Key Components of VCP:
Trapped Buyers (TBs): These are investors who bought at the peak and are now "trapped" in a position as the stock price declines. They are likely to sell when the price gets back near their purchase price, creating resistance.
Loss Cutting (LC): As the stock declines, some investors will cut their losses and sell their positions, adding to the downward pressure.
Profit Taking (PT): Once the stock rebounds, those who have profits from buying at lower prices may start to take profits, which can lead to a temporary reversal or pullback in price.
Bottom Fishers (BFs): These are investors who are looking to buy the stock at what they perceive to be a bargain price, often near the lows of the pullbacks.
Stages of VCP:
Initial Decline (1): The stock experiences a significant drop in price, often on high volume, indicating strong selling pressure.
First Contraction (2): The price begins to stabilize and contract. Volume diminishes here, suggesting that selling pressure is decreasing.
Advance (3): The stock price rises, potentially leading to TBs selling near their break-even points. This can create resistance, but if the stock can move past this level, it's a positive sign.
Second Contraction (4): A higher low is formed compared to the initial low. Volume contracts further, indicating selling pressure continues to wane.
Subsequent Advance and Contractions (5): The pattern repeats, with each pullback being shallower and on lower volume, showing that supply is being absorbed and demand is taking over.
Breakout (6): Finally, the stock breaks out from the VCP on increased volume, signaling that demand has overwhelmed the remaining supply.
Trading the VCP:
When trading the VCP, look for the following:
A series of at least two contractions in price range and volume.
Each contraction should be shallower than the last, showing less and less selling pressure.
The breakout should occur on higher volume, confirming the pattern.
Entry Point: A trader might enter a position as the stock breaks out from the final contraction.
Stop Loss: A stop loss can be placed under the most recent low of the last contraction to limit risk.
Profit Target: Targets can be set based on previous resistance levels or a multiple of the risk (stop loss size).
Remember, while the VCP is a strong pattern, it's not foolproof. Always use proper risk management and consider the overall market conditions before taking a trade.

SMMT - FLAT BASEI bought my positions today
September 18, 2023
The reasons:
1. The stock offers a low-risk entry point
2. It developed a textbook flat base setup
3. It has VCP characteristics
4. It has a high relative strength
5. It outperforms the general market
6. Volume dries up and huge volume on the breakout
Flaw:
The market is still in a hard-penny environment with only 33.8% of total stocks above the 200-day MA.
