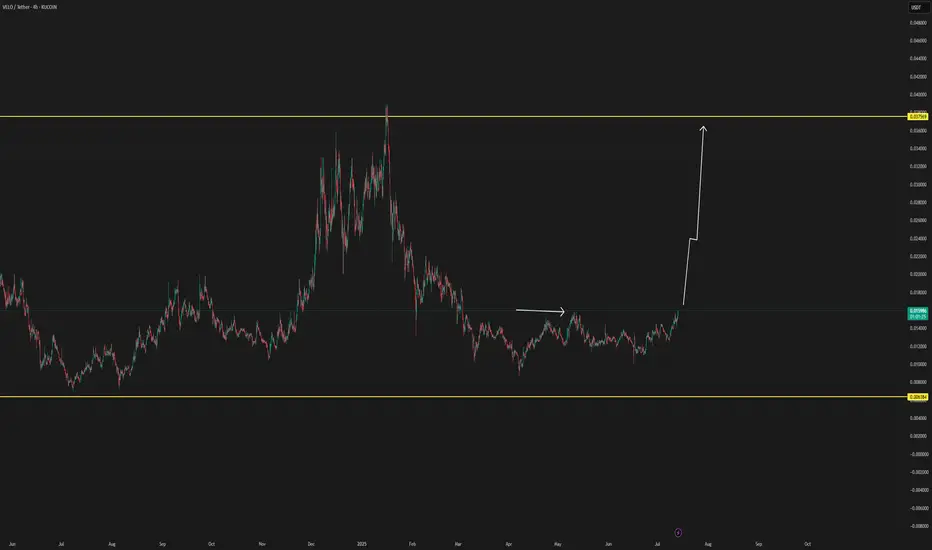
VELO can reach upper targets 18% gain toward 0.0084$Hi
i can see more gain for VELOusdt if the price break this trendline to the upside potential of 18% gain at least toward 0.0084$ is logical
Velo

VELO price analysis — Potential End of Correction?CRYPTOCAP:VELO has been trading inside a broad multi-year range, and current price action suggests that the correction phase may be approaching exhaustion.
Key observations:
Price is near the middle boundary of a 4-year range
Volatility compression often precedes impulsive moves
Current market capitalization remains low at $100–120M
Potential upside scenario:
Conservative recovery target: $0.045–0.067
This represents a 600–1000% increase from current levels
As always, confirmation will be required from structure and volume expansion.
Until then, #VELO remains a high-risk, high-reward speculative setup.
👉 Do you see CRYPTOCAP:VELO as accumulation-worthy at these levels, or does the market need more time?
______________
◆ Follow us ❤️ for daily crypto insights & updates!
🚀 Don’t miss out on important market moves
🧠 DYOR | This is not financial advice, just thinking out loud

$VELO critical threshold | Either turn or fall The VELO chart has completed a retest after a classic Bearish Rising Wedge breakout.
It's currently heading directly towards the demand zone.
A strong reaction from here could lead to a return to the wedge; otherwise, a major decline could open the door.
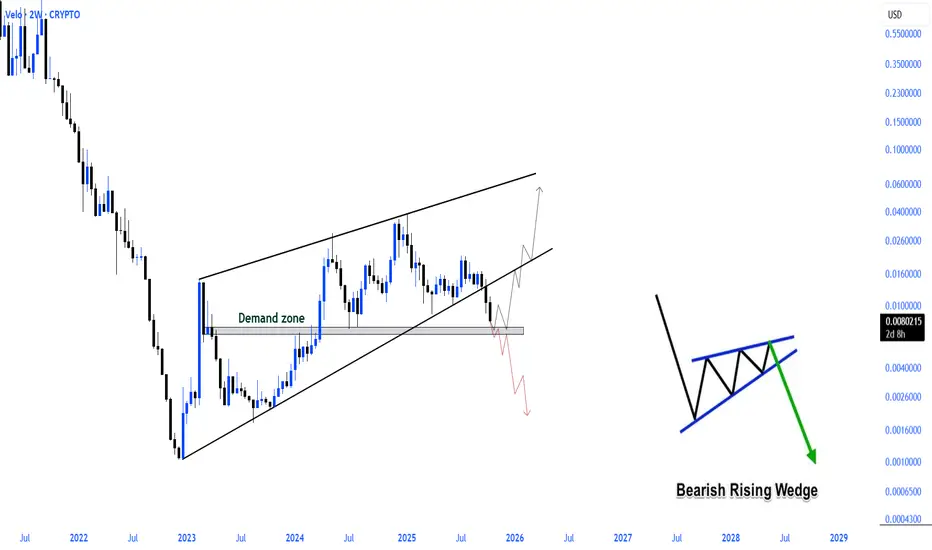
VELO: Moonvember Updates#VELO appears to have completed its corrective 2nd wave from the early 2025 peak, following a strong 2-year impulse wave that began in early 2023.
Passing $0.02 could confirm a bullish reversal, optimistically targeting the 2020–2021 price ranges.

BREAK 2.0 upcoming for VELO/USDTVELO/USDT has high chance to break in the coming hours, more updates later when there is more confirmations below this update
$VELO - Long Trade IdeaKUCOIN:VELOUSDT | 1D
Entry: .012 to .010
Stoploss: .08 (low)
TPs:
.0145 to .0156
.017 to .0194
.022 to .024

Velo Update, By Request (PP: Easy 265% - 358%)VELOUSDT is right now moving within a range that I call the "buy zone." This is a good place to buy in anticipation of a major bullish wave.
The chart situation is pretty simple and straight forward. After a multiple years long bottom formation, left side of the chart, we have a classic bullish trend; higher highs and higher lows.
The action is happening now at the lower boundary of this channel which is the time to buy. Smart people, experienced and successful traders buy here. At current prices or lower.
After just a few short days or maximum 2 weeks, we will have the start of the next bullish move, this will produce massive growth.
We can see easily 265% - 358% profits potential within 1-2 months.
Long-term, potential for profits goes many times higher, say 3-5 times higher than the numbers above.
I am keeping it simple.
Thanks a lot for your continued support.
Namaste.

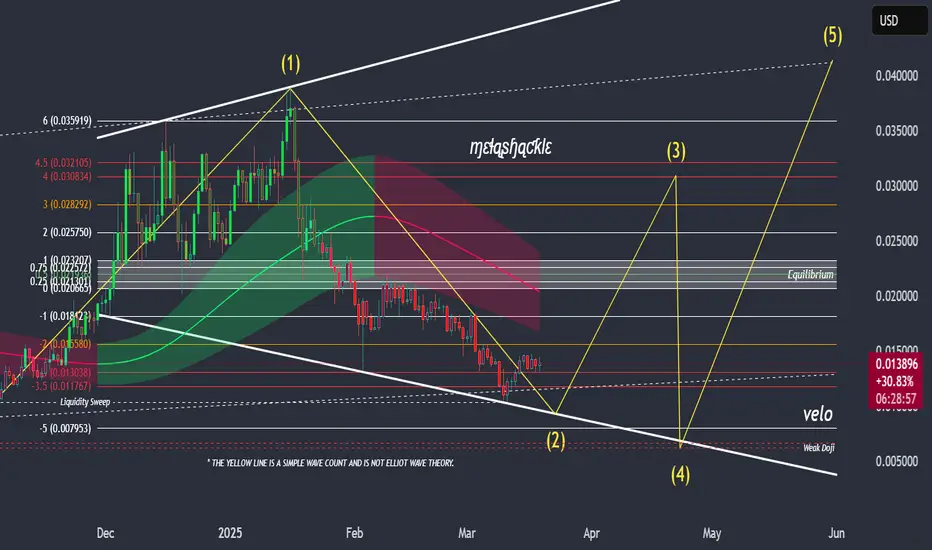
The current VELO chart with my 'April flash crash' thesis waves.VELO is currently trading towards the bottom of the range, which could be a good sign that it has, or will, bottom soon. Personally, I think it will hit a slightly lower level on the charts before breaking out in the third wave, which will align with the fifth wave on the other charts I’ve shared, incorporating my 'April flash crash' thesis.
Keep in mind, it doesn’t have to bottom before the third wave to occur, but I think it’s likely. I’ll reassess as more information comes out in the coming days/weeks.
Good luck, and always use a stop-loss!
Last update on VELO well this is the final update for sometime on VELO looks like the bloodbath was retesting the trendline well hopefully

little idea for velojust a trial for trading for velo on short term not taking but looking how it will perform and execute in short term NFA

VELO Ready for Its Next Big Move?As the crypto market continues to fluctuate, VELOUSDT is at a crossroads. Currently trading at $0.02188, the asset has retraced -43.85% from its recent peak of $0.038965 set just three days ago. This places it in a prime zone of interest for both bulls and bears. With a low RSI14 at 21.15, VELO is heavily oversold on the 1-hour chart, suggesting a potential rebound is on the horizon. Meanwhile, the 60-period MFI at 26.60 hints at waning selling pressure.
The emergence of consecutive VSA Buy Patterns in the past few sessions supports the hypothesis of a possible reversal. However, a break above the resistance at $0.026136 would provide stronger confirmation for a bullish move.
Could this be your chance to catch a trend early, or will VELO test deeper waters before turning? Keep an eye on these levels, and stay tuned for the next steps in its journey. Are you ready to trade with precision?
Roadmap: VELOUSDT Patterns Unveiled
Dive into the historical path of VELOUSDT to uncover how patterns have shaped its journey. This roadmap highlights confirmed moves, discarding noise to reveal actionable insights for traders.
1. VSA Manipulation Buy Pattern 2nd - January 19, 09:00 UTC
Main Direction: Buy
Opening Price: $0.023559 | Closing Price: $0.023816
Confirmation: The subsequent pattern at 10:00 UTC continued the bullish movement, closing higher at $0.022719 despite minor fluctuations. The direction aligned perfectly, validating the bullish forecast. This move showcased a strong rebound from a previous sell-off, marking a turning point for VELO.
2. VSA Buy Pattern Extra 1st - January 19, 10:00 UTC
Main Direction: Buy
Opening Price: $0.023816 | Closing Price: $0.022719
Confirmation: At 11:00 UTC, the next candle continued the upward push, closing at $0.02188. While the price dipped initially, it tested lower support levels before rebounding in alignment with the bullish signal. This pattern highlighted a retest scenario before breaking out to higher levels.
3. Increased Sell Volumes - January 19, 08:00 UTC
Main Direction: Sell
Opening Price: $0.025608 | Closing Price: $0.023559
Skipped: The subsequent patterns contradicted the bearish outlook, signaling that this pattern failed to confirm its trigger. This inconsistency marks it as a noise event in the roadmap.
4. VSA Manipulation Sell Pattern 2nd - January 18, 08:00 UTC
Main Direction: Sell
Opening Price: $0.02829 | Closing Price: $0.02705
Confirmation: The following VSA Buy Pattern Extra 1st at 07:00 UTC indicated a minor reversal, but the broader trend remained downward. The sell signal was validated as prices continued to respect resistance levels and declined further.
5. Increased Buy Volumes - January 18, 11:00 UTC
Main Direction: Buy
Opening Price: $0.026342 | Closing Price: $0.026624
Confirmation: Subsequent price action upheld the bullish move, rising toward $0.027213. This pattern was instrumental in identifying a shift in sentiment, with buyers reclaiming control after a prolonged sell-off.
Key Takeaways for Investors
Patterns like the VSA Buy Pattern 2nd consistently highlighted key turning points, offering valuable entry points.
Noise events such as "Increased Sell Volumes" underline the importance of trigger confirmation in trading decisions.
The roadmap demonstrates how aligning with confirmed patterns can improve forecasting accuracy and trading confidence.
VELOUSDT's historical patterns showcase the critical role of precise analysis in navigating market volatility. Ready to capture the next move? Follow the roadmap and take control of your trading game!
Technical & Price Action Analysis
Support Levels:
0.026136 – This level has been tested multiple times and shows solid buyer interest. If it breaks, expect it to flip into resistance, paving the way for lower action.
0.029519 – Another critical support zone. If buyers fail to hold this, sellers will likely push through, making it a tough ceiling on the next retest.
Powerful Support Levels:
0.037063 – This is the fortress for bulls. A breakdown here signals a significant shift in sentiment, with the level becoming a prime resistance to watch.
Resistance Levels:
0.034017 – This area has capped recent upside moves. If bulls can break and close above, it could signal a trend reversal. Otherwise, it’ll remain a tough nut to crack.
0.036148 – Another ceiling for the price. Watch how price reacts here; failure to break will likely lead to another round of selling pressure.
Powerful Resistance Levels:
0.013717 – Key battleground for sellers. A clear rejection here strengthens the bearish case. A break could open the floodgates for further bullish momentum.
0.011988 – Strong historical resistance; a failure to close above this confirms seller dominance, turning it into a high-confidence short zone.
0.010637 – This level acts as a line in the sand. A breakthrough could ignite new buying interest, but until then, it’s a key roadblock.
0.00956 – Bottom-line resistance. If bulls can’t clear this, the bears will likely dominate the near-term price action.
Failure to respect these levels can quickly flip them into critical zones for the opposite side of the trade. Stay nimble and keep your risk tight—the market’s watching, and so should you.
Concept of Rays: Trading Strategies Based on Dynamic Levels
Core Idea
My proprietary analysis method revolves around "Rays from the Beginning of Movement," constructed using Fibonacci mathematical and geometric principles. These rays form a system of dynamic levels to predict asset movements, emphasizing interactions rather than static levels. By analyzing price interaction with these rays, traders can infer scenarios of reversal or continuation—but only after confirming dynamic factors and patterns.
Why Specific Levels Are Not Predictable
Financial markets are complex, nonlinear systems influenced by numerous variables such as liquidity, market sentiment, and macroeconomic forces. Instead of pinpointing exact levels, we focus on probabilities at pre-determined zones. Rays provide key insights into the direction and intensity of price movements when these zones are engaged.
How Rays Work
Fibonacci Rays: Each ray aligns with significant angles derived from natural proportions and is anchored at the origin of movement.
Primary Advantage: Unlike traditional methods, rays are constructed from the movement’s starting point, enabling precise adjustments for new trends or corrections.
Adaptability: Rays dynamically adjust with emerging patterns, offering fresh insights into movement boundaries.
Ascending and Descending Rays: These define the movement channel’s limits and highlight interaction zones for potential entries.
Optimistic Scenario
If the price reacts positively to support levels, we expect movement along ascending rays to achieve successive targets:
First Target: $0.026136 (Resistance Level 1)—Price interaction suggests continued bullish momentum after breaking through.
Second Target: $0.029519—A key resistance zone where price momentum will likely face its next challenge.
Third Target: $0.034017—Major resistance that aligns with the upper boundary of dynamic rays and Moving Averages.
Pessimistic Scenario
If the price fails at resistance and interacts negatively with descending rays:
First Target: $0.02188 (Current Price Level)—A probable retest of support.
Second Target: $0.011988—Dynamic interaction with powerful support, marking a critical zone to evaluate bearish persistence.
Third Target: $0.00956—Final support level where sellers may dominate before potential consolidation.
Dynamic Factors
Moving Averages—Levels at MA50 ($0.02873) and MA100 ($0.03257) act as additional dynamic resistance points. Interaction here confirms strength or weakness.
VSA Rays—Key zones on the chart interact with Volume Spread Analysis rays to offer enhanced clarity. Price moves between rays, using each as a potential stepping stone.
Proposed Trades
Trade 1: Long Position from $0.026136 to $0.029519—Enter on interaction with ascending ray and confirmation of bullish momentum.
Trade 2: Short Position from $0.034017 to $0.02188—Triggered by rejection from upper resistance and descending ray.
Trade 3: Long Position from $0.011988 to $0.026136—A high-probability reversal from powerful support.
Trade 4: Short Position from $0.029519 to $0.011988—Dynamic resistance at MA100 confirms bearish continuation.
Price movement along these rays allows traders to predict targets confidently. The beauty of this method lies in its flexibility and reliance on real-time interaction, ensuring adaptability in any market scenario.
Got questions? Let’s discuss! Drop your thoughts and queries in the comments below—I’ll be happy to clarify or dive deeper into the analysis. Don’t forget to hit Boost and save this idea to revisit it later and see how the price follows the roadmap. Tracking key levels and reactions is the cornerstone of trading success.
By the way, my proprietary indicator automatically plots all the rays and levels you see here. It’s available privately, so if you’re interested, feel free to message me directly to learn more.
Need analysis for a specific asset? I’ve got you covered! I’m open to creating detailed markups—some I can share publicly, and others can be tailored exclusively for you. Whether it’s a broad market idea or a private strategy, let’s connect and find a solution that works for you.
Remember, these rays work across all assets, guiding price movements with uncanny precision. If you have assets you’d like analyzed, give this post a Boost and mention them in the comments—I’ll do my best to include them in future updates.
Finally, don’t miss out on more insights and strategies! Hit follow here on TradingView to stay updated with all my latest ideas and detailed analyses. Let’s navigate the markets together!

Bearish ascending wedge could signal a 50% - 75% drop in VELO.There have been four times previous on VELO'S weekly chart when price peaked out on the RSI. After this peak, VELO'S price has dropped between 75.6% to as high as 99.95% from the presented peak. 6 weeks ago, VELO flashed this same signal for the 5th time in its history, indicating that a drop to the bottom trend line of the current bearish ascending wedge pattern could be imminent in the medium term.
If this is the case, and this pattern plays out for a 5th time, there could be some really good discount prices coming to add to your positions.
I'm not a VELO fan, and will be passing on this regardless of price, but for those who do, this could be time to be very cautious.
Good luck, and always use a stop-loss!

VELO is moving back to previous levels!VELO has reached a partnership with BlackRock to tokenize assets. From a technical point of view, the chart looks like it is worth at least waiting for a recovery. It's also worth noting that thanks to the partnership with DWF Labs, the price could skyrocket above our plans at the time of tokenization via VELO for Asia.
Horban Brothers.

Decision time for VeloPrice consolidation at the resistance holding despite brutal Bitcoin price drop decision time coming in closer

VELO providing a potential 300% gain opportunityPrice is drawing to the weekly imbalance.
If it will be touched, I would like for a structure break to the upside an then enter a position.

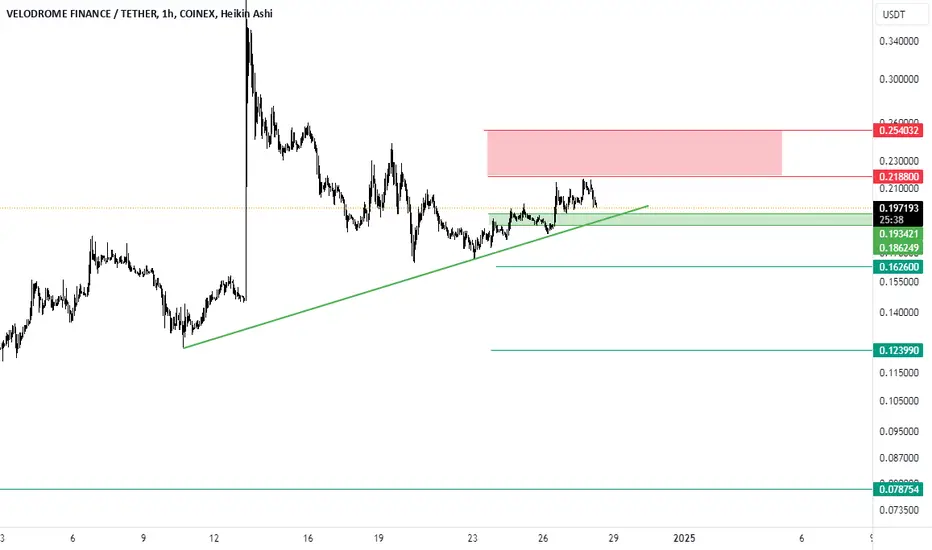
Velodrome Finance: Key Levels and the Calm Before the Break!!Imagine standing at the edge of a quiet lake in the early morning. The water is still, but you can feel something brewing—a ripple, a shift. That’s where Velodrome Finance (VELO/USD) is right now, hovering around key levels, poised for its next move.
If the price dips to the 50% retracement at $0.23-$0.21, it could find the momentum to push higher. A deeper move to the 61.8% retracement at $0.1770 might still hold promise for a rebound, but if it falls below this level, it’s best to step back and wait for a clearer setup.
On the upside, the target is clear: $0.50. It’s a move that could bring big opportunities, but only if VELO holds strong at these key levels.
This is the kind of moment that defines trading. It’s not about rushing or forcing a move—it’s about watching, waiting, and being ready when the time is right.
Wellness Tip: When the market feels uncertain, take a moment to reset. Step away from the screen, stretch, or just close your eyes for a minute. Trading isn’t just about the moves you make—it’s about staying calm and clear-headed no matter what comes next. 🌿✨
Kris/ Mindbloome Exchange
Trade What You See

Velo ready to break out?Simple chart like usual, Velo looks primed for a breakout here, MC still low should be able to make a few bucks. Drew some basic areas of interest above I expect a reaction in price, good luck!!

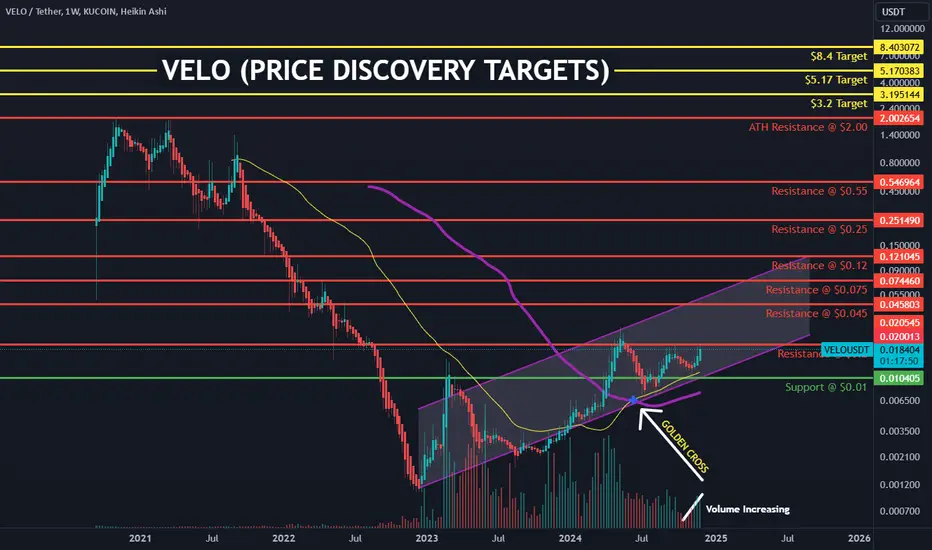
VELO Price Discovery Targets for later this cycleVelo has increasing volume and is holding strong to the golden cross from June on the weekly chart.
Resistances on the way to the All-Time High are
2c
4.5c
12c
25c
55c
$2 is the all-time high.
Once we break the ATH then the price discovery targets are
$3.2 - 17x
$5.17 - 27x
$8.4 - 45x
VELO Isn't Done Yet: Positioning for the Breakout!$VELO is shaping up nicely after the recent BMS action above the micro pivot. I'm adding some here, but leaving some space in case we get a dip into the 0.012 zone – that would be perfect for my final buys before a potential move higher.
The weekly and monthly charts are still lagging significantly compared to other coins, showing a stagnating trend. This tells me that while VELO is consolidating, it's not yet in a strong bullish phase. My strategy right now is to anticipate the next signal and position myself as close as possible to the deviation level for optimal risk/reward.
If we do see a deeper retrace, say down to 0.009, I plan to go heavy in at that level, but I doubt we’ll get that low in the short term. That’ll likely be a setup for a longer-term position trade, and I’ll provide an update if we start heading in that direction

VELO not giving a F?!Super strong setup! Following this super similar BTC move from 2018-2021
Once it takes out the high its about to set after the followed retrace: it's gone
If it falls back below resistance that would be a PITA! and lower prices would be expected
---
If you like my content, if it helps you gain profit, give it a like!
Thanks!
---
Hold my beer pls
----
No financial advice, do your own research, don't be stupid

VELO: $0.022 JedMcs next Big Thing | Think BTC XRP & STELLARgoogle is your friend
and time your best friend in the next 36months ++
good luck and all the best
and remember.. always reserve 60% of capital at any levels when the handler decides
to shake down free riders and liquidate speculators to accommodate new angels whales etc

Velo is this the way ?the same fractal that made us pump it would be a shame if same thing happens again lmfao
