#VET/USDT – Falling Wedge Breakout?#VET
The price is moving in a descending channel on the 1-hour timeframe. It has reached the upper limit and is heading towards breaking downwards, with a retest of the upper limit expected.
We have an upward trend on the RSI indicator, which has reached near the upper limit, and a downward reversal is expected.
There is a major resistance zone in green at 0.01300. The price has bounced from this zone multiple times and is expected to bounce again.
We have a trend of consolidation above the 100-period moving average, as we are moving close to it, which supports a downward move towards touching it.
Entry price: 0.01172
First target: 0.01150
Second target: 0.01122
Third target: 0.01080
Stop loss: Above the resistance zone in green.
Don't forget a simple thing: money management.
For inquiries, please leave a comment.
Thank you.
VET

#VET/USDT Traders watch VeChain 10% upside targeting 0.01176 ?#VET
The price is moving in a descending channel on the 1-hour timeframe. It has reached the lower boundary and is heading towards breaking above it, with a retest of the upper boundary expected.
We have a downtrend on the RSI indicator, which has reached near the lower boundary, and an upward rebound is expected.
There is a key support zone in green at 0.01022. The price has bounced from this level multiple times and is expected to bounce again.
We have a trend towards consolidation above the 100-period moving average, as we are moving close to it, which supports the upward movement.
Entry price: 0.01059
First target: 0.01090
Second target: 0.01129
Third target: 0.01176
Don't forget a simple principle: money management.
Place your stop-loss below the support zone in green.
For any questions, please leave a comment.
Thank you.

VET Retesting Falling Wedge Breakout ZoneVeChain previously traded inside a falling wedge after a prolonged bearish move. That structure has now broken to the upside, and price is currently retesting the former wedge resistance, which is acting as a key decision zone.
This retest is critical for short-term structure. If VET manages to hold above this reclaimed level and shows acceptance, continuation toward the next resistance zone around zero point zero one two two becomes likely, followed by a broader recovery toward the upper resistance region near zero point zero one eight.
On the bearish side, failure to hold this retest area would signal a failed breakout. In that case, price could rotate back toward the lower demand zone below zero point zero nine four, keeping the broader bearish structure active.
This setup is driven by falling wedge breakout mechanics, support resistance flip behavior, and post-breakout retest dynamics. Confirmation at this level will define the next directional move.

VET - BEARISH OUTLOOKNYSE:VET - Price Analysis 🟥
Very bearish chart 📉
Price confirmed a breakout under $ 0.0150, which is a multi-year support! 🚨
No buy pressure at the moment & H4 chart also looks like a bearish accumulation structure 📉
Prices could dump another 20 to 30% very easily without major support ahead.
Lower key levels I see: 0.0100− 0.00870 - $ 0.006500
Market conditions are pretty bad, but the chart also reflects the lack of demand!
Think about this: 2019's lowest demand/accumulation zone was around 0.0350 − 0.003300. If we move toward it, that would be another -60% bloodbath! 🚨

#VET/USDT Traders watch VeChain 10% upside targeting 0.01341 ?#VET
The price is moving in a descending channel on the 1-hour timeframe. It has reached the lower boundary and is heading towards breaking above it, with a retest of the upper boundary expected.
We have a downtrend on the RSI indicator, which has reached near the lower boundary, and an upward rebound is expected.
There is a key support zone in green at 0.01230. The price has bounced from this zone multiple times and is expected to bounce again.
We have a trend towards stability above the 100-period moving average, as we are moving close to it, which supports the upward movement.
Entry price: 0.01243
First target: 0.01280
Second target: 0.01308
Third target: 0.01341
Don't forget a simple principle: money management.
Place your stop-loss below the support zone in green.
For any questions, please leave a comment.
Thank you.

#VET/USDT Traders watch VeChain 10% upside targeting 0.01340?#VET
The price is moving in a descending channel on the 1-hour timeframe. It has reached the lower boundary and is heading towards breaking above it, with a retest of the upper boundary expected.
We have a downtrend on the RSI indicator, which has reached near the lower boundary, and an upward rebound is expected.
There is a key support zone in green at 0.01212. The price has bounced from this level multiple times and is expected to bounce again.
We have a trend towards consolidation above the 100-period moving average, as we are moving close to it, which supports the upward movement.
Entry price: 0.01264
First target: 0.01280
Second target: 0.01300
Third target: 0.01340
Don't forget a simple principle: money management.
Place your stop-loss order below the support zone in green.
For any questions, please leave a comment.
Thank you.

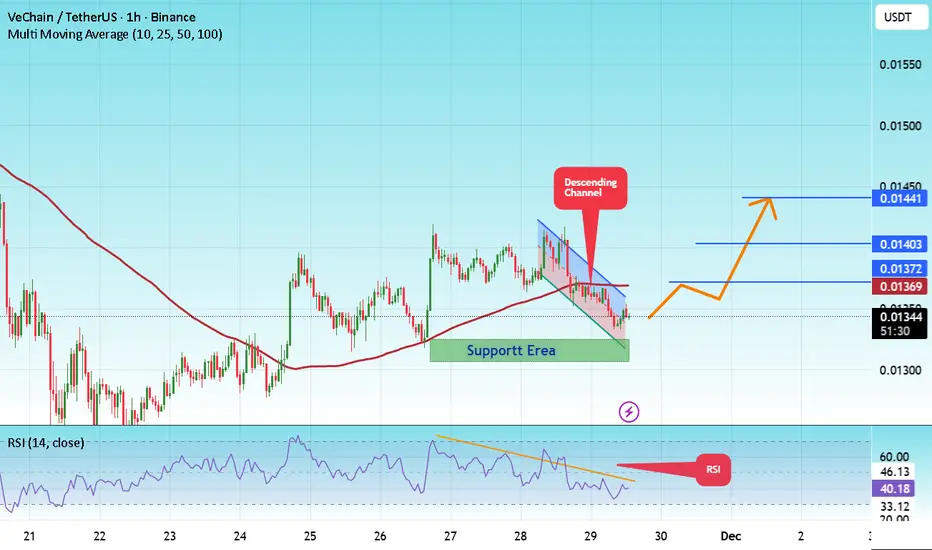
#VET/USDT Traders watch VeChain 10% upside targeting 0.01441 ?#VET
The price is moving in a descending channel on the 1-hour timeframe. It has reached the lower boundary and is heading towards a breakout, with a retest of the upper boundary expected.
We are seeing a bearish bias in the Relative Strength Index (RSI), which has reached near the lower boundary, and an upward bounce is expected.
There is a key support zone in green at 0.01320. The price has bounced from this level several times and is expected to bounce again.
We are seeing a trend towards stabilizing above the 100-period moving average, which we are approaching, supporting the upward trend.
Entry Price: 0.01345
First Target: 0.01372
Second Target: 0.01403
Third Target: 0.01441
Remember a simple principle: Money Management.
Place your stop-loss order below the green support zone.
For any questions, please leave a comment.
Thank you.
#VET/USDT Traders watch VeChain 10% upside targeting 0.01697 ?#VET
The price is moving in a descending channel on the 1-hour timeframe and is expected to break out and continue upwards.
We have a trend to stabilize above the 100-period moving average again.
We have a downtrend on the RSI indicator, which supports an upward move if it breaks above it.
We have a key support zone in green that pushed the price higher at 0.01580.
Entry price: 0.01608
First target: 0.01608
Second target: 0.01645
Third target: 0.01697
For risk management, don't forget your stop-loss and money management.
The stop-loss is below the support zone in green.
Upon reaching the first target, take some profit and then change your stop-loss order to an entry order.
For any questions, please comment.
Thank you.

#VET/USDT Traders watch VeChain 20% upside targeting 0.01820 ?#VET
The price is moving in an ascending channel on the 1-hour frame, adhering well to it, and is heading for a strong breakout and retest.
We have a bearish trend on the RSI indicator that is about to be broken and retested, which supports the upward breakout.
There is a major support area in green at 0.01700, representing a strong support point.
We are heading for consolidation above the 100 moving average.
Entry price: 0.01727
First target: 0.01750
Second target: 0.01780
Third target: 0.01820
Don't forget a simple matter: capital management.
When you reach the first target, save some money and then change your stop-loss order to an entry order.
For inquiries, please leave a comment.
Thank you.

VETUSDT UPDATE#VET
UPDATE
VET Technical Setup
Pattern: Falling Wedge Pattern
Current Price: $0.0172
Target Price: $0.0227
Target % Gain: 34.53%
Technical Analysis: VET is breaking out of a falling wedge pattern on the 4H chart, showing bullish momentum. The price has moved above the resistance trendline with steady volume, confirming the breakout and signaling potential continuation toward the upper resistance zone.
Time Frame: 4H
Risk Management Tip: Always use proper risk management.

#VET/USDT Traders watch VeChain 20% upside targeting 0.01800 ?#VET
The price is moving within a descending channel on the 1-hour frame, adhering well to it, and is heading for a strong breakout and retest.
We have a bearish trend on the RSI indicator that is about to be broken and retested, which supports the upward breakout.
There is a major support area in green at 0.01670, representing a strong support point.
We are heading for consolidation above the 100 moving average.
Entry price: 0.01700
First target: 0.01727
Second target: 0.01762
Third target: 0.01800
Don't forget a simple matter: capital management.
When you reach the first target, save some money and then change your stop-loss order to an entry order.
For inquiries, please leave a comment.
Thank you.

VETUSDT – Reaccumulation or Breakdown? Market Will Decide Here!VeChain (VET) has once again returned to its historical multi-year support zone, a level that has consistently acted as institutional accumulation territory around $0.012 – $0.017.
Every touch of this zone in the past has triggered massive bullish reversals, leading to multi-fold rallies. Now, VET stands at this critical juncture once again — and how it reacts here could determine its direction for the coming months.
The latest weekly candle shows a long downside wick, signaling strong buy-side absorption after a potential liquidity sweep.
This could be the early stage of a re-accumulation phase, but confirmation will only come if the price closes the week above this yellow support box.
---
Structure & Pattern Overview
Macro trend: still forming lower highs since 2021 → overall bearish pressure remains dominant.
Key zone: the horizontal yellow box serves as a boundary between capitulation and reversal.
Price structure: potentially shaping a long-term double bottom pattern if this area holds.
Momentum: gradually slowing down — a classic sign of supply exhaustion before a possible macro reversal.
---
Bullish Scenario – “Rebirth from the Base”
If the weekly candle closes above $0.017, VeChain could trigger a strong recovery move:
1. Bullish confirmation through a strong green weekly candle → validates accumulation zone.
2. Upside targets:
R1: $0.031
R2: $0.050
R3: $0.067
3. A breakout above $0.067 may open the door to $0.164 – $0.25, replicating the previous bull cycle.
4. Rising volume would confirm growing institutional interest and mark a shift in market sentiment.
---
Bearish Scenario – “Break of Faith”
On the flip side, a weekly close below $0.012 would signal a macro breakdown:
1. Failed retest at the yellow zone → confirms the end of long-term accumulation.
2. Downside targets:
Initial: $0.0077 (historical low and next liquidity pocket).
3. Any short-term bounce after breakdown is likely to be a dead cat bounce, not a true reversal.
---
Strategic Takeaway
VeChain now stands at its most critical juncture in over three years.
This is not just another technical level — it’s a battlefield between conviction and fear where smart money defines the next macro trend.
Bullish bias: if weekly closes above $0.017 → expect re-accumulation and a potential swing toward $0.03–$0.05.
Bearish bias: if the support breaks → prepare for a retest of $0.0077 before a new bottom forms.
Swing traders should wait for weekly confirmation before taking large positions, while long-term investors may consider gradual scaling within this range — but only with clear risk management.
---
#VET #VeChain #VETUSDT #CryptoAnalysis #AltcoinSetup #SwingTrade #CryptoMarket #SupportZone #TechnicalAnalysis #CryptoReversal #BuyTheDip #SmartMoney

#VET/USDT Traders watch VeChain 20% upside targeting 0.01790 ?#VET
The price is moving in a descending channel on the 1-hour frame and is expected to break and continue upward.
We have a trend to stabilize above the 100 moving average once again.
We have a downtrend on the RSI indicator that supports the upward move with a breakout.
We have a major support area in green that pushed the price higher at 0.01680.
Entry price: 0.01690.
First target: 0.01717.
Second target: 0.01743.
Third target: 0.01790.
To manage risk, don't forget stop loss and capital management.
When you reach the first target, save some profits and then change the stop order to an entry order.
For inquiries, please comment.
Thank you.

VeChain (VET) – Key Support Test & Long SetupVET is currently retesting a major support zone, presenting a solid opportunity for a long spot position ahead of what could be a Q4/year-end rally.
📉 Entry Zone: $0.0215 – $0.02245
📈 Targets:
• TP1: $0.026 – $0.028
• TP2: $0.03 – $0.0325
🛑 Stop Loss: Below $0.02

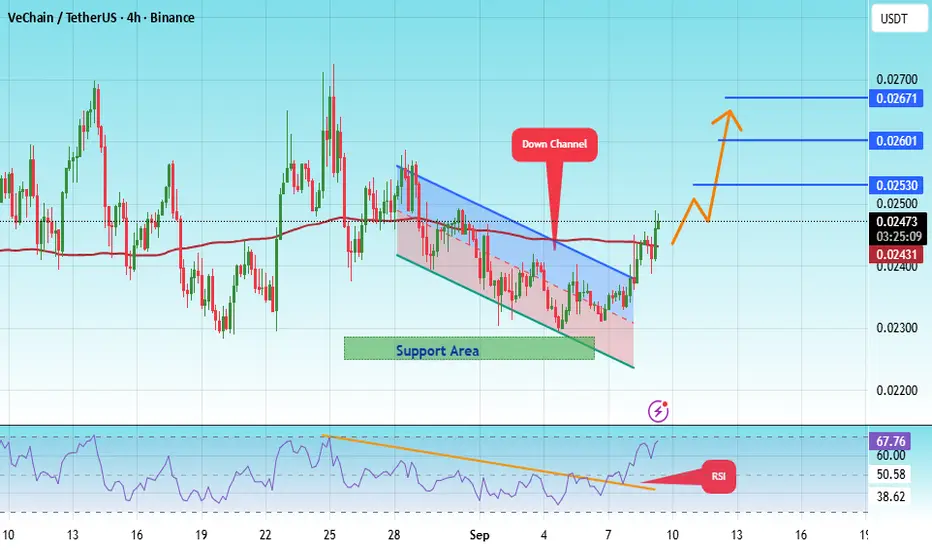
#VET/USDT Traders watch VeChain 20% upside targeting 0.02671 ?#VET
The price is moving within a descending channel on the 4-hour frame, adhering well to it, and is heading for a strong breakout and retest.
We have a bearish trend on the RSI indicator that is about to be broken and retested, which supports the upward breakout.
There is a major support area in green at 0.02270, representing a strong support point.
For inquiries, please leave a comment.
We are in a consolidation trend above the 100 moving average.
Entry price: 0.02475
First target: 0.02530
Second target: 0.02600
Third target: 0.02671
Don't forget a simple matter: capital management.
When you reach the first target, save some money and then change your stop-loss order to an entry order.
For inquiries, please leave a comment.
Thank you.
VET - UPDATENYSE:VET - update:
Same as - daily rejection at resistance happened🔴
Very neutral area D1.
I remain bullish above the daily uptrend & more likely 0.02300$ support zone!

#VET Traders watch VeChain 20% upside targeting 0.02676 soon#VET
The price is moving in an ascending channel on the 1-hour frame, adhering well to it, and is heading for a strong breakout and retest.
0.02228
We have a bearish trend on the RSI indicator that is about to be broken and retested, supporting the upside.
There is a major support area in green at 0.02205, which represents a strong basis for the upside.
Don't forget a simple thing: ease and capital.
When you reach the first target, save some money and then change your stop-loss order to an entry order.
For inquiries, please leave a comment.
We have a trend to hold above the 100 Moving Average.
Entry price: 0.02406
First target: 0.02470
Second target: 0.02558
Third target: 0.02676
Don't forget a simple thing: ease and capital.
When you reach the first target, save some money and then change your stop-loss order to an entry order.
For inquiries, please leave a comment.
Thank you.

Is #VET Ready for Massive Bullish Rebound or Not? Watch CloselyYello, Paradisers! Is #VET setting up for a breakout play, or are we about to witness another classic bull trap unfold? Let’s dig into what the chart is telling us on #VeChain:
💎After climbing steadily inside an ascending channel, #VETUSDT is now approaching a major resistance zone around $0.02–$0.02. A confirmed breakout above this area would significantly boost the probability of a bullish continuation, especially with the 50EMA providing dynamic support from below.
💎The immediate support zone to watch is between $0.020–$0.022, which aligns with the channel’s lower boundary and a visible demand zone. This is the key level where bulls are expected to step in if #VETUSD pulls back.
💎If buyers defend this zone successfully and price breaks above the current resistance, the next upside target lies at the moderate resistance of $0.031. Beyond that, the strong resistance level at $0.038 will be the real decision point for any sustained move higher.
💎On the flip side, a breakdown below $0.020 would send it to the lower demand zone at $0.016. It would invalidate the bullish setup and open the door for a deeper selloff, potentially forming a new swing low as shown on the chart.
Stay patient, Paradisers. Let the breakout confirm, and only then do we strike with conviction.
MyCryptoParadise
iFeel the success🌴

Traders watch VeChain 20% upside targeting $0.031 soonHello✌️
Let’s analyze VeChain’s price action both technically and fundamentally 📈.
🔍Fundamental analysis:
VeChain just kicked off its StarGate program with $15M in rewards for staking 10K+ VET.
It’s moving to a Weighted Delegated Proof-of-Stake system and burning all base fees to cut $VTHO supply.
Less selling pressure and a 5.48B $VTHO burn could make VET scarcer, but results depend on network growth. 🔥📊
📊Technical analysis:
BINANCE:VETUSDT demonstrates solid trading volume, supported by a key daily support zone. If this level holds, the price could see a 20% rise, aiming for $0.031. Traders should monitor price action closely and manage risk appropriately. 📊🛡️
✨We put love into every post!
Your support inspires us 💛 Drop a comment we’d love to hear from you! Thanks, Mad Whale

#VET/USDT Ascending Broadening Wedge #VET
The price is moving within an ascending channel on the 1-hour frame, adhering well to it, and is poised to break it strongly upwards and retest it.
We have support from the lower boundary of the ascending channel, at 0.02290.
We have a downtrend on the RSI indicator that is about to break and retest, supporting the upward move.
There is a key support area (in green) at 0.02278, which represents a strong basis for the upward move.
Don't forget one simple thing: ease and capital.
When you reach the first target, save some money and then change your stop-loss order to an entry order.
For inquiries, please leave a comment.
We have a trend of stability above the Moving Average 100.
Entry price: 0.02306
First target: 0.02339
Second target: 0.02378
Third target: 0.02423
Don't forget one simple thing: ease and capital.
When you reach the first target, save some money and then change your stop-loss order to an entry order.
For inquiries, please leave a comment.
Thank you.

VET/USDT – Golden Pocket Retest After Breakout!🧠 Overview: Is VeChain About to Flip Bullish?
The 2D VET/USDT chart (KuCoin) is presenting a high-potential setup. After months of downward pressure, VET has finally broken above a long-standing descending trendline, which has been intact since early 2025.
Now, price is retesting a major support zone—which also happens to be the Golden Pocket of the Fibonacci retracement (0.5–0.618). This area is crucial for confirming whether this is a real trend reversal or just another fakeout.
---
🧩 Technical Structure & Key Levels
📍 Descending Trendline (Broken)
A clear breakout from the downtrend that started in February 2025.
First signal of a potential trend reversal.
📍 Critical Support Zone – Golden Pocket
Range: 0.02258 – 0.02390 USDT
Aligns with Fibonacci 0.5–0.618 retracement from recent swing low to high.
Acts as a historically strong horizontal support — now being retested after the breakout.
📍 Fibonacci Resistance Levels (Upside Targets)
Level Price (USDT)
Resistance 1 0.02840
Resistance 2 0.03235
Resistance 3 0.03745
Resistance 4 0.04265
Resistance 5 0.05185
Extended High 0.07786 – 0.08006
📍 Major Support (Last Line of Defense)
0.01772 USDT, the lowest level seen since late 2023.
---
✅ Bullish Scenario – Valid Retest & Reversal
If the Golden Pocket zone holds, we could see:
Continuation of bullish momentum
Gradual move toward:
🎯 0.02840 as the first resistance
🎯 0.03235 – 0.03745 as mid-term targets
🎯 0.04265 – 0.05185 if momentum strengthens
Potential formation of an Inverse Head & Shoulders pattern, signaling a strong reversal base
---
❌ Bearish Scenario – Failed Retest
If price fails to hold the 0.02258–0.02390 support zone:
We may see a move back down toward 0.01772 USDT
This would invalidate the bullish breakout (false breakout scenario)
The longer-term downtrend could resume
> ⚠️ Beware of a potential bull trap around 0.025–0.026 — price rejection here could signal a failed breakout.
---
🧠 Current Price Action Pattern
✅ Descending Trendline Breakout → early bullish signal
🔁 Golden Pocket Retest → now in progress, critical for direction confirmation
📈 Reversal Potential → watching for Inverse Head & Shoulders formation
---
💡 Conclusion
VET/USDT is at a make-or-break level. The breakout above the descending trendline is promising, but the current retest of the Golden Pocket zone is the real test for bulls. If this level holds, we could be witnessing the early stages of a trend reversal with multiple upside targets in play.
#VETUSDT #VeChain #CryptoBreakout #FibonacciLevels #GoldenPocket #AltcoinAnalysis #InverseHeadAndShoulders #TrendReversal #CryptoTechnicalAnalysis #SupportResistance #CryptoSignals

#VET/USDT – Falling Wedge Breakout?#VET
The price is moving within a descending channel on the 1-hour frame and is expected to break and continue upward.
We have a trend to stabilize above the 100 moving average once again.
We have a downtrend on the RSI indicator that supports the upward break.
We have a support area at the lower boundary of the channel at 0.02310, acting as strong support from which the price can rebound.
We have a major support area in green that pushed the price upward at 0.02360.
Entry price: 0.02545
First target: 0.02613
Second target: 0.02739
Third target: 0.02889
To manage risk, don't forget stop loss and capital management.
When you reach the first target, save some profits and then change the stop order to an entry order.
For inquiries, please comment.
Thank you.

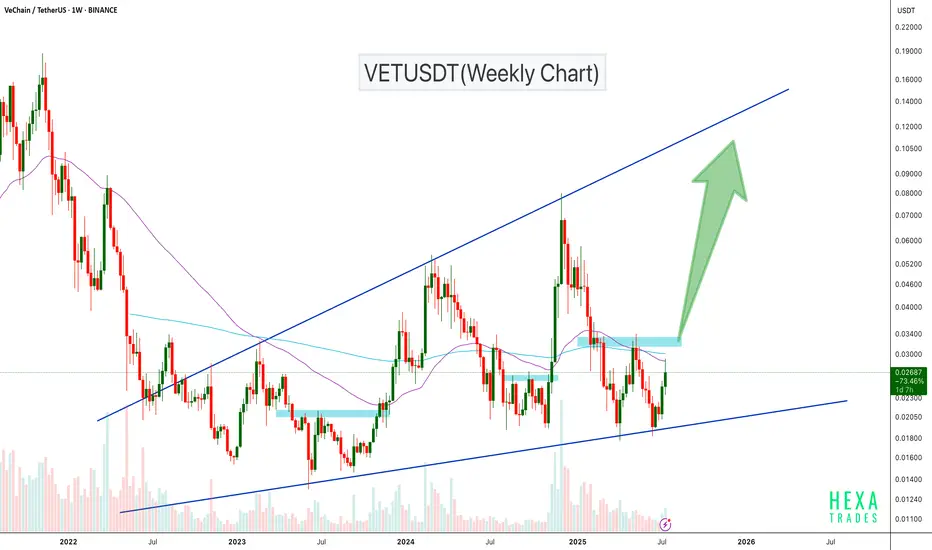
VETUSDT Ascending Broadening WedgeVETUSDT is trading inside a long-term ascending broadening wedge on the weekly chart, with price currently bouncing off major trendline support. After holding this support zone, VET is showing strength and approaching a critical resistance area around $0.033–$0.035.
A breakout above this zone could trigger a strong bullish rally, with potential upside targets in the $0.06–$0.10 range, and even higher toward the wedge top.
Cheers
Hexa
BINANCE:VETUSD NYSE:VET