#VET/USDT Traders watch VeChain 10% upside#VET
The price is moving within a descending channel on the hourly timeframe. It has reached the upper boundary and is heading towards breaking it. A retest of this boundary is expected.
The Relative Strength Index (RSI) is showing an upward trend, as it has approached the upper boundary. A bearish reversal is expected.
There is a key support zone in green at 0.00873. The price has bounced from this zone several times and is expected to bounce again.
A consolidation trend is observed above the 100-period moving average, which we are approaching. This trend supports a decline towards this level.
Entry Price: 0.00886
Target 1: 0.00903
Target 2: 0.00928
Target 3: 0.00954
Stop Loss: Above the green support zone.
Remember this simple thing: Money management.
For any questions, please leave a comment.
Thank you.
VETUSDT

#VET/USDT Traders watch VeChain 10% upside targeting 0.01243 ?#VET
The price is moving within a descending channel on the hourly timeframe. It has reached the lower boundary and is heading towards a breakout, with a retest of the upper boundary expected.
The Relative Strength Index (RSI) is showing a downward trend, approaching the lower boundary, and an upward bounce is anticipated.
There is a key support zone in green at 0.01147. The price has bounced from this level several times and is expected to bounce again.
The RSI is showing a trend towards consolidation above the 100-period moving average, which we are approaching, supporting the upward move.
Entry Price: 0.01164
Target 1: 0.01187
Target 2: 0.01212
Target 3: 0.01243
Stop Loss: Below the green support zone.
Remember this simple thing: Money management.
For any questions, please leave a comment.
Thank you.

#VET/USDT Traders watch VeChain 10% upside targeting 0.01216 ?#VET
The price is moving within a descending channel on the hourly timeframe. It has reached the upper boundary and is heading towards breaking it. A retest of this boundary is expected.
The Relative Strength Index (RSI) is showing an upward trend, as it has approached the upper boundary. A bearish reversal is expected.
There is a key support zone in green at 0.01125. The price has bounced from this zone several times and is expected to bounce again.
A consolidation trend is observed above the 100-period moving average, which we are approaching. This trend supports a decline towards this level.
Entry Price: 0.01216
Target 1: 0.01163
Target 2: 0.01189
Target 3: 0.01216
Stop Loss: Above the green support zone.
Remember this simple thing: Money management.
For any questions, please leave a comment.
Thank you.

#VET/USDT – Falling Wedge Breakout?#VET
The price is moving in a descending channel on the 1-hour timeframe. It has reached the upper limit and is heading towards breaking downwards, with a retest of the upper limit expected.
We have an upward trend on the RSI indicator, which has reached near the upper limit, and a downward reversal is expected.
There is a major resistance zone in green at 0.01300. The price has bounced from this zone multiple times and is expected to bounce again.
We have a trend of consolidation above the 100-period moving average, as we are moving close to it, which supports a downward move towards touching it.
Entry price: 0.01172
First target: 0.01150
Second target: 0.01122
Third target: 0.01080
Stop loss: Above the resistance zone in green.
Don't forget a simple thing: money management.
For inquiries, please leave a comment.
Thank you.

VET/USDT at a Demand Zone – Major Reversal or Breakdown?VeChain (VET/USDT) is currently at a major long-term decision zone. Price has declined and is now retesting a strong historical demand area, highlighted by the yellow block between 0.01225 – 0.00965.
This zone previously acted as a major accumulation base and triggered several strong bullish impulses in the past.
From a macro perspective, the market structure is still bearish (lower highs – lower lows) since the 2021 ATH. However, current price positioning is within a low-risk, high-reward area for mid- to long-term market participants.
---
🟨 Key Demand Zone (Yellow Block)
0.01225 – 0.00965
Strong weekly historical support
Major accumulation area since 2020–2021
Current price reaction shows early buying interest
This zone will determine the next major trend direction
As long as price holds above this demand zone, the probability of forming a long-term bottom remains valid.
---
📐 Technical Structure & Pattern Analysis
1️⃣ Descending Macro Structure (Downtrend)
Price continues to form lower highs
No confirmed weekly breakout above key resistance yet
2️⃣ Potential Long-Term Accumulation Base
Sideways price action near the lows
Decreasing volatility → seller exhaustion indication
3️⃣ Support → Resistance Mapping
Key levels clearly visible on the chart:
0.01500
0.01950
0.03150
0.04900
0.06750
These levels previously acted as support and have now turned into step-by-step resistance zones.
---
🟢 Bullish Scenario (If Demand Holds)
Primary conditions:
Price respects and holds above 0.00965
No strong weekly close below the yellow zone
Upside projection:
1. Bounce from the demand zone
2. Break and weekly close above 0.01500
3. Continuation toward:
0.01950 (minor resistance)
0.03150 (mid-range resistance)
4. If a higher low structure forms:
Extended targets at 0.04900 – 0.06750
📈 Bias:
Bullish bias remains corrective / recovery-based until a confirmed higher high appears on the weekly timeframe.
---
🔴 Bearish Scenario (If Demand Fails)
Bearish confirmation:
Strong weekly close below 0.00965
Breakdown supported by increasing volume
Downside risks:
Historical demand zone fails
Potential continuation toward:
0.00889 (previous cycle low)
Possible exploration of new lower lows
📉 Bias:
Bearish continuation, extending the broader accumulation or distribution phase.
---
🎯 Conclusion
The 0.01225 – 0.00965 zone is the most critical area on this chart
Price reaction here will define:
A medium- to long-term reversal, or
A structural breakdown continuation
Best suited for positional and long-term observation, not aggressive entries without confirmation
> Weekly close is the key. Ignore lower-timeframe noise.
#VET #VETUSDT #VeChain #CryptoAnalysis #WeeklyChart #DemandZone #SupportResistance #LongTermSetup #Accumulation #AltcoinAnalysis

#VET Ready for a Major Bullish Move | Key Levels to Watch Yello, Paradiser! Is #VeChain about to trap all the late bears, or are we about to witness one more brutal shakeout? Let's view the #VETUSDT trading setup:
💎#VET is currently trading around $0.0116 on the 1D timeframe, and just completed a breakout from a textbook Falling Wedge, one of the most reliable bullish reversal patterns when combined with confirmation signals.
💎The breakout has already occurred, and most importantly, it is now retesting the descending resistance to validate this breakout. This is often a critical validation of strength and suggests the move is likely not a fakeout. In addition, we’ve already seen a bullish crossover on the momentum oscillator, which adds further confirmation to this bullish setup.
💎The Strong Demand Zone between $0.0094 and $0.010 is now acting as the base of this bullish structure. Holding above this level is essential. If bulls continue to defend this zone, we anticipate a potential push toward the first major resistance at $0.0138, followed by the strong resistance area between $0.019 and $0.020, where sellers are likely to step in more aggressively.
💎Below the structure, we’ve clearly marked Key Support at $0.0078 for #VETUSD. If price closes below this zone, it would invalidate the bullish scenario and open the door for further downside, potentially into illiquid areas where volatility could spike.
Be patient, wait for structure to confirm, and stick to your plan. That’s what keeps you consistent while others chase.
MyCryptoParadise
iFeel the success🌴

#VET/USDT Traders watch VeChain 10% upside targeting 0.01176 ?#VET
The price is moving in a descending channel on the 1-hour timeframe. It has reached the lower boundary and is heading towards breaking above it, with a retest of the upper boundary expected.
We have a downtrend on the RSI indicator, which has reached near the lower boundary, and an upward rebound is expected.
There is a key support zone in green at 0.01022. The price has bounced from this level multiple times and is expected to bounce again.
We have a trend towards consolidation above the 100-period moving average, as we are moving close to it, which supports the upward movement.
Entry price: 0.01059
First target: 0.01090
Second target: 0.01129
Third target: 0.01176
Don't forget a simple principle: money management.
Place your stop-loss below the support zone in green.
For any questions, please leave a comment.
Thank you.

#VET/USDT Traders watch VeChain 10% upside targeting 0.01341 ?#VET
The price is moving in a descending channel on the 1-hour timeframe. It has reached the lower boundary and is heading towards breaking above it, with a retest of the upper boundary expected.
We have a downtrend on the RSI indicator, which has reached near the lower boundary, and an upward rebound is expected.
There is a key support zone in green at 0.01230. The price has bounced from this zone multiple times and is expected to bounce again.
We have a trend towards stability above the 100-period moving average, as we are moving close to it, which supports the upward movement.
Entry price: 0.01243
First target: 0.01280
Second target: 0.01308
Third target: 0.01341
Don't forget a simple principle: money management.
Place your stop-loss below the support zone in green.
For any questions, please leave a comment.
Thank you.

#VET/USDT Traders watch VeChain 10% upside targeting 0.01340?#VET
The price is moving in a descending channel on the 1-hour timeframe. It has reached the lower boundary and is heading towards breaking above it, with a retest of the upper boundary expected.
We have a downtrend on the RSI indicator, which has reached near the lower boundary, and an upward rebound is expected.
There is a key support zone in green at 0.01212. The price has bounced from this level multiple times and is expected to bounce again.
We have a trend towards consolidation above the 100-period moving average, as we are moving close to it, which supports the upward movement.
Entry price: 0.01264
First target: 0.01280
Second target: 0.01300
Third target: 0.01340
Don't forget a simple principle: money management.
Place your stop-loss order below the support zone in green.
For any questions, please leave a comment.
Thank you.

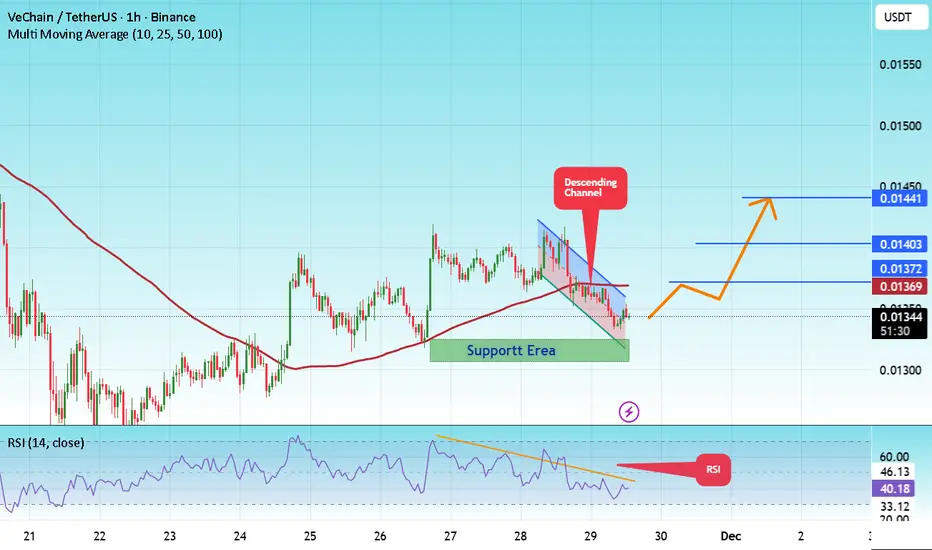
#VET/USDT Traders watch VeChain 10% upside targeting 0.01441 ?#VET
The price is moving in a descending channel on the 1-hour timeframe. It has reached the lower boundary and is heading towards a breakout, with a retest of the upper boundary expected.
We are seeing a bearish bias in the Relative Strength Index (RSI), which has reached near the lower boundary, and an upward bounce is expected.
There is a key support zone in green at 0.01320. The price has bounced from this level several times and is expected to bounce again.
We are seeing a trend towards stabilizing above the 100-period moving average, which we are approaching, supporting the upward trend.
Entry Price: 0.01345
First Target: 0.01372
Second Target: 0.01403
Third Target: 0.01441
Remember a simple principle: Money Management.
Place your stop-loss order below the green support zone.
For any questions, please leave a comment.
Thank you.
#VET/USDT Traders watch VeChain 10% upside targeting 0.01697 ?#VET
The price is moving in a descending channel on the 1-hour timeframe and is expected to break out and continue upwards.
We have a trend to stabilize above the 100-period moving average again.
We have a downtrend on the RSI indicator, which supports an upward move if it breaks above it.
We have a key support zone in green that pushed the price higher at 0.01580.
Entry price: 0.01608
First target: 0.01608
Second target: 0.01645
Third target: 0.01697
For risk management, don't forget your stop-loss and money management.
The stop-loss is below the support zone in green.
Upon reaching the first target, take some profit and then change your stop-loss order to an entry order.
For any questions, please comment.
Thank you.

#VET/USDT Traders watch VeChain 20% upside targeting 0.01820 ?#VET
The price is moving in an ascending channel on the 1-hour frame, adhering well to it, and is heading for a strong breakout and retest.
We have a bearish trend on the RSI indicator that is about to be broken and retested, which supports the upward breakout.
There is a major support area in green at 0.01700, representing a strong support point.
We are heading for consolidation above the 100 moving average.
Entry price: 0.01727
First target: 0.01750
Second target: 0.01780
Third target: 0.01820
Don't forget a simple matter: capital management.
When you reach the first target, save some money and then change your stop-loss order to an entry order.
For inquiries, please leave a comment.
Thank you.

$VET Channel Fade – Support Test Tightens?BINANCE:VETUSDT NYSE:VET Channel Fade – Support Test Tightens?
Current trend: VET's in a persistent descending channel from 0.021 highs, now probing 0.0147 support after capping resistance—sellers grinding lower, but doji indecision hints at buyer ambush brewing 🛡️.
Hold support? Likely yes; EMA confluence and volume dry-up could flip momentum for quick relief.
Breakout above resistance? Bullish trigger over 0.019 close—potential 5-7% surge to 0.0205 on alt rotation 🚀.
Dip risk? Moderate to 0.014 on crack, amplified by BTC correlation.
Target: Upside 0.018 short-term; downside 0.0135 buffer.
Indicators tracking: RSI (34, oversold zone), Channel lower bound, and MACD crossover watch 📊.
#VETTrading #CryptoChannel #FiboTrendCrypto

$VET VeChain Channel Squeeze – Support Battle?BINANCE:VETUSDT NYSE:VET VeChain Channel Squeeze – Support Battle?
Current trend: VET's coiling in a narrowing descending channel, defending the 0.015 support after capping 0.019 resistance—fading downside volume hints at bullish divergence brewing 🛡️.
Hold support? Solid yes; prior bounces and trendline confluence could fuel a clean rejection.
Breakout above resistance? Imminent on 0.019 close—unlocking 6-8% pop toward channel extension 🚀.
Dip risk? Mild to 0.0145 if weakens, but oversold metrics limit it.
Target: Short-term 0.020 on flip; stretch 0.022 with conviction.
Indicators tracking: RSI (36, rebound zone), Channel convergence, and MACD histogram lift 📊.
#VETTrading #CryptoChannel #FiboTrendCrypto

VETUSDT UPDATE#VET
UPDATE
VET Technical Setup
Pattern: Falling Wedge Pattern
Current Price: $0.0172
Target Price: $0.0227
Target % Gain: 34.53%
Technical Analysis: VET is breaking out of a falling wedge pattern on the 4H chart, showing bullish momentum. The price has moved above the resistance trendline with steady volume, confirming the breakout and signaling potential continuation toward the upper resistance zone.
Time Frame: 4H
Risk Management Tip: Always use proper risk management.

#VET/USDT Traders watch VeChain 20% upside targeting 0.01800 ?#VET
The price is moving within a descending channel on the 1-hour frame, adhering well to it, and is heading for a strong breakout and retest.
We have a bearish trend on the RSI indicator that is about to be broken and retested, which supports the upward breakout.
There is a major support area in green at 0.01670, representing a strong support point.
We are heading for consolidation above the 100 moving average.
Entry price: 0.01700
First target: 0.01727
Second target: 0.01762
Third target: 0.01800
Don't forget a simple matter: capital management.
When you reach the first target, save some money and then change your stop-loss order to an entry order.
For inquiries, please leave a comment.
Thank you.

VETUSDT – Reaccumulation or Breakdown? Market Will Decide Here!VeChain (VET) has once again returned to its historical multi-year support zone, a level that has consistently acted as institutional accumulation territory around $0.012 – $0.017.
Every touch of this zone in the past has triggered massive bullish reversals, leading to multi-fold rallies. Now, VET stands at this critical juncture once again — and how it reacts here could determine its direction for the coming months.
The latest weekly candle shows a long downside wick, signaling strong buy-side absorption after a potential liquidity sweep.
This could be the early stage of a re-accumulation phase, but confirmation will only come if the price closes the week above this yellow support box.
---
Structure & Pattern Overview
Macro trend: still forming lower highs since 2021 → overall bearish pressure remains dominant.
Key zone: the horizontal yellow box serves as a boundary between capitulation and reversal.
Price structure: potentially shaping a long-term double bottom pattern if this area holds.
Momentum: gradually slowing down — a classic sign of supply exhaustion before a possible macro reversal.
---
Bullish Scenario – “Rebirth from the Base”
If the weekly candle closes above $0.017, VeChain could trigger a strong recovery move:
1. Bullish confirmation through a strong green weekly candle → validates accumulation zone.
2. Upside targets:
R1: $0.031
R2: $0.050
R3: $0.067
3. A breakout above $0.067 may open the door to $0.164 – $0.25, replicating the previous bull cycle.
4. Rising volume would confirm growing institutional interest and mark a shift in market sentiment.
---
Bearish Scenario – “Break of Faith”
On the flip side, a weekly close below $0.012 would signal a macro breakdown:
1. Failed retest at the yellow zone → confirms the end of long-term accumulation.
2. Downside targets:
Initial: $0.0077 (historical low and next liquidity pocket).
3. Any short-term bounce after breakdown is likely to be a dead cat bounce, not a true reversal.
---
Strategic Takeaway
VeChain now stands at its most critical juncture in over three years.
This is not just another technical level — it’s a battlefield between conviction and fear where smart money defines the next macro trend.
Bullish bias: if weekly closes above $0.017 → expect re-accumulation and a potential swing toward $0.03–$0.05.
Bearish bias: if the support breaks → prepare for a retest of $0.0077 before a new bottom forms.
Swing traders should wait for weekly confirmation before taking large positions, while long-term investors may consider gradual scaling within this range — but only with clear risk management.
---
#VET #VeChain #VETUSDT #CryptoAnalysis #AltcoinSetup #SwingTrade #CryptoMarket #SupportZone #TechnicalAnalysis #CryptoReversal #BuyTheDip #SmartMoney

#VET/USDT Traders watch VeChain 20% upside targeting 0.01790 ?#VET
The price is moving in a descending channel on the 1-hour frame and is expected to break and continue upward.
We have a trend to stabilize above the 100 moving average once again.
We have a downtrend on the RSI indicator that supports the upward move with a breakout.
We have a major support area in green that pushed the price higher at 0.01680.
Entry price: 0.01690.
First target: 0.01717.
Second target: 0.01743.
Third target: 0.01790.
To manage risk, don't forget stop loss and capital management.
When you reach the first target, save some profits and then change the stop order to an entry order.
For inquiries, please comment.
Thank you.

VeChain (VET) – Key Support Test & Long SetupVET is currently retesting a major support zone, presenting a solid opportunity for a long spot position ahead of what could be a Q4/year-end rally.
📉 Entry Zone: $0.0215 – $0.02245
📈 Targets:
• TP1: $0.026 – $0.028
• TP2: $0.03 – $0.0325
🛑 Stop Loss: Below $0.02

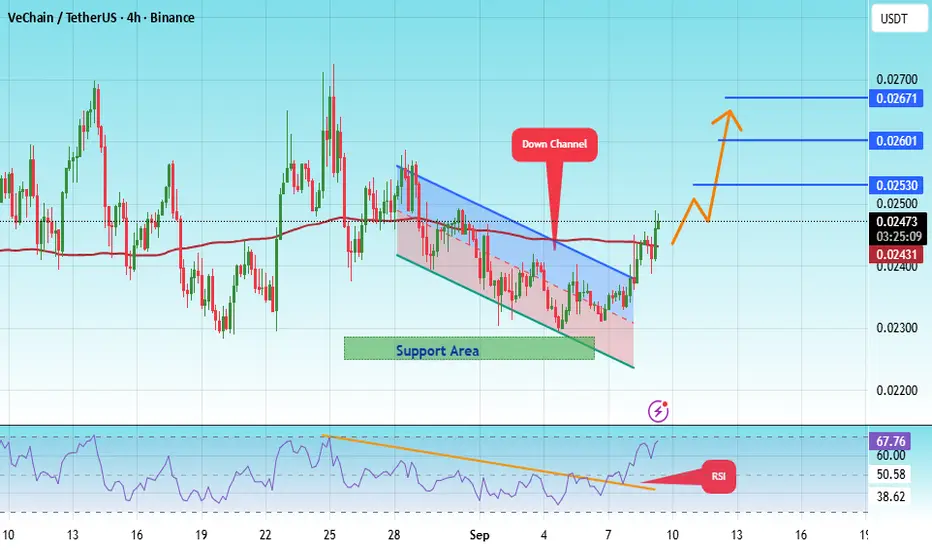
#VET/USDT Traders watch VeChain 20% upside targeting 0.02671 ?#VET
The price is moving within a descending channel on the 4-hour frame, adhering well to it, and is heading for a strong breakout and retest.
We have a bearish trend on the RSI indicator that is about to be broken and retested, which supports the upward breakout.
There is a major support area in green at 0.02270, representing a strong support point.
For inquiries, please leave a comment.
We are in a consolidation trend above the 100 moving average.
Entry price: 0.02475
First target: 0.02530
Second target: 0.02600
Third target: 0.02671
Don't forget a simple matter: capital management.
When you reach the first target, save some money and then change your stop-loss order to an entry order.
For inquiries, please leave a comment.
Thank you.
VeChain Near Support, 17% Rally Could Push Price 0.029Hello✌️
Let’s analyze VeChain’s price action both technically and fundamentally 📈.
🔍Fundamental analysis:
VeChain (VET) staking grows fast with StarGate, shrinking supply. The challenge is keeping momentum once rewards stop in Dec 2025.
📊Technical analysis:
BINANCE:VETUSDT is currently testing the upper boundary of its descending channel near a key trendline and daily support; holding this zone could open the way for an upward move of around 17% toward the 0.029 target. 📈🐉
📈Using My Analysis to Open Your Position:
You can use my fundamental and technical insights along with the chart. The red and green arrows on the left help you set entry, take-profit, and stop-loss levels, serving as clear signals for your trades.⚡️ Also, please review the TradingView disclaimer carefully.🛡
✨We put love into every post!
Your support inspires us 💛 Drop a comment we’d love to hear from you! Thanks , Mad Whale

#VET Traders watch VeChain 20% upside targeting 0.02676 soon#VET
The price is moving in an ascending channel on the 1-hour frame, adhering well to it, and is heading for a strong breakout and retest.
0.02228
We have a bearish trend on the RSI indicator that is about to be broken and retested, supporting the upside.
There is a major support area in green at 0.02205, which represents a strong basis for the upside.
Don't forget a simple thing: ease and capital.
When you reach the first target, save some money and then change your stop-loss order to an entry order.
For inquiries, please leave a comment.
We have a trend to hold above the 100 Moving Average.
Entry price: 0.02406
First target: 0.02470
Second target: 0.02558
Third target: 0.02676
Don't forget a simple thing: ease and capital.
When you reach the first target, save some money and then change your stop-loss order to an entry order.
For inquiries, please leave a comment.
Thank you.

VETUSDT: Start ALTIt seems like the alt season is coming. After Bitcoin and then Ethereum surged, some coins are ready to take off, like this currency.
