VET/USDT at a Demand Zone – Major Reversal or Breakdown?VeChain (VET/USDT) is currently at a major long-term decision zone. Price has declined and is now retesting a strong historical demand area, highlighted by the yellow block between 0.01225 – 0.00965.
This zone previously acted as a major accumulation base and triggered several strong bullish impulses in the past.
From a macro perspective, the market structure is still bearish (lower highs – lower lows) since the 2021 ATH. However, current price positioning is within a low-risk, high-reward area for mid- to long-term market participants.
---
🟨 Key Demand Zone (Yellow Block)
0.01225 – 0.00965
Strong weekly historical support
Major accumulation area since 2020–2021
Current price reaction shows early buying interest
This zone will determine the next major trend direction
As long as price holds above this demand zone, the probability of forming a long-term bottom remains valid.
---
📐 Technical Structure & Pattern Analysis
1️⃣ Descending Macro Structure (Downtrend)
Price continues to form lower highs
No confirmed weekly breakout above key resistance yet
2️⃣ Potential Long-Term Accumulation Base
Sideways price action near the lows
Decreasing volatility → seller exhaustion indication
3️⃣ Support → Resistance Mapping
Key levels clearly visible on the chart:
0.01500
0.01950
0.03150
0.04900
0.06750
These levels previously acted as support and have now turned into step-by-step resistance zones.
---
🟢 Bullish Scenario (If Demand Holds)
Primary conditions:
Price respects and holds above 0.00965
No strong weekly close below the yellow zone
Upside projection:
1. Bounce from the demand zone
2. Break and weekly close above 0.01500
3. Continuation toward:
0.01950 (minor resistance)
0.03150 (mid-range resistance)
4. If a higher low structure forms:
Extended targets at 0.04900 – 0.06750
📈 Bias:
Bullish bias remains corrective / recovery-based until a confirmed higher high appears on the weekly timeframe.
---
🔴 Bearish Scenario (If Demand Fails)
Bearish confirmation:
Strong weekly close below 0.00965
Breakdown supported by increasing volume
Downside risks:
Historical demand zone fails
Potential continuation toward:
0.00889 (previous cycle low)
Possible exploration of new lower lows
📉 Bias:
Bearish continuation, extending the broader accumulation or distribution phase.
---
🎯 Conclusion
The 0.01225 – 0.00965 zone is the most critical area on this chart
Price reaction here will define:
A medium- to long-term reversal, or
A structural breakdown continuation
Best suited for positional and long-term observation, not aggressive entries without confirmation
> Weekly close is the key. Ignore lower-timeframe noise.
#VET #VETUSDT #VeChain #CryptoAnalysis #WeeklyChart #DemandZone #SupportResistance #LongTermSetup #Accumulation #AltcoinAnalysis
Vetusdtanalysis

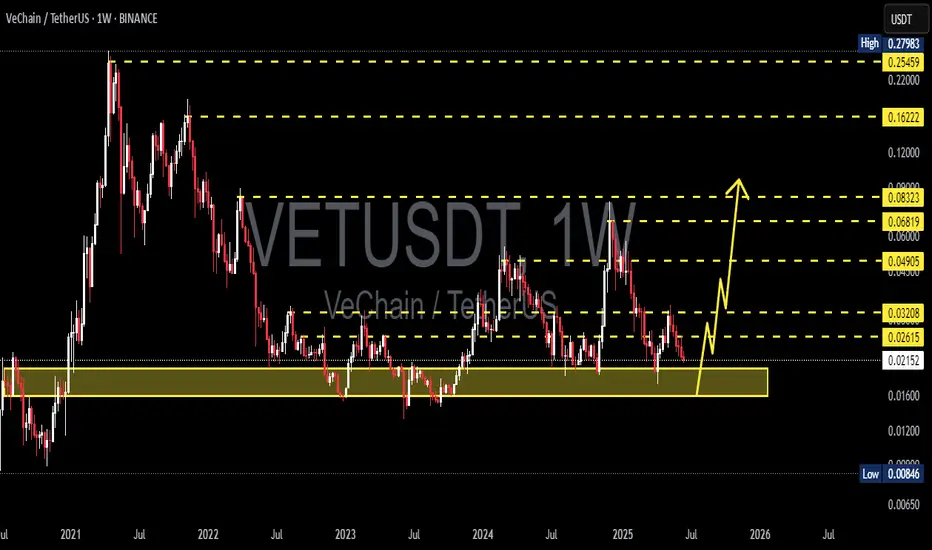
VETUSDT – Reaccumulation or Breakdown? Market Will Decide Here!VeChain (VET) has once again returned to its historical multi-year support zone, a level that has consistently acted as institutional accumulation territory around $0.012 – $0.017.
Every touch of this zone in the past has triggered massive bullish reversals, leading to multi-fold rallies. Now, VET stands at this critical juncture once again — and how it reacts here could determine its direction for the coming months.
The latest weekly candle shows a long downside wick, signaling strong buy-side absorption after a potential liquidity sweep.
This could be the early stage of a re-accumulation phase, but confirmation will only come if the price closes the week above this yellow support box.
---
Structure & Pattern Overview
Macro trend: still forming lower highs since 2021 → overall bearish pressure remains dominant.
Key zone: the horizontal yellow box serves as a boundary between capitulation and reversal.
Price structure: potentially shaping a long-term double bottom pattern if this area holds.
Momentum: gradually slowing down — a classic sign of supply exhaustion before a possible macro reversal.
---
Bullish Scenario – “Rebirth from the Base”
If the weekly candle closes above $0.017, VeChain could trigger a strong recovery move:
1. Bullish confirmation through a strong green weekly candle → validates accumulation zone.
2. Upside targets:
R1: $0.031
R2: $0.050
R3: $0.067
3. A breakout above $0.067 may open the door to $0.164 – $0.25, replicating the previous bull cycle.
4. Rising volume would confirm growing institutional interest and mark a shift in market sentiment.
---
Bearish Scenario – “Break of Faith”
On the flip side, a weekly close below $0.012 would signal a macro breakdown:
1. Failed retest at the yellow zone → confirms the end of long-term accumulation.
2. Downside targets:
Initial: $0.0077 (historical low and next liquidity pocket).
3. Any short-term bounce after breakdown is likely to be a dead cat bounce, not a true reversal.
---
Strategic Takeaway
VeChain now stands at its most critical juncture in over three years.
This is not just another technical level — it’s a battlefield between conviction and fear where smart money defines the next macro trend.
Bullish bias: if weekly closes above $0.017 → expect re-accumulation and a potential swing toward $0.03–$0.05.
Bearish bias: if the support breaks → prepare for a retest of $0.0077 before a new bottom forms.
Swing traders should wait for weekly confirmation before taking large positions, while long-term investors may consider gradual scaling within this range — but only with clear risk management.
---
#VET #VeChain #VETUSDT #CryptoAnalysis #AltcoinSetup #SwingTrade #CryptoMarket #SupportZone #TechnicalAnalysis #CryptoReversal #BuyTheDip #SmartMoney

VET/USDT – Golden Pocket Retest After Breakout!🧠 Overview: Is VeChain About to Flip Bullish?
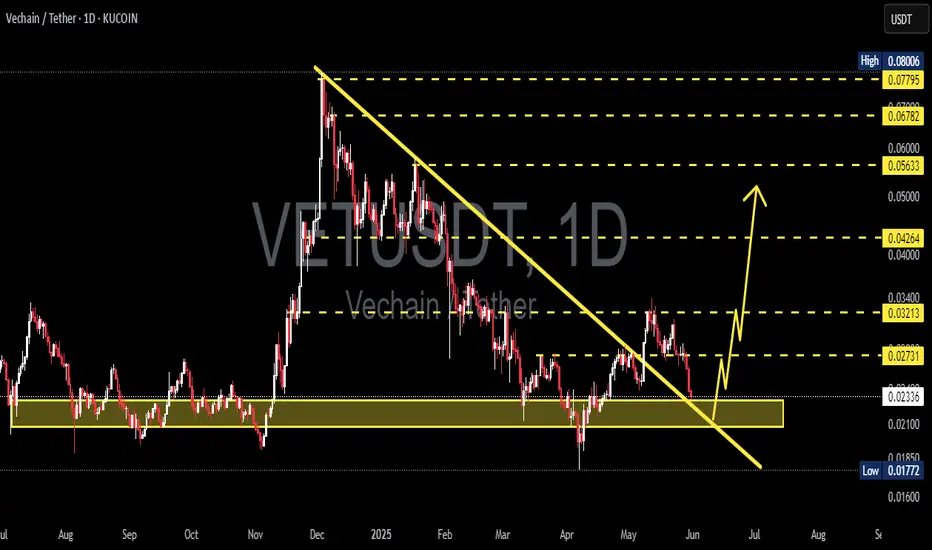
The 2D VET/USDT chart (KuCoin) is presenting a high-potential setup. After months of downward pressure, VET has finally broken above a long-standing descending trendline, which has been intact since early 2025.
Now, price is retesting a major support zone—which also happens to be the Golden Pocket of the Fibonacci retracement (0.5–0.618). This area is crucial for confirming whether this is a real trend reversal or just another fakeout.
---
🧩 Technical Structure & Key Levels
📍 Descending Trendline (Broken)
A clear breakout from the downtrend that started in February 2025.
First signal of a potential trend reversal.
📍 Critical Support Zone – Golden Pocket
Range: 0.02258 – 0.02390 USDT
Aligns with Fibonacci 0.5–0.618 retracement from recent swing low to high.
Acts as a historically strong horizontal support — now being retested after the breakout.
📍 Fibonacci Resistance Levels (Upside Targets)
Level Price (USDT)
Resistance 1 0.02840
Resistance 2 0.03235
Resistance 3 0.03745
Resistance 4 0.04265
Resistance 5 0.05185
Extended High 0.07786 – 0.08006
📍 Major Support (Last Line of Defense)
0.01772 USDT, the lowest level seen since late 2023.
---
✅ Bullish Scenario – Valid Retest & Reversal
If the Golden Pocket zone holds, we could see:
Continuation of bullish momentum
Gradual move toward:
🎯 0.02840 as the first resistance
🎯 0.03235 – 0.03745 as mid-term targets
🎯 0.04265 – 0.05185 if momentum strengthens
Potential formation of an Inverse Head & Shoulders pattern, signaling a strong reversal base
---
❌ Bearish Scenario – Failed Retest
If price fails to hold the 0.02258–0.02390 support zone:
We may see a move back down toward 0.01772 USDT
This would invalidate the bullish breakout (false breakout scenario)
The longer-term downtrend could resume
> ⚠️ Beware of a potential bull trap around 0.025–0.026 — price rejection here could signal a failed breakout.
---
🧠 Current Price Action Pattern
✅ Descending Trendline Breakout → early bullish signal
🔁 Golden Pocket Retest → now in progress, critical for direction confirmation
📈 Reversal Potential → watching for Inverse Head & Shoulders formation
---
💡 Conclusion
VET/USDT is at a make-or-break level. The breakout above the descending trendline is promising, but the current retest of the Golden Pocket zone is the real test for bulls. If this level holds, we could be witnessing the early stages of a trend reversal with multiple upside targets in play.
#VETUSDT #VeChain #CryptoBreakout #FibonacciLevels #GoldenPocket #AltcoinAnalysis #InverseHeadAndShoulders #TrendReversal #CryptoTechnicalAnalysis #SupportResistance #CryptoSignals

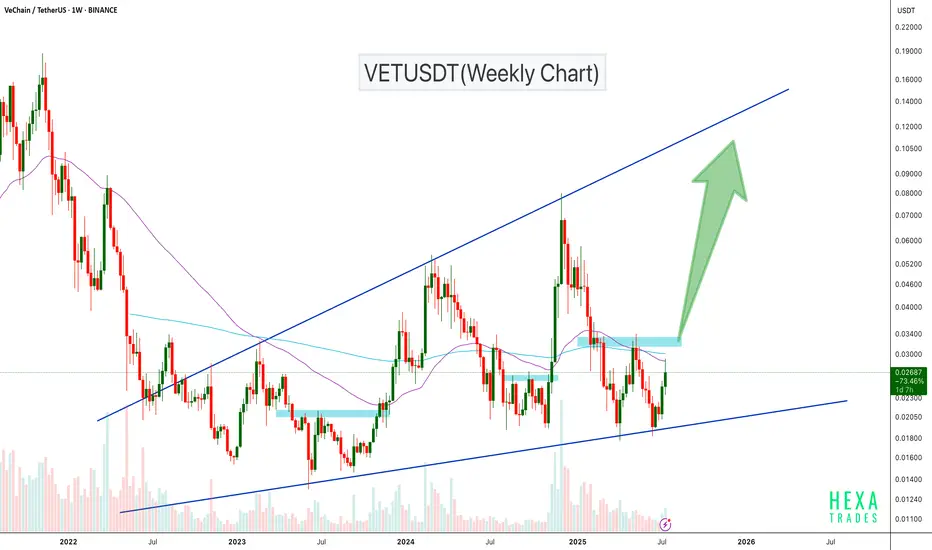
VETUSDT Ascending Broadening WedgeVETUSDT is trading inside a long-term ascending broadening wedge on the weekly chart, with price currently bouncing off major trendline support. After holding this support zone, VET is showing strength and approaching a critical resistance area around $0.033–$0.035.
A breakout above this zone could trigger a strong bullish rally, with potential upside targets in the $0.06–$0.10 range, and even higher toward the wedge top.
Cheers
Hexa
BINANCE:VETUSD NYSE:VET
VETUSDT 1W AnalysisVET ~ 1W Analysis
#VET Buy back gradually from here if you still have confidence in this coin with a short term target of at least 20%+ from here.
VETUSDT 1D Analysis VET ~ 1D Analysis
#VET This support block might be something you can start considering to start buying back from here with a short-term target of at least 10%++
VETUSDT 1D AnalysisVET ~ 1D Analysis
#VET Buy after successfully penetrating this resistant line with a short -term target of at least 10%+ from here.

VETUSDT 1WVET ~ 1W Analysis
#VET Buy gradually from here if you still have a Conviction on this coin with a short -term target of at least 20%+.

VETUSDT 1WVET ~ 1W Analysis
#VET Buy gradually from here if you still have a Conviction on this coin with a short -term target of at least 20%+.

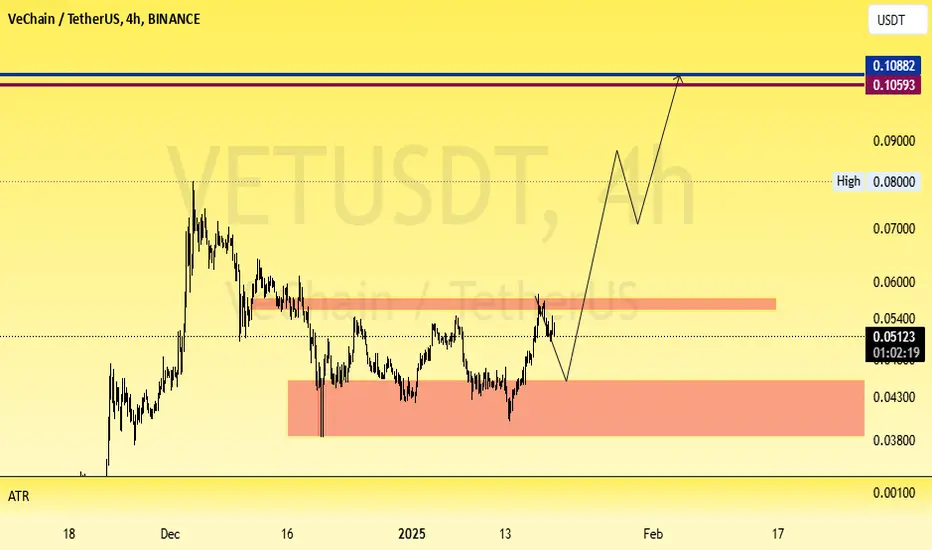
VETUSDT Wave AnalysisHello Friendes. According the chart of VETUSDT I expected to this movement and 0.105$ . This Way possible by cottrction but see that price.
VETUSDT 1WVET Update ~ 1W
#VET If you still have Conviction on this coin,. Buy gradually within this support block,. This coin is still in a very bullish trend.

VET / USDT: rebounding towards trendline resistance VET/USDT: Rebounding Toward Trendline Resistance – Breakout Ahead?
VET/USDT is showing promising signs 📈 as it rebounds from a strong support level, making its way toward a critical trendline resistance 📊. This setup hints at a potential breakout 💥 that could pave the way for a bullish move 🚀. Stay alert for confirmation signals before taking action 👀.
Key Insights:
1. Support Bounce: VET/USDT has found solid support, fueling bullish momentum as it approaches trendline resistance.
2. Volume Watch: A surge in trading volume during a breakout will confirm buyer strength 🔥.
3. Momentum Build-Up: RSI and MACD indicators are trending upward ⚡, signaling increasing bullish pressure.
Steps to Confirm the Breakout:
Wait for a 4H or daily candle to close decisively above the trendline 📍.
Monitor for a significant volume spike during the breakout, indicating robust buying activity 📊.
A retest of the trendline as a new support will validate the breakout ✅.
Be cautious of false breakouts, such as sharp reversals or wicks above resistance ⚠️.
Risk Management Strategies:
Place stop-loss orders below the breakout zone or key support to manage risk effectively 🔒.
Ensure position sizing aligns with your trading plan 🎯.
This analysis is for educational purposes only and not financial advice. Conduct your own research (DYOR) 🔍 before making investment decisions.

#VET/USDT#VET
The price is moving in a descending channel on the 1-hour frame upwards and is expected to continue
We have a trend to stabilize above the moving average 100 again
We have a downtrend on the RSI indicator that supports the rise by breaking it upwards
We have a support area at the lower limit of the channel at a price of 0.02070
Entry price 0.02110
First target 0.02156
Second target 0.02212
Third target 0.02275

VETUSDTVET ~ 4D
#VET If you still have Conviction on this coin,. Wait for this descending pattern to be successfully broken out and start buying gradually afterward. Target 20%++

VETUSDT 1:1 Long Setup SettingBINANCE:VETUSDT
COINBASE:VETUSD
SL1 ---> Low-risk status: 3x-4x Leverage
SL2 ---> Mid-risk status: 5x-8x Leverage
👾The setup is active but expect the uncertain phase as well.
➡️Entry Area:
Yellow zone
⚡️TP:
0.02525
0.02551
0.02581
0.02621
🔴SL:
0.02354
🧐The Alternate scenario:
If the price stabilizes below the trigger zone, the setup will be cancelled.

VETUSDTVET ~ 1D ✅
In 1D Time Frame,. #VET Moves in this descending pattern. The best way for now. Make purchases gradually after successfully breaking through the resistance line of this descending pattern.

VETUSD 1WNYSE:VET ~ 1W
#VET Make purchases gradually on this support block. with a minimum target of 20%++

#VETIn the daily time, it is moving in a descending channel, which is currently located at the ceiling of the channel of resistance, and if it can break the red box area, it can continue to the specified area and exit the downward trend and enter the medium-term upward phase. get a date

VeChain to much higherVeChain is setting up potential long term trade similar to the trades we took in SOL, AVAX, WOO, Theta etc.
I will be accumulating during pull backs to my buy zone of 0.03910 to 0.04010.
VeChain is setting up multi time frame squeezes and I'm expecting explosive moves to much higher prices. This is a weekly chart so this move will take some time to play out.
My price targets for VET is as follows:
PT1: 0.06480
PT2: 0.09226
PT3: 0.1069
PT4: 0.1490

🐮💹🚀 Vet/Usdt Trading Idea 🚀💹🐮
Vet/Usdt is currently showing bullish signs 📈. The market structure has turned into a bullish pattern, and the price is retracing to test a new demand area 🔄. This could signify a potential upward movement. I anticipate a rise in price from this point, potentially ranging between 15-30% 📈🔥.
Remember, this analysis is not financial advice ❌📉. Always conduct your own research (DYOR) and make informed decisions. Happy trading! 💪💰📊

VET target 0.192h time frame
-
VET broke and retested the falling wedge structure, it also got support at 0.618 Fibonacci Retracement, which is good to accumulate momentum. Last step VET need to maintain pumping momentum is to go above 0.0174. With breaking above previous high, this wedge could be regarded as continuation structure, and targets as below.
TP: 0.019~0.0195 / 0.0198
SL: 0.0164

VET and the Impressive 640 risk to reward opportunity Hi Everyone;
today we have one of the best risk to reward Investment opportunity
it is more than 640 times the risk and the chart is look very promising.
I expect breaking the previous bear market key point will clear the way to the final target

VETUSDT on daily support and may head up for 0.02918VETUSDT is trading inside daily support zone. It is likely that the price will trade higher and aim towards daily resistance. The expected movement has been depicted in three steps L1, S2, L3. The step L3 may go till 0.02918 as depicted on the chart. But this sequence of paths will be followed only if the price does not lose the daily support.
