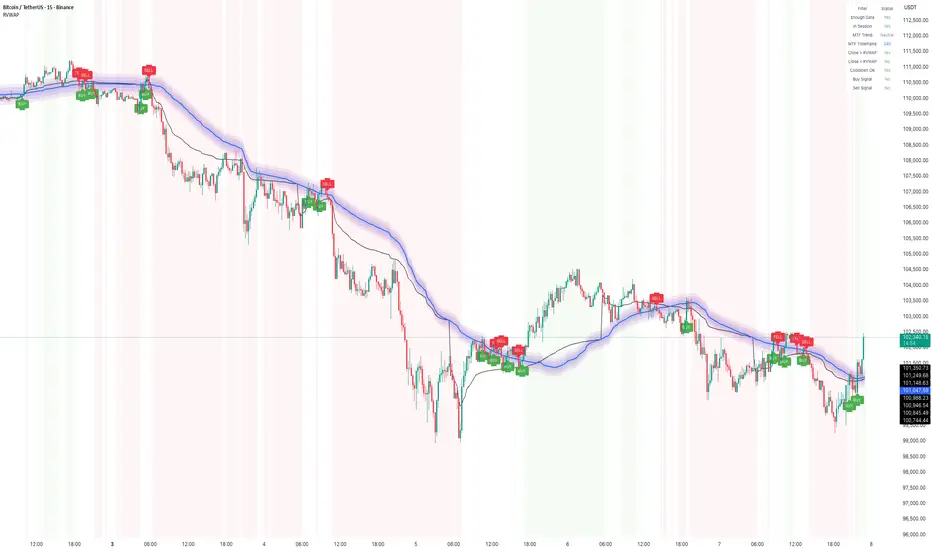
How to Use Rolling VWAP – Early US Session Trend TrackerIn today’s BTC/USDT 15-min chart, the Rolling VWAP perfectly captured the directional bias throughout the session.
The smooth transition between compression and expansion phases clearly aligned with VWAP slope shifts — giving multiple early signals during the US market open, when volatility tends to expand sharply.
Performance Highlights
• The indicator tracked clean trend waves with minimal lag, showing how price respected the VWAP envelope dynamically.
• BUY and SELL zones were well-defined, with fading reversals quickly replaced by trend-aligned setups.
• Session filter (US Market) ensured signals appeared primarily during active volatility windows, avoiding false setups during low-volume hours.
• The rolling nature of VWAP (instead of session-based VWAP) allowed continuous trend capture across intraday transitions.
Additional Notes
1. Cooldown Setting:
Currently set to 1 candle — which makes the chart more responsive but slightly denser with signals.
Increasing it (e.g., to 3–5 bars) can make the chart cleaner, though some reversal entries may not display visually even though they’re logically detected.
2. US Session Filter:
The logic focuses on the early US market phase, effectively capturing directional bursts when liquidity and volatility spike — ideal for short-term scalping or trend continuation setups.
⸻
🧠 Tip:
Combine the Rolling VWAP bias with higher-timeframe structure (e.g., 1H trend) for even more reliable directional trades.
Volatality
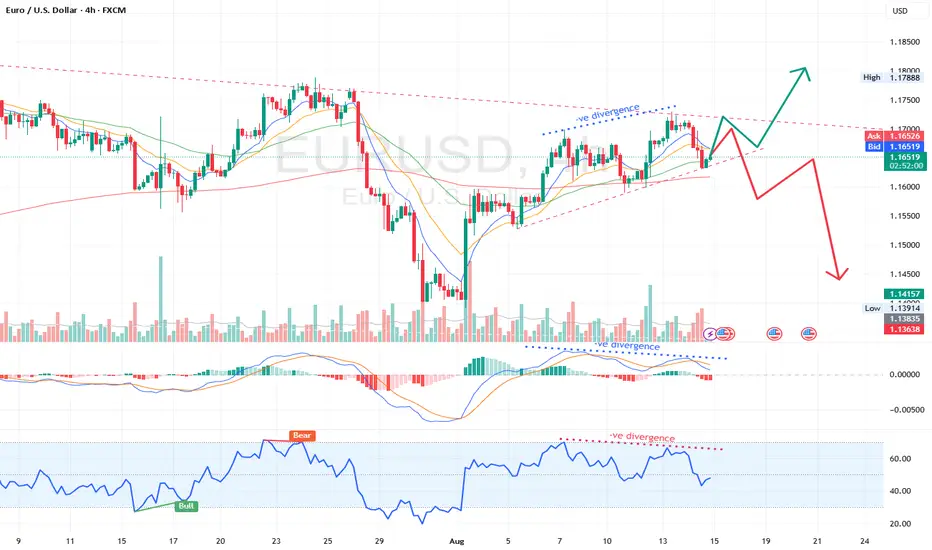
Where is EURUSD heading to ?EURUSD has significantly moved up since 1st August and is rejected at the trend line started from 01st Jul. It is decisively situated in a range as per the trend lines. Based on the current indicators, there are two diferent negative divergences indicated by both RSI and MACD. Strength of the current move is weak as per ADX indicator. But due to Trump and Putin meet planned on Friday and it can move in any direction based on outcome. So be prepared for the volatality accordingly and trade cautiously.
SPX: Bouhmidi-ReversalSPX starts with a gap-up and initially fails at the upper #BouhmidiBands. After the initial balance we have seen a breakout above upper Bouhmidi-Bands and now reverting back to bandwidth.

UPCOMING VOLATILATY!!!!!!!!!! Greetings, everyone!Don't forget to like and follow the idea if you like it.
Bitcoin has fluctuated within a range over the past two days.Bitcoin is unchanged and trading volume is decreasing.On Monday, the market may exhibit some volatility.This is how the new Bitcoin roadmap looks.On Monday, when the market opens, we can follow Bitcoin's progress.
By liking and following my ideas, please demonstrate your support for me.
Additionally, please share your thoughts with us in the feedback section.

BTC get ready for volatility @ 45kAs the title states. We are in for some serious volatility between 45k and the pivot.

Lowest Low ValueThe Lowest Low-Value indicator plots the lowest low price over a specific period.
Previously on my another video called "Highest High Value Indicator (HHV)" I explained how we can combine HHV with MA. (Link is provided below)
On this video, I am explaining how to use both LLV and HHV indicators combined with ATR to confirm trading signals.
HHV and LLV are very reliable in the trendy market, so it is wise to only use them when we have high ATR readings.
