Volume model Live Test #1Targeting a 20% move to the downside with no leverage as part of trend system live test.
Volume

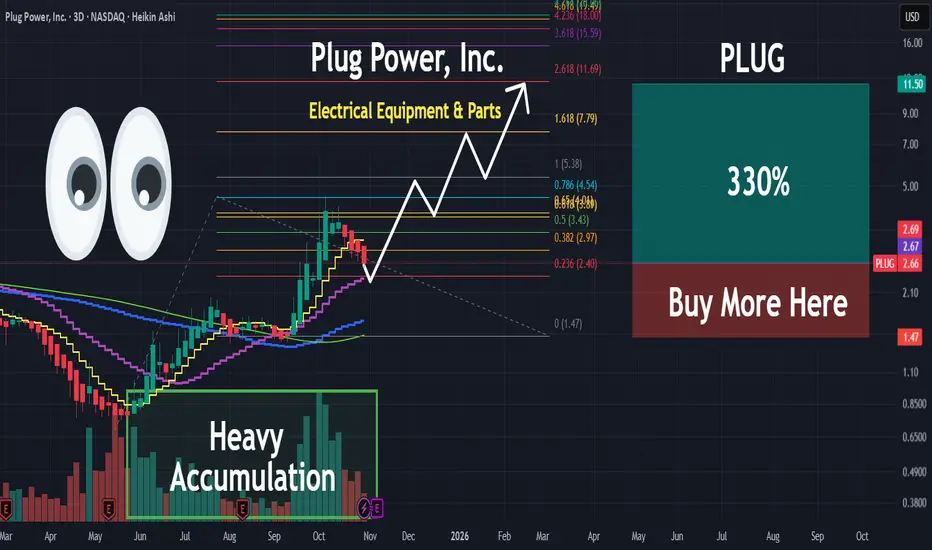
PLUG | An Epic Run Is Incoming | LONGPlug Power, Inc. provides alternative energy technology, which focuses on the design, development, commercialization, and manufacture of hydrogen and fuel cell systems used primarily for the material handling and stationary power markets. Its fuel cell system solution is designed to replace lead-acid batteries in electric material handling vehicles and industrial trucks for some distribution and manufacturing businesses. The company was founded by George C. McNamee and Larry G. Garberding on June 27, 1997, and is headquartered in Slingerlands, NY.
EUR/USD: Sellers Building Short Positions at Resistance 1.1613A strong resistance has formed on EUR/USD at 1.1613, confirmed by a heavy volume zone where sellers built short positions before a sharp sell-off. If price pulls back to this area, those sellers will likely defend it again. I’m watching this level for short trades.

USD/CAD Rejection Setup: Strong Support at 1.3899USD/CAD formed a strong support at 1.3899 based on a classic Rejection Setup. Buyers rejected lower prices, confirmed by a heavy volume zone and a small fair value gap. I’m watching this level for a pullback to go long, expecting buyers to defend it again.

SOL Up to 190 then down to 150Technical analysis. This is what it's all about man. Forecasting price.
So, I predict it's going to $190 because that's where my stop is, as I just entered short for no good reason in this sideways choppy market. Now price is guaranteed to hit my stop loss before actually making a huge move in my initial direction.
If I get stopped out, I'll lose $1000.
But I dont know, I haven't looked at metal commodities in the last few days, but those were coming down recently, so maybe people will start selling these kind of risky gold/crypto assets.
I'd also be curious about a possible gold-btc rotation thing. Has anyone looked into that? Let me know.

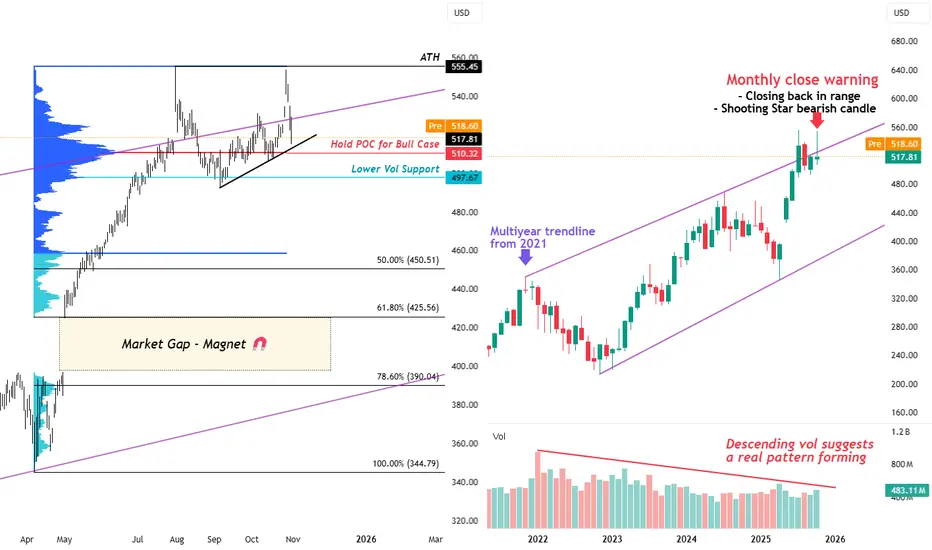
Warning: Microsoft closes BACK under Multiyear Range TrendlineMicrosoft has printed a significant bearish candle in October, and this is a major red flag for technical traders.
This candle not only aligns with a Shooting Star formation — a classic bearish reversal signal — but also closes back under a MULTI-YEAR rising trendline that’s been in play since 2021.
On the monthly timeframe (right chart), we can clearly see a rising channel forming over the past few years. The descending volume adds weight to this structure, suggesting true consolidation or distribution, not just a pause in trend.
📉🐻 Bias: Bearish - Monthly Rejection Candle
Unless buyers step back in soon, the risk of a deeper correction grows.
MONTHLY TIMEFRAME CONTEXT
Shooting Star rejection right at prior channel top
Closing back inside range after brief breakout attempt
Volume trending lower since 2021 — confirms pattern maturity
Interpretation: This kind of rejection after a breakout attempt usually signals exhaustion. Unless volume reverses sharply, the next few months could retrace toward mid-channel support (Around VAL at 50% Fib retracement).
DAILY TIMEFRAME ANALYSIS
MSFT’s recent volume profile highlights $510.32 as the point of control - price with the highest recorded traded volume.
Hold above $510–518 → bulls can still grind higher along the rising trendline
Break below $510 → opens room to test $497.67 (~$500 psychological support)
Below that, we enter the deeper retracement zone:
50% Fib at $450.51 → midpoint of the 2024–2025 rally
61.8% Fib at $425.56 → aligns with top of mid-2025 market gap
78.6% Fib at $390.04 → confluence with multiyear lower trendline, potential 2026 projection target
Market structure note: Losing the Point of Control (POC) at $517.81 would confirm the short-term trend shift and make the $450–$425 zone a strong liquidity magnet.
Closing Thoughts:
Microsoft’s fundamentals have started flashing caution too — not because growth is gone, but because expectations are stretched.
Last quarter’s cloud and AI segments still showed strength, but CapEx guidance surged, margins tightened, and investors didn’t love the tone of the forward outlook. Add to that a hawkish Fed backdrop , slowing enterprise spend, and rotation out of mega-cap tech, and you’ve got a setup that could easily unwind a bit of premium.
For now, it’s a “wait and see” moment — if bulls can defend $510 and the broader market stabilises, this may just be a cooling-off phase. But if we keep closing under the multiyear trendline, that’d confirm a shift from momentum to mean reversion, and the next few months could get interesting.
$TAO 1hGETTEX:TAO 1H
Beautiful falling channel breakout forming right at key support with clear upside targets (T1–T3).
If CRYPTOCAP:BTC stays stable and continues to perform well, this setup could easily push higher toward resistance. 📈

USD/CHF: Support at 1.7989 | Heavy Volume Zone + FVG ConfluenceUSD/CHF formed a strong support at 1.7989 where buyers built long positions before a sharp rally. The level aligns with both a heavy volume zone and a small fair value gap. I’m waiting for a pullback to this area to go long, expecting buyers to defend it again.

TWLO - Downtrend line BROKEN!TWLO - CURRENT PRICE : 134.88
The chart shared here is the weekly chart, where TWLO broke above its downtrend line with strong volume — a signal of growing bullish momentum. On the daily chart, TWLO formed a rising window (gap-up) last Friday — a bullish signal that often indicates strong buying momentum and potential continuation of the uptrend.
From a pattern analysis perspective, some traders may interpret the current setup as a bullish symmetrical triangle, indicating potential continuation to the upside. Next target will be 154.00 and 174.00. Support level is 114.73 (the low of window area based on daily chart).
ENTRY PRICE : 132.00 - 135.00
FIRST TARGET : 154.00
SECOND TARGET : 174.00
SUPPORT : 114.73 (CUTLOSS below this level on closing basis)

ASO LongASO range trade with extra targets if it continues.
Enter now or on pull back/test as close to 51 as possible.
Price reclaiming range from historic levels.
3 Weeks of rising volume on the breakout.
Trend line break out.
Appears to be bull flagging on the level. If you zoom in on daily it appears to getting ready to on the process of testing the flag breakout and/or horizontal level.
MACD been positive for two weeks now.
Price above 50 and 200 weekly ma's.
TP1 - top of range
TP2 - .886 fib
TP3 - 1.272 fib

USD/JPY Trade Alert🚨 USD/JPY Trade Alert 🚨
━━━━━━━━━━━━━━━━━━━
Type: 🟢 Buy Limit
Entry: 153.210
Take Profit (TP): 🎯 156.364
Stop Loss (SL): ❌ 151.999
━━━━━━━━━━━━━━━━━━━
📈 Status: Pending
💡 Market Insight:
Buyers remain in control while price trades above the entry. A retest of 153.210 may offer a stronger position for the next move up toward 156.364. A drop under 151.999 ends the bullish view.

ALUMINIUM trend may push it towards ATH the script is trading less than 10% away from ATH .
7 Days healthy consolidation already took place
the stock is trading with healthy volumes .
hindalco too trading healthy

PSU internal money shift likely?psu bank in strong trend and now with strong results and momentum
the selling volume a day ago and buying volume today show a different story for this script .however a short sell may trigger below 870 for 830 and 810 & 785 target areas .

SRF MAKING PIERCING CANDLESTICKSRF MAKING PIERCING CANDLESTICK , ALSO TOOK Support on gap , have eyes on this

Dow Jones Intra-day IdeaDJ after fridays consolidation and sweeping liquidity of Current Week and mittigating 4H demand. Doing "V" shape reaction and creating 15min Demand that makes our POI for this Intra-day idea.
My stoploss will be under 15min Demand and TP1+BE point will be at 1:2RR.
T2 will be on 15min supply (Only if price will not mittigate this zone before entering the trade.
Our final TP will be on Thursdays VAH That almost perfectly corespondates with 30min Supply.
Disclaimer: This is not a trading or financial advice

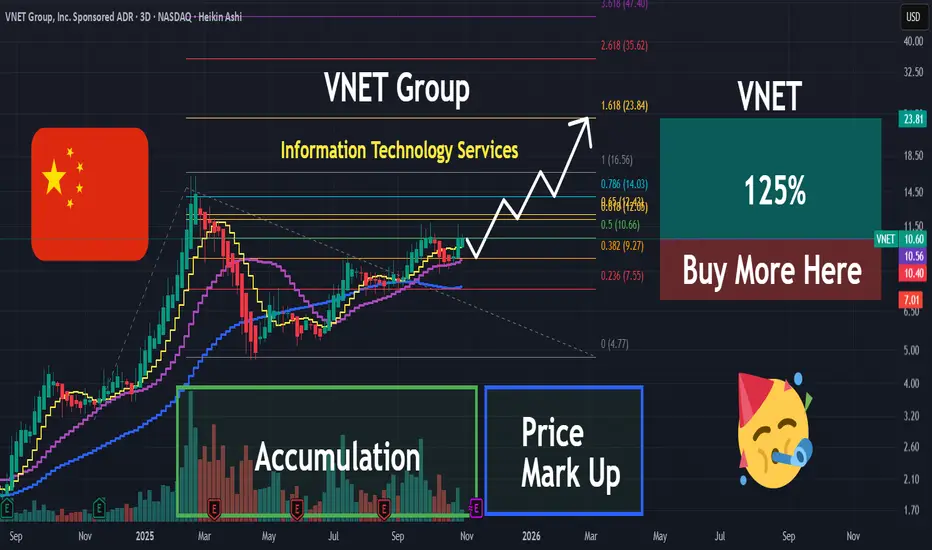
VNET | IT Services in China on the Rise | LONGVNET Group, Inc. operates as a carrier- and cloud-neutral internet data center services provider in China. It provides hosting and related services, including IDC services, cloud services, and business VPN services, to improve the reliability, security, and speed of its customers' internet infrastructure. The firm serves numerous industries, ranging from internet companies to government entities, blue-chip enterprises to small- and mid-sized enterprises. VNET Group was founded by Sheng Chen and Jun Zhang in 1999 and is headquartered in Beijing, China.
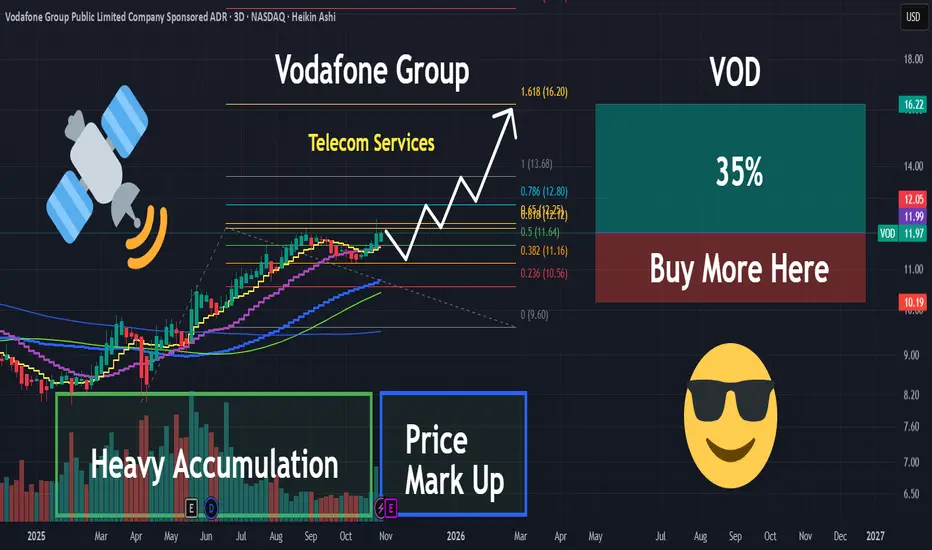
VOD | This Telecom Co. Is Ready to Explode Higher | LONGVodafone Group Plc engages in the telecommunication services in Europe and International. It offers mobile services that enable customers to call, text and access data, fixed line services, including broadband, television offerings, and voice and convergence services under the GigaKombi and Vodafone One names. It also provides mobile, fixed and a suite of converged communication services, such as Internet of Things (IoT) comprising managed IoT connectivity, automotive and insurance services, as well as smart metering and health solutions, cloud and security portfolio comprising public and private cloud services, as well as cloud-based applications and products for securing networks and devices and international voice, IP transit and messaging services to support business customers that include small home offices and large multi-national companies. The company was founded on July 17, 1984 and is headquartered in Newbury, the United Kingdom.
Bitcoin Update – November 1, 2025 - Revised 2026 target $46KBitcoin and Crypto Market Update – November 1, 2025
Bitcoin has completed its cup-and-handle pattern , hitting the technical target near $118,000 before rolling over into a fresh rising-wedge formation . The new structure is supported by declining volume , hinting at fading momentum and a potential pullback toward $46,000 .
Today’s move mirrors broader macro caution—the Fed’s pause on rate cuts and Trump–Xi trade tensions have triggered a wave of risk-off sentiment. Bitcoin is down 3.8% to $110,063 , Ethereum −3.6% ($3,853), and XRP −4.1% ($2.51).
Despite the dip, ETF inflows remain strong (BTC +$202 M, ETH +$246 M), showing institutions still buying the weakness. November historically delivers +42.5% average gains, but traders should stay alert as the rising wedge matures.
Technical summary:
* ✅ Cup & Handle target ≈ $118 K (completed)
* ⚠️ Rising Wedge forming → Target ≈ $46 K
* 📉 Volume decline = weakening trend strength
* 🟢 Institutional inflows = long-term support, volume declining over 5-10 year cycle
📊 Posted by Market Monkey — decoding the market’s next move.

FLNC 1D – The power comeback!On the daily chart, Fluence Energy (FLNC) shows a clean cup and handle formation followed by a golden cross (MA50 crossing above MA200) - a textbook bullish reversal setup.
Price broke out of the structure and is now pulling back into the buy zone ($14.57–$16.80) - a confluence of Fibonacci support and previous resistance.
✅ Golden cross confirms trend reversal
✅ Rising volume supports the move
✅ MAs below price - bulls are in control
The first target sits near $27.43, while the second projection extends to $40.28 if momentum continues.
Fundamentally, Fluence remains a leader in energy storage and grid technology - a hot spot for global investment as the renewable sector accelerates.
Let’s just say - this chart looks fully charged ⚡️

ARDX – Double Rising Window Hints Bullish ContinuationARDX – CURRENT PRICE : 6.06
The stock has broken above its long-term downtrend line accompanied by strong volume (look at red arrow). This breakout was confirmed by the formation of a Rising Window (1), signaling the end of the previous bearish phase.
Another Rising Window (2) appeared recently, again on high trading volume, reinforcing bullish sentiment and indicating the likelihood of a continuation in the uptrend. Take note also that the RSI has climbed into bullish territory (above 50), suggesting a shift in momentum towards buyers’ control and further room for upside before reaching overbought conditions.
ENTRY PRICE : 5.80 - 6.10
FIRST TARGET : 7.00
SECOND TARGET : 8.00
SUPPORT : 5.11 (bottom of the Rising Window area)

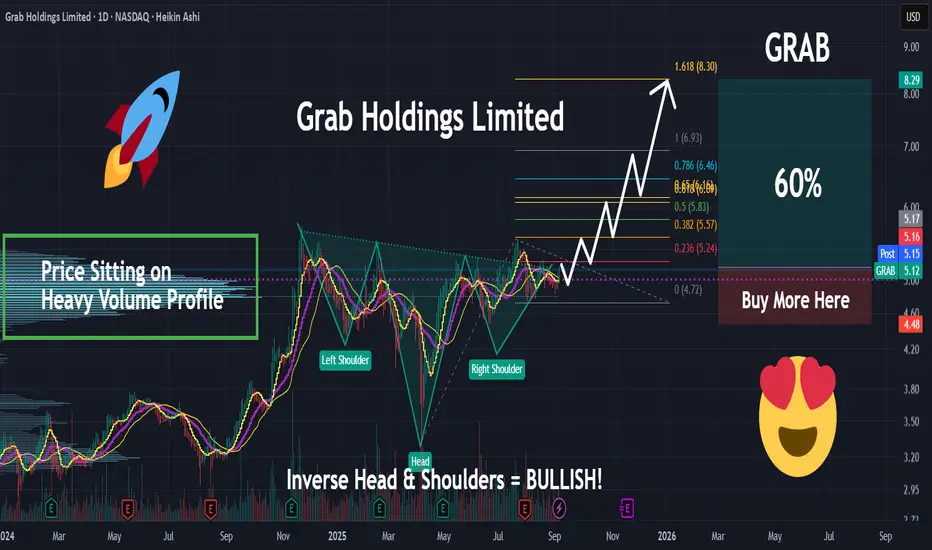
GRAB | The Time Has Come | LONGGrab Holdings Ltd. engages in the provision of millions of people each day to access its driver- and merchant-partners to order food or groceries, send packages, hail a ride or taxi, pay for online purchases or access services such as lending, insurance, wealth management and telemedicine, all through a single "everyday everything" app. The firm operates in food deliveries and mobility and by TPV in the e-wallets segment of financial services in Southeast Asia. It operates across the deliveries, mobility and digital financial services sectors in eight countries namely: Cambodia, Indonesia, Malaysia, Myanmar, the Philippines, Singapore, Thailand and Vietnam. The company was founded by Anthony Tan Ping Yeow and Tan Hooi Ling in 2012 and is headquartered in Singapore.
XAUUSD 15-Minute Chart Minor-Grade Short Entry Strategy XAUUSD 15-Minute Chart Minor-Grade Short Entry Strategy
Entry level around 4018 USD, stop-loss placed at 4053 USD.
1st target around 3940 USD: partial close (50% position), trail stop.
2nd target around 3870 USD: further partial close (50% of remaining), trail stop.
3rd target around 3800 USD: additional partial close (50% of remaining), trail stop.
Let the residual position run with progressive partial closures and stop trailing.

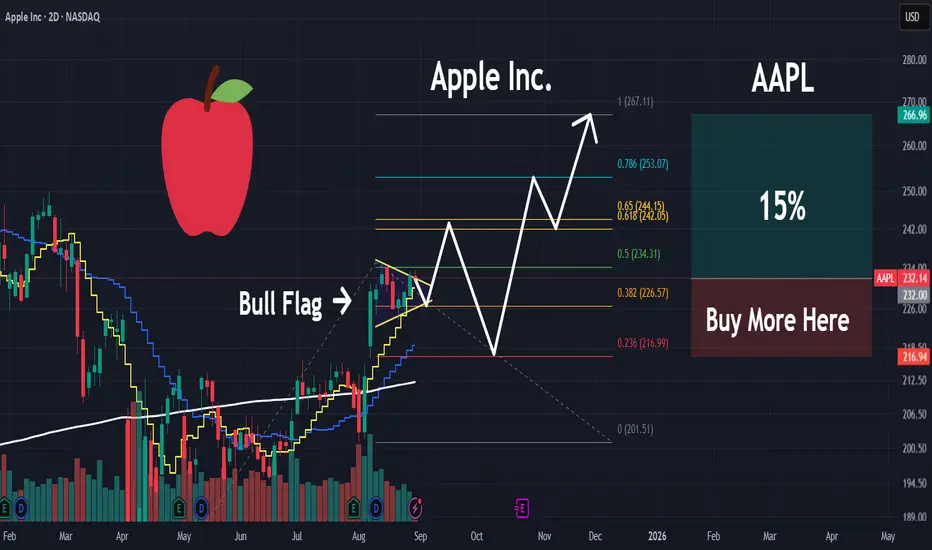
AAPL | Money will Rotate into this MEGA CAP | LONGApple, Inc. engages in the design, manufacture, and sale of smartphones, personal computers, tablets, wearables and accessories, and other varieties of related services. It operates through the following geographical segments: Americas, Europe, Greater China, Japan, and Rest of Asia Pacific. The Americas segment includes North and South America. The Europe segment consists of European countries, as well as India, the Middle East, and Africa. The Greater China segment comprises China, Hong Kong, and Taiwan. The Rest of Asia Pacific segment includes Australia and Asian countries. Its products and services include iPhone, Mac, iPad, AirPods, Apple TV, Apple Watch, Beats products, AppleCare, iCloud, digital content stores, streaming, and licensing services. The company was founded by Steven Paul Jobs, Ronald Gerald Wayne, and Stephen G. Wozniak in April 1976 and is headquartered in Cupertino, CA.