VRA: Historical Crossroad#VRA has been controversial after the significant supply increase that raised its MC out of thin air. With a team update coming soon, the chart is at a critical level.
Holding the demand zone could start a major recovery, but losing it leads to a severe breakdown.
#Verasity
VRA

Verasity ($VRA) Technical Analysis: Bullish Scenario
As of October 2, 2025, Verasity ( NASDAQ:VRA ) is trading at approximately $0.0012 USDT, with a market cap of around $11.6-11.8 million and 24-hour trading volume exceeding $17 million. The token has shown modest short-term gains, up about 0.6% in the last 24 hours and 4.6% over the week, but it's down 6-14% monthly and over 60% year-to-date. This places NASDAQ:VRA deep in a multi-year downtrend since its all-time high (ATH) of $0.0874 in October 2021, but recent chart patterns and indicators suggest potential for a reversal if bullish catalysts emerge. Sentiment on platforms like X (formerly Twitter) is mixed, with some highlighting a "bullish weekly close" and reversal candles, while others note failure to break $0.0013 and ongoing token unlock pressures.
NASDAQ:VRA 's fundamentals revolve around its video-sharing platform with blockchain-based ad tech and esports integrations, but price action has been weighed down by high token supply (over 9.9 billion circulating out of 10.3 billion total) and gradual unlocks, which could add selling pressure. That said, historical cycles show explosive potential— NASDAQ:VRA surged 36,859% in a prior bull run and 10,476% against BTC in 2021. If altcoin season ramps up in 2025 amid broader crypto recovery (e.g., post-rate cuts), NASDAQ:VRA could outperform as a low-cap play.
#### Overall Chart Structure and Technical Setup
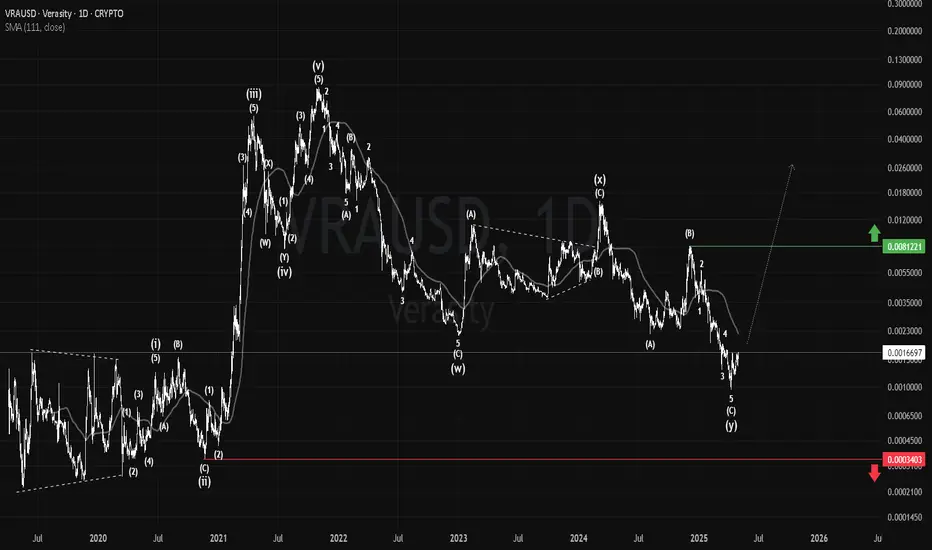
On the daily and weekly timeframes (VRA/USDT and VRA/BTC pairs), NASDAQ:VRA appears to have completed a deep multi-year correction from its 2021 peak, forming a potential bottom around $0.0010-$0.0012. This aligns with an Elliott Wave corrective pattern (ABC decline) or a harmonic setup, with recent price action breaking above descending trendlines on the daily chart. Volume has been elevated since late 2024, with bullish bars outpacing bearish ones near lows, indicating accumulation.
Technical indicators are mixed but leaning neutral to sell overall:
- **Oscillators (RSI, Stochastic, MACD):** Neutral, with recent sharp upside breaks in momentum indicators suggesting early bullish divergence. RSI (14) likely hovers around 40-50, not oversold but poised for a push above 50 on a breakout.
- **Moving Averages (MAs):** Strong sell signal currently, but NASDAQ:VRA recently closed above EMA50 and EMA100 on the daily, confirming medium-term bullish activation. The 200-day SMA is projected to rise toward $0.0015 soon.
- **Other (CCI, PPO, Bull/Bear Power):** Show buy signals and hidden bullish divergences, supporting reversal potential.
The weekly chart shows a reversal candle with a bullish close, potentially ending the bearish cycle that's lasted over 1,100 days (nearly 3x the 2021 bull run duration). Against BTC, NASDAQ:VRA is testing key Fib resistances from ATHs, with a breakout above 0.00000095 BTC signaling new highs.
#### Bullish Scenario
In a bullish case, NASDAQ:VRA could initiate a multi-wave rally if it holds current support and breaks near-term resistance, fueled by altcoin momentum, token burns (if announced), or platform adoption news. Here's the step-by-step outlook:
1. **Short-Term Breakout (1-4 Weeks):** Price consolidates in a demand zone around $0.0011-$0.0014, then breaks above $0.0015 (near EMA200/previous resistance). This could confirm a 5-wave Elliott impulse or harmonic completion, targeting 20-30% gains to $0.0018-$0.0020. Expect RSI to cross 60 and MACD histogram to flip positive for confirmation.
2. **Medium-Term Rally (1-3 Months):** If volume spikes and it clears $0.0020 (Fib 0.618 from recent highs), momentum could accelerate to $0.0025-$0.0035, a 100-200% move from current levels. This aligns with updated tokenomics acting as a catalyst, potentially mirroring the "surprise" upside seen in past cycles.
3. **Long-Term Bullish Wave (2025 Outlook):** Breaking $0.0082 confirms the end of the correction, targeting $0.025 (initial wave extension) or higher to $0.08 via harmonic patterns—yielding 2,000%+ upside. Optimistic forecasts see $0.0285 by year-end or even $0.0644 in a full altseason, though more conservative models cap at $0.0035 max. Risks include further unlocks (86.6 billion tokens still locked) dampening gains.
Key Levels to Watch
- **Support Levels:**
- Immediate: $0.00118 (24h low) – Critical hold for bullish invalidation.
- Major: $0.0010-$0.0012 – Multi-year bottom; breach could lead to retest of $0.0008 or lower.
- **Resistance Levels:**
- Near-Term: $0.0013-$0.0015 – Recent highs and EMA cluster; breakout here sparks short-term pump.
- Intermediate: $0.0020 – Fib resistance; clearing this opens $0.0025.
- Long-Term: $0.0082 – Key confirmation for bull market resumption.
Risks and Considerations
While the setup favors a bullish reversal if support holds, NASDAQ:VRA remains high-risk due to low liquidity, team inactivity complaints, and macro crypto pressures. Monitor for volume surges (>20-30% above average) and positive news. Use tight stops below support, and consider scaling in on dips. This is not financial advice—always DYOR and manage risk.
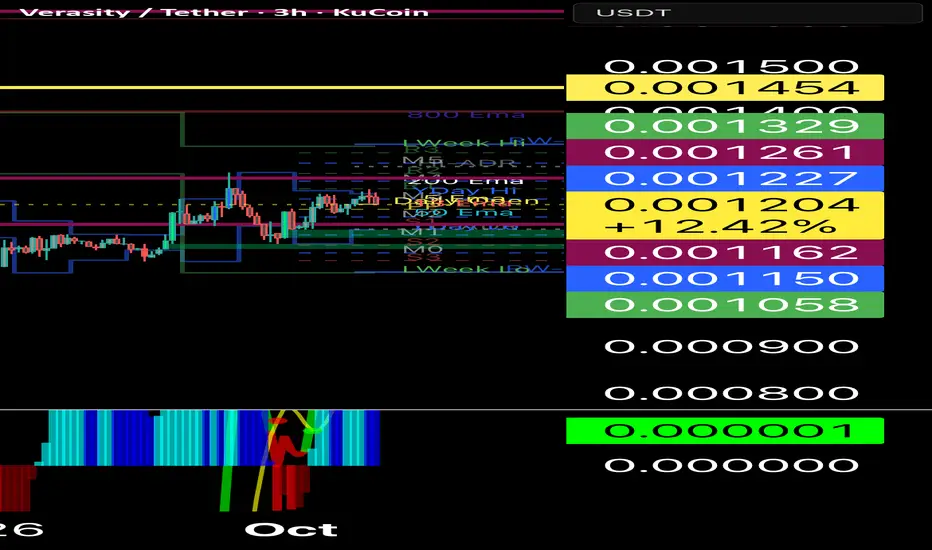
VRA/USDT — Deciding the Next Direction at a Critical Demand Zone🔎 Overview
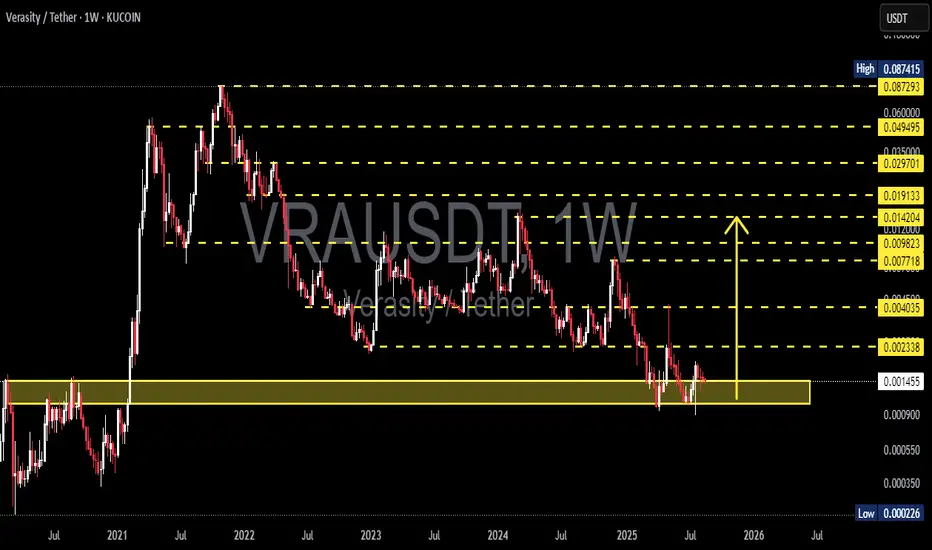
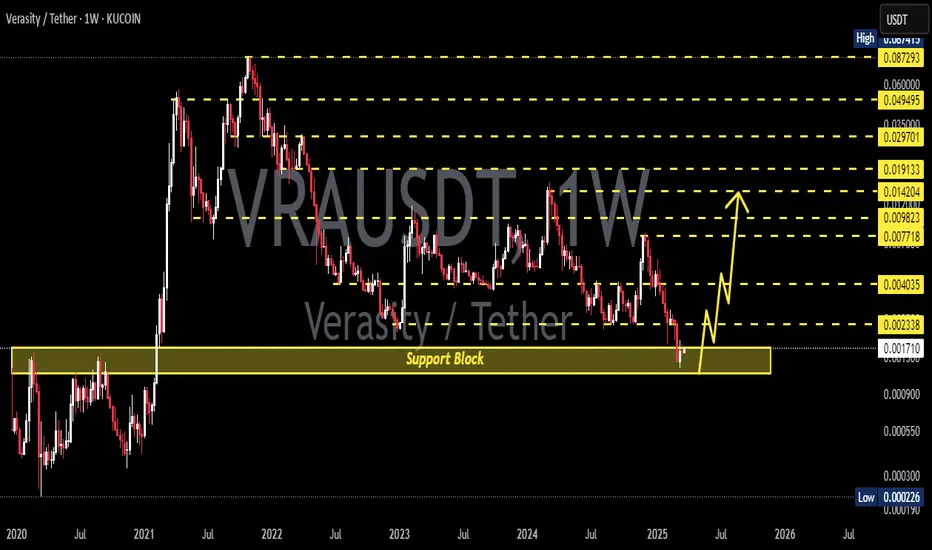
Verasity (VRA) has been in a long-term downtrend since the 2021 peak, forming consistent lower highs and lower lows. Right now, price is retesting a major historical demand zone around 0.0009 – 0.0017, an area that previously acted as a strong foundation for major rallies back in 2020–2021.
This is not just a number range, but a decision point:
👉 Will VRA confirm accumulation and reversal?
👉 Or will it break down below support and revisit historical lows?
---
📌 Key Levels (from chart)
Current price: 0.001456
Major Demand Zone (support): 0.0009 – 0.0017
Resistance levels (step-by-step):
0.002338 → 0.004035 → 0.007718 → 0.009823 → 0.014204 → 0.019133
Long-term targets: 0.029701 → 0.049495 → 0.060000 → 0.087415
Extreme historical low: 0.000226
---
📉 Structure & Pattern
Primary trend: Bearish since 2021.
Current structure: Sideways consolidation inside demand zone. Multiple long lower wicks suggest buying interest at lower levels.
Potential patterns:
Holding above 0.0009 with a higher low could evolve into an accumulation base (early stage reversal).
Failure to hold = possible continuation of downtrend toward new lows.
---
🚀 Bullish Scenario
Confirmation: Weekly close above 0.002338 with strong volume.
Upside targets:
TP1: 0.004035
TP2: 0.007718
TP3: 0.014204
TP4: 0.019133 (major supply area)
Extended targets: If the broader crypto market supports, VRA could potentially revisit 0.029–0.06 in the long term.
Strategy:
Aggressive: Scale-in within 0.0010–0.0016 demand zone, Stop Loss below 0.00085.
Conservative: Wait for breakout above 0.002338 before entering.
---
⚠️ Bearish Scenario
Confirmation: Weekly close below 0.0009 with strong selling pressure.
Downside targets:
0.0005 (psychological level)
0.000226 (historical capitulation low)
Implication: A breakdown would extend the bear cycle and delay recovery significantly.
---
📚 Extra Insights
This demand zone is essentially VRA’s “last stand” before retesting the all-time lows.
Market context matters: VRA’s ability to recover strongly depends on BTC trend and altcoin season strength.
Volume is key: Breakouts without volume are often fake; watch for strong confirmation.
---
📝 Conclusion
VRA is at a make-or-break point:
Bullish case: Hold demand zone + breakout above 0.002338 = potential multi-stage rally.
Bearish case: Breakdown below 0.0009 = opens path to 0.0005 → 0.000226.
📌 Short-term traders should watch 0.002338 as the breakout trigger.
📌 Long-term investors may see this zone as an accumulation opportunity — but risk management with strict stops is essential.
#VRAUSDT #Verasity #Crypto #AltcoinAnalysis #CryptoTrading #SupportResistance #TechnicalAnalysis #WeeklyChart #SupplyDemand
VerasityVra usdt daily analysis
Time frame daily
Target 0.00377 $
Risk rewards ratio >4.4 👈👌
Vrasityis a high Risk asset but I like it for small and fast benefits
Be carefull
For short time trade set LS tighter

VRA/USDT THE RETURN TO KEY LEVELVra has good chance to return to the key level, since the last data shows a growth in the volume.

VRAUSDT 1W AnalysisVRA ~ 1W Analysis
#VRA Buy back gradually from here if you still have confidence in this coin with a short-term target of at least 20%++ from this support block.

Verasity: Your Altcoin Choice (S2)I will do a new Top Altcoins Choice session next week so if you missed the previous two sessions you can participate in the next one. You can choose any Cryptocurrency project you want and I will publish an analysis for you.
Today we are looking at Verasity (VRAUSDT) on the daily timeframe. It has a standard chart for a Tether (USDT) trading pair.
Volume started to grow in November 2024 and remained high.
Bullish volume is high in relation to bearish volume as VRAUSDT hit a major low. The correction bottom.
High volume was present 10-March and 7-April. Two decisive points and both ended green. A reversal comes next.
There is a downtrend and this downtrend has been compromised, it is no longer safe.
It has been broken and there is an initial bullish breakout, the retrace led to the test of the descending trendline, once resistance, as support. This is classic trend reversal behavior. The first reaction is always corrected into a higher low before additional growth.
This is the start of a major bullish phase. Verasity hit the lowest price since early 2021. There can be growth for months or even years. This is as good as it gets if you are a buyer, prices will not go lower. This is the best time to enter if you are considering a LONG (Bullish) trade.
Thank you for your support, I am wishing you the best.
Namaste.

VRA: Completed Deep Correction#VRA has a long history of disappointing it's investors, but that may change soon.
It looks like it completed a major correction that began in Oct 2021.
Holding above $0.0012 keeps this outlook valid, while passing $0.0082 confirms targeting $0.0250 firstly.
#Verasity
How about this chart?? I think Vra is like any other altcoin is in the sale zone, even though it hit a historical low.
Just look at the technicals in every other coin you will see it, all coins will thrive the moment risk-on markets comeback after positive news

VRAUSDT 1WVRA ~ 1W Analysis
#VRA Buy gradually from here if you still have a Conviction on this coin with a short -term target of at least 20%+.
I think this is solid for vraKUCOIN:VRAUSDT
This is the core of the technicals for vra in my opinion.

VRA in 2025#VRA has been in a bearish trend since Oct 2021. The current price action isn’t bullish enough, so another dip is likely before a strong reversal.
The $0.00160–$0.00130 zone looks like a good buying area.
Passing $0.00815 confirms a shift.
Long-term hope remains as long as it stays above $0.00034.
#Verasity

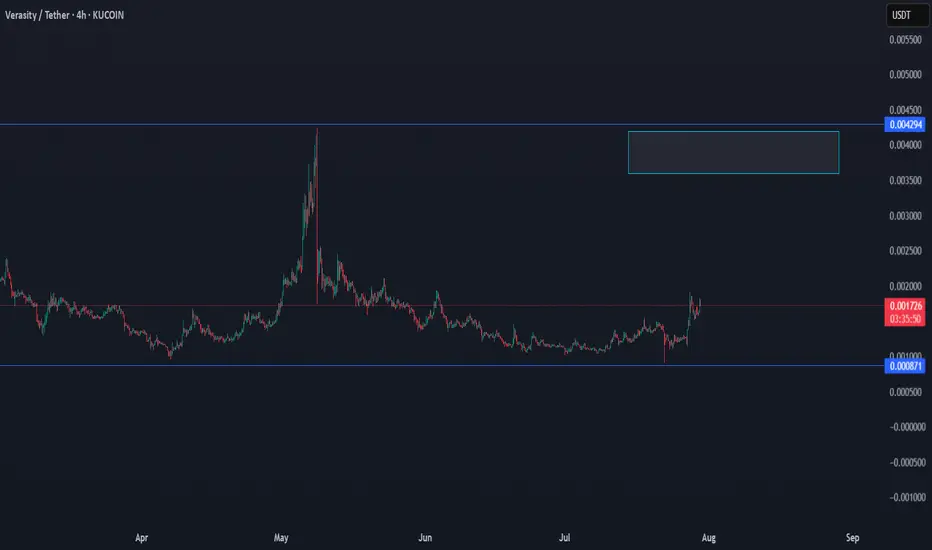
VRA LongThe Demand Zone (2023-2024) is showing a significant area of support where price has previously bounced. This area is crucial as it forms a base for future price movements.
The chart projects a Bullish Breakout (2025), where the price is expected to experience a sharp upward movement. The projected path indicates a series of strong rallies after the initial breakout from the demand zone. The price could reach higher levels, as indicated by the upward arrows.
The Time Exit is marked with the red text, which suggests a time window when it might be ideal to exit the position.
Potential Target: The price is projected to rise significantly after the breakout, with potential targets near the higher levels indicated by the chart's upward arrows.
Overall Outlook: The chart reflects a well-formed demand zone with an expected bullish breakout in 2025. Keep an eye on the demand area for potential entries, and monitor the time exit for possible profit-taking after the anticipated rise.

VRAUSDT - Very Bullish On This OneA low cap alt but one that shows its bullishness
I think price could move from where it is now way further up into the .C range and possibly even moon to a $
Similar areas in the boxes
Bullish daily chart

Long-Term Accumulation Strategy for VRAUSDTIn this analysis, we focus on a long-term accumulation strategy for VRAUSDT. The chart reveals key levels where accumulation could potentially yield significant returns, based on technical indicators and historical price action.
Accumulation Zones:
$0.00512: Identified as an accumulation entry point for 10-20% of your position. Potential price movement of approximately 5-10%.
$0.00385: Stronger accumulation zone for an additional 5-10%. Potential price movement of 10-15%.
$0.00252: Critical demand zone, optimal for accumulating 10-20% of the position. Potential price movement of 15-20%.
Distribution Zones:
$0.01168: First major distribution zone for partial distribution of accumulated assets (1-5%). Potential price movement of 120%.
$0.01636: Next distribution zone for further distribution (1-5%). Potential price movement of 220%.
$0.02091: Higher distribution zone, ideal for 1-5% distribution. Potential price movement of 310%.
$0.03082: Ultimate distribution zone for significant returns (5-10%). Potential price movement of 500%.
Price movement along these trend lines provides clear entry and exit points.
Increased volume at support levels indicates strong buying interest and validates accumulation zones.
Current market sentiment shows potential consolidation with bullish reversal signals supported by trend lines and volume analysis.
This long-term accumulation strategy for VRAUSDT focuses on systematically entering positions at identified accumulation zones and distributing at key distribution zones. This methodical approach aims to capitalize on both the technical patterns and market sentiment, ensuring a balanced risk-reward ratio.

Vrasity ( vra)Vra usdt analysis
Time frame daily
Risk rewards ratio >6.5 👈👌👈👈👈
Target 0.0118$
Very very good pump

VRAUSD - Bullish RSIAs we enter a strong bull market altcoins like this one pop up all over the place
The flat horizontal nature of the RSI suggests the trend is changing
This RSI has been flat for 853 days, being in a bull market its only a matter of time before the breakout occurs.
Keep an eye out for RSI's like this on other Monthly chart coins as it means they are most likely in the early stages of a moonshot.

VRAUSDT - Give Me $1 TargetSimilar horizontal movements can be seen between now and prior pre-bullrun
I think we are on the verge of another big move
LETS HIT $1 !!
A big move but I don't think its impossible.

VRAUSDTVRA ~ 1W
#VRA Make purchases gradually on this support block. Make purchases twice for the worst case scenario.
Target at least 20%++

VRA Move Ready...Buying Opportunity:
The price is currently near the right shoulder, slightly above the 0.002699 USDT support line. This suggests a low-risk entry point .
If the price moves upward and breaks the neckline at around 0.003013 USDT , this could confirm the bullish pattern, making it an ideal buying zone .
Target:
The green zone between 0.002699 USDT and 0.003013 USDT provides the target area for price movement, with the breakout potentially leading to a test of the resistance at 0.004064 USDT.
After the breakout above the neckline, a conservative price target could be the distance between the bottom of the head and the neckline added to the breakout level. This could project a target near the 0.004064 USDT resistance.
Conclusion:
A confirmed breakout from the neckline (green line) would trigger a bullish momentum, providing a solid buying opportunity with a potential target around 0.004064 USDT.

VRA Cleaned up short-term predictionKUCOIN:VRAUSDT Cleaned up version of my previous post prediction. Go back and look at Q4 Verasity 2023 and come back at look it this setup.

Is #VRAUSDT About to Explode? Critical Levels You Should WatchYello, Paradisers! Could this be the moment we’ve all been waiting for #VRAUSDT? Let's look at the latest analysis of the #Verasity and see what's happening:
💎We're seeing the strong potential of #VRA for a bullish continuation from a key bullish order block at $0.0024. For those of you tracking NASDAQ:VRA , this one is showing signs of gearing up for a bullish breakout.
💎 NASDAQ:VRA is currently following a descending channel pattern, and a breakout from this channel could send prices soaring. The first key target after a breakout is the internal minor resistance at $0.0034.
💎If #Verasity holds steady above $0.0024, we could be on the brink of a significant rally. We've seen explosive moves like this before, and a breakout above the critical resistance at $0.0034 could pave the way for a run toward even higher resistance zones.
💎But, caution is key, Paradisers! If momentum weakens around this critical demand zone, we might witness a pullback to the lower demand area in the $0.0021-$0.0022 range. A daily close below $0.0024 could invalidate this bullish setup and open the door to further declines.
Stay focused, patient, and disciplined Paradisers.
MyCryptoParadise
iFeel the success🌴
