VRA Is Testing Key SupportKey support and SMAs:
From November 2020 to April 2021 the price line of VRA surged more than 8000% that was a huge profit produced by Verasity. After the month of April, the price line retraced back at the key level support of $0.01. Right now the price line is testing this key level support and there is also a 50 simple moving average on the weekly time frame just below the key level support which is also working as very strong support for the price action of Verasity e
Moving at the resistance for long time:
On the daily time frame the price action of VRA is moving in a falling wedge pattern. It can be observed that the price line is making more attempts to break out the resistance than breaking down the support. We can also notice that after 29th June the priceline is not reaching the support of this falling wedge pattern and moving at the resistance.
If we take a look at the Bitcoin daily timeframe chart, then it is also going through the same situation. For the past several days the priceline of Bitcoin is moving at the resistance of the falling wedge and making more attempts to break out the resistance of the wedge than breaking down the support.
Daily BAT:
On the daily time frame chart, the priceline of VRA has formed a bullish BAT. The buying and sell targets of this BAT pattern can be as below:
Buy between: $0.01024 to $0.009801
Sell between: $0.01128 to $0.01286
$0.009801 can be used as stop loss. As per the above targets, this trade has a profit possibility of up to 31%, and the loss possibility is 5%.
Weekly bullish BAT move:
On the weekly time frame chart, the price action has formed a big bullish BAT pattern. There is also a 50 simple moving average support in the buying zone.
As per the Fibonacci sequence, the buying and sell targets of this Cypher pattern can be as below:
Buy between: $0.0123 to $0.0067
Sell between: $0.0255 to $0.0454
The maximum extent of potential reversal zone $0.0067 can be used as stop loss. As per the above targets, this trade has a huge profit possibility of 577%, and the big loss possibility is 46%. However, in order to minimize the risk, we can use the 50 SMA weekly as a stop loss.
Conclusion:
For the past several days, the price action of Verasity is moving at the resistance of the falling wedge and having nice support at $0.01. It is possible that the price action moves a little bit down and starts a reversal move because now this time on the daily time frame it has formed another bullish reversal harmonic BAT move.
VRA

Verasity (VRA) Is About To Breakout For Most Insane MoveWeekly 50 SMA and 0.01 support:
The price line of the VRA coin is moving above the $0.01 support level and the weekly 50 simple moving average, same as like the Bitcoin is moving above the weekly 50 SMA and being accumulated above this SMA.
Therefore once the Bitcoin will start moving up the Verasity can turn more bullish than Bitcoin
STOCH AND MACD:
If we take a look at the weekly time frame chart, and place stochastic and moving average convergence divergence (MACD) indicators, then it can be clearly seen that the stochastic has entered the oversold zone and clearly showing that the market is oversold. But the MACD is still very strongly bearish. Therefore, we can wait for the MACD to change from strong bearish to weak bearish then there can be a big move expected.
FALLING WEDGE:
On the daily time frame chart, the priceline VRA coin is moving in a falling wedge pattern. This pattern is considered as a bullish reversal and the price action of Verasity is moving at the resistance of this pattern for a long time period. Now if we take a closer look at the candlesticks then it can be clearly observed that the price action of VRA is testing the resistance more than the support. And the more it will test the resistance the more there will be chances for the breakout.
Big bullish BAT move:
On the weekly time frame chart, the price action has formed a big bullish BAT pattern.
There is also a 50 simple moving average support in the buying zone. As per the Fibonacci sequence, the buying and sell targets of this Cypher pattern can be as below:
Buy between: $0.0123 to $0.0067
Sell between: $0.0255 to $0.0454
The maximum extent of potential reversal zone $0.0067 can be used as stop loss. As per the above targets, this trade has a huge profit possibility of 577%, and the big loss possibility is 46%. However, in order to minimize the risk we can use the 50 SMA weekly as a stop loss.

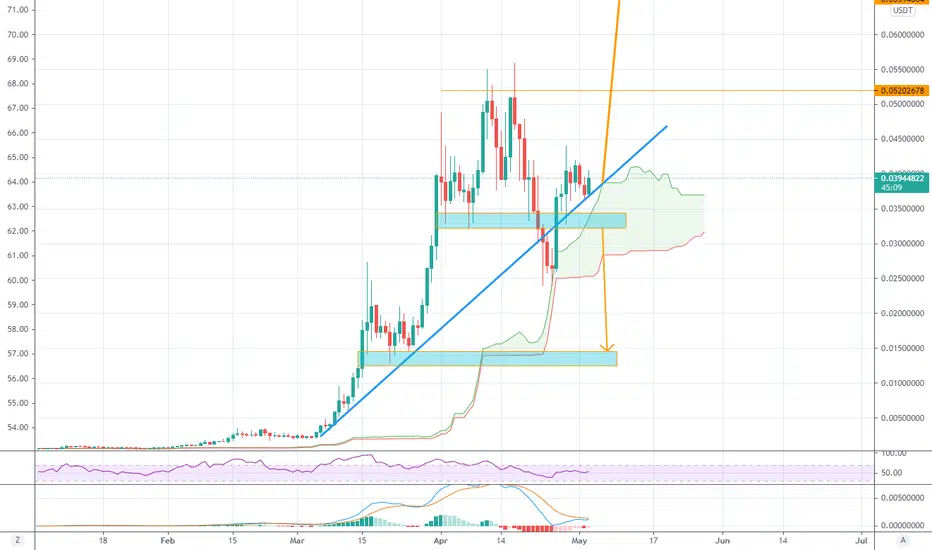
$VRA - Back to top ... Recent new listing on the BITHUMP exchange - increased liquidity nearly broke the trend line as you can see ....
Recent MACD bullish cross over on the daily chart
fall below yellow uptrend and look to buy in around the 0.1246 and if not 0.08 at worse.
#TradeSafe

Verasity (VRA) foremd a big bullish BAT for upto 577% rallyHey dear patrons, hope you are well, and welcome to the new update on Verasity (VRA).
On the weekly time frame chart, the price action has formed a big bullish BAT pattern. There is also a 50 simple moving average support in the buying zone.
Buy and sell targets:
Buy between: $0.0123 to $0.0067
Sell between: $0.0255 to $0.0454
Stop loss:
The maximum extent of potential reversal zone $0.0067 can be used as stop loss.
Possible profit and loss ratio:
As per the above targets, this trade has a huge profit possibility of 577%, and the a big loss possibility is 46%. However, in order to minimize the risk we can use the 50 SMA weekly as a stop loss.
Note: Above idea is for educational purpose only. It is advised to diversify and strictly follow the stop loss, and don't get stuck with trade

Potential VRA longLooking for price to grap liquidity at 0.012, since thats where the previous intraday support is at. and looking to take profits 0.0157.

VRA ROAD TO 1 USDTonly valid if it respects the channel.
it just seems impossible but we are in crypto ... who knows ??

VRAUSDT - VRA is looking bullish Unless BTC gets annihilated, this looks like a decent bullish set up.

My BTC planDONT PANIC, DCA, Take some off the table, HODL, Bitcoin might never be this cheap again for months, or you will get a shot at cheaper BTC. Good opportunity !
Btw, for some good alts, check out TRIAS, VRA and PDEX


VRA still bullishIn a rising channel, consolidating above major key level in a symmetrical triangle which is a neutral pattern. Unless it breaks down from the rising channel, VRA is bullish. considering that ETH and other alts are bullish, the odds of it going up are greater than down at the moment.


$VRA W PATTERNMaybe we can see this W pattern, and after that, we can reach another ATH!
VRA need volume to breakout

$VRA Accumulation and S/R Update$VRA Accumulation and S/R Update!
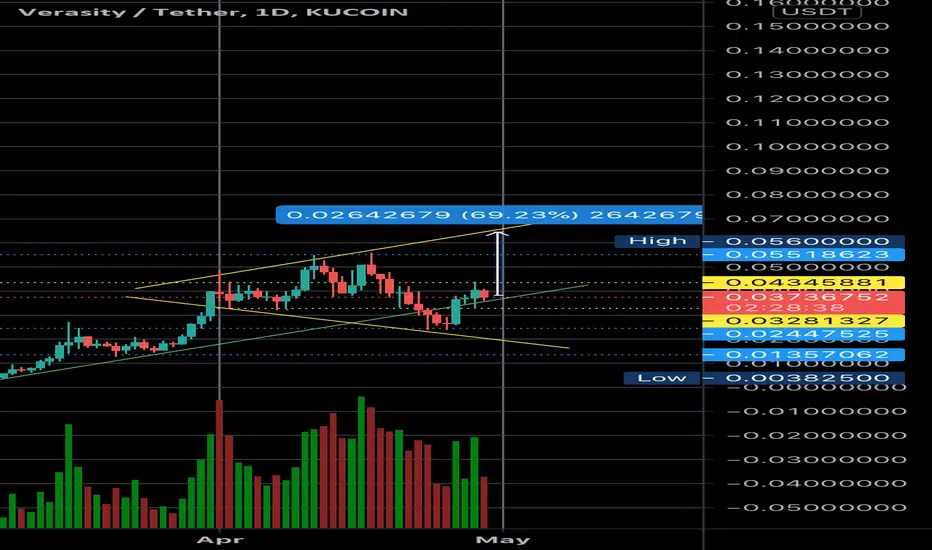
IF VRA break this level $0.040 then Next stop Probably $0.054

$VRA broke out from triangle and flag, now consoldatingVerasity broke out from the triangle/flag and is consolidating before continuing it's run up. The potential is almost 50% from here, and we can set an aggressive stoploss below the consolidation, or a safe stoploss under the flag's downward channel

crypto patternsFirst time using log comparisons... some follow each other identically... i.e. chz, theta and vra. Assuming Theta is the no.1 leading... others should follow moment after.


VRA Price Consolidation and good signalsVRA trying to recover the bullish channel, if VRA can broke this little bearshing channel, it can be re test the ATH (All Time Hight).
MACD and RSI are giving us good signals too.


VRA consolidating above key levelThis is not bearish, and the daily MACD about to cross up. Ichi cloud providing support and plenty of room of RSI to go up. Previous dip below key level counts as a false breakdown and is bullish.


$VRA is a must hold for alt szn 50% is easyBroadening formation. Reclaimed the “money trend” (green line) time to fly to new highs