VRA

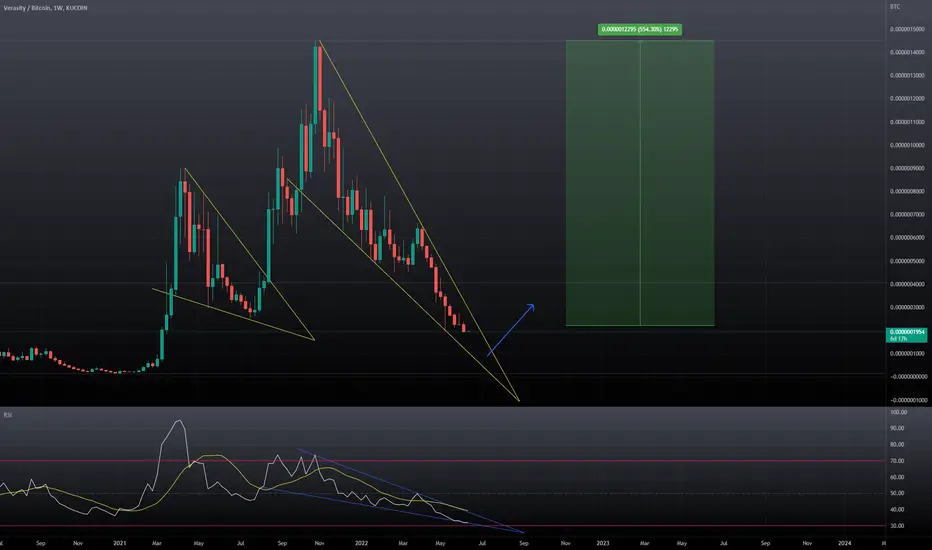
$VRA Verasity Massive Falling WedgeVerasity looks like it wants to break out of this massive falling wedge, I have currently longed on this token, and I have high hopes when we start the new bull market. This isn't financial advice, and I am truly eager to see this bad boy play out with a 500%+ potential to the upside.
$VRA is a BUY!VRA/BTC pair is a buy.
The MACD and Stoch RSI Align with the Candle above the 20 (2 day) Moving average (while in upward direction).
Point of Concern: The 12 hr and 23hr MACD/Stoch RSI losing momentum however on the 2 day chart it is holding up on the MAs
On the daily the 55MA acting as resistance while on the 19th July a resistance candle completed.

📈Verasity #VRA $VRA (Jul-19)VRA is having a very strong buying force and it has also successfully conquered the $0.0055-0.006 zone. In the near term, it is possible to continue to move to the $0.008 and $0.01 zones.
Now it has also broken out of the downtrend and we can completely believe in its future.
However, if it loses the $0.0055 zone, it will gradually fall back to the $0.004 zone to retest this zone and will rise again in August.


after that drop we can rise from this level to buy vra we should enter after break out of down-trendline ...
stop loss and take profit are clear ...

VRA LongBased on RSI, Venky Scalping and Williams indicator on Weekly TF. It seems like a good idea to accumulate as much $VRA als possible.

Verasity Idea 30 June 2022Verasity is heading towards the $0.003 price range, this opportunity wont last as bear market will end in a few months

Verasity VRA Idea 28 June 2022Verasity VRA Idea 28 June 2022 - may dump down to $0.003 before regaining some strength and moving up to challenge the 0.236 fib retracement
A is best case scenario with B being a worst case scenario

VERASITYVRA/USDT is the Metaverse best Project for the Futures this is Spot trade you can hold Long term This trade and you will enjoy In the Future MONEY

$VRA Bearish Pennant PatternThere's a bearish pennant pattern showing up on $VRA's chart.
Put money to the side!! This isn't financial advice but
if you want a great buying opportunity this could be that time!
potential downside target 0.001

VRA trading channel price predictioni do not have a clear target but this is a trading channel I have identified for VRA,
i would suspect that we would find a bottom at around the same time as trias, right after bitcoin bottoms,
i would guess we get to 0.003 but that is just speculation,
the channel is mostly to just see if VRA is against resistance or not, showing short term forcasts.

Vra bear and bull market expectation Vra is one of the greatest projects in Crypto market and am very bullish in this chart
Where can Vra price can hit 30 cents in the next bull market

VRA - two possible waysVerasity is moving in triangle. It is like 70/30 for price drop according to divergence, bearish weekly candle close and bitcoin bear flag. Dreams come true to accumulate at crazy prices.

VERSAITY FULL HIT FULL FIB LEVEL- Hey everyone hope you are all well!
- This is a chart of VERASITY I just wanted to show you how this crypto hit its peak FIB EXTENSION OF 89!
- My point here is that there are so many other projects which are sitting at their all time low and they can reach the FULL 89 FIB EXTENSION within the next 2-5 years!
- MY NEXT POSTS I will cover the projects that have a potential to reach the FULL FIB 89 EXTENSION!

Verasity LongOf course we are long, but before that, we expect price to retest market struture that sits at the Golden Ratio of the Fibs. From there we expect price to rally to move to all time highs as we resume the bull cycle.
Price targets: .11, .14, .23, .37, .47

VRA head and shoulders pattern on weekly frame BIG and obvious head and shoulders on the daily frame and now on the weekly frame as well.

VRANot financial advice.
The essence of investing & trading is the intelligent and patient preying on the greed, fear, impatience, addiction and ignorance of the majority. It's definitionally Darwinian.

VRA Forecast I believe that VRA can easily reach price targets of 0.2+ in the next bull run. This would put the market cap of VRA at around 1bn.

VRA daily still looks bullish to me and ready to move up!VRA Daily Chart:
This chart is seriously the most interesting
chart i see...It has had a huge Bull Pennant,
huge Head n Shoulders, Multiple sets of Adam and
Eve formations, Fractals have been super
bullish...leading into where VRA sits now...
Busted bullish thru the bearish descending
Trendline and what led that was a bullish
Adam n Eve to a perfect bullish Cup n Handle.
price targets listed...This chart is as sexy as it
can get...wait for a face ripping bullish move.
UPDATE 5-4-22, Im looking for VRA daily to break out
of the traingle and get above the Bull Flaf trendline.
RSI is very oversold and looks to make
a bullish move upward


$VRA Verasity Breaking 1D Support$VRA breaking a main support trendline on the daily TF. All levels lined up are previous lows/significant levels. It'll be key to hold right around that .0173 area.
IMO, a break under .017 and we could see a flush OR a massive wick. Or neither, who knows. Doesn't look great though.

$VRA breaking the resistance and aiming to $0.028There is a resistance that #VRA is trying to break in a matters of hours, if it breaks up then the target is the top of the resistance of the triangle, around $0.028/0.029.
I see in my opinion #VRA touching it an going back to $0.022/0.023 area before to break the triangle and have mayor targets such as $0.7/0.8.
