VRA/USDT — Deciding the Next Direction at a Critical Demand Zone🔎 Overview
Verasity (VRA) has been in a long-term downtrend since the 2021 peak, forming consistent lower highs and lower lows. Right now, price is retesting a major historical demand zone around 0.0009 – 0.0017, an area that previously acted as a strong foundation for major rallies back in 2020–2021.
This is not just a number range, but a decision point:
👉 Will VRA confirm accumulation and reversal?
👉 Or will it break down below support and revisit historical lows?
---
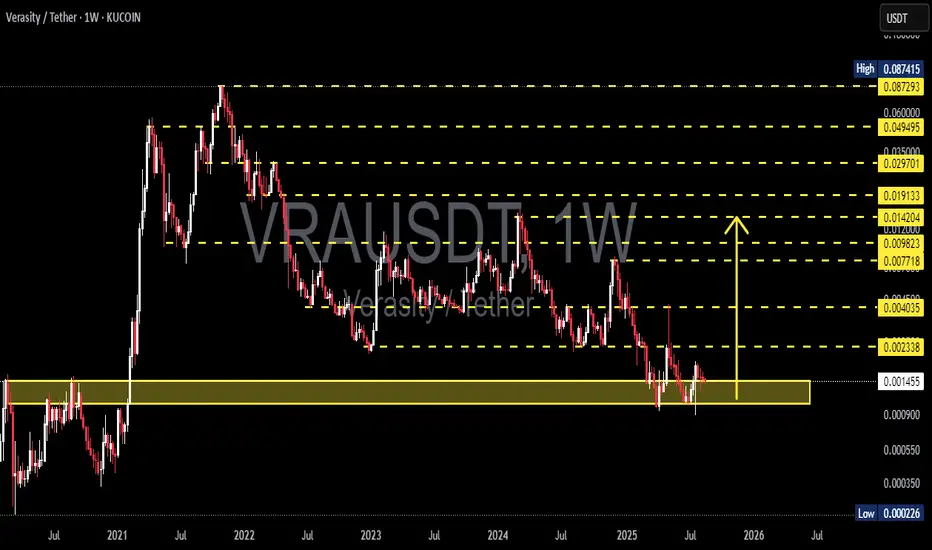
📌 Key Levels (from chart)
Current price: 0.001456
Major Demand Zone (support): 0.0009 – 0.0017
Resistance levels (step-by-step):
0.002338 → 0.004035 → 0.007718 → 0.009823 → 0.014204 → 0.019133
Long-term targets: 0.029701 → 0.049495 → 0.060000 → 0.087415
Extreme historical low: 0.000226
---
📉 Structure & Pattern
Primary trend: Bearish since 2021.
Current structure: Sideways consolidation inside demand zone. Multiple long lower wicks suggest buying interest at lower levels.
Potential patterns:
Holding above 0.0009 with a higher low could evolve into an accumulation base (early stage reversal).
Failure to hold = possible continuation of downtrend toward new lows.
---
🚀 Bullish Scenario
Confirmation: Weekly close above 0.002338 with strong volume.
Upside targets:
TP1: 0.004035
TP2: 0.007718
TP3: 0.014204
TP4: 0.019133 (major supply area)
Extended targets: If the broader crypto market supports, VRA could potentially revisit 0.029–0.06 in the long term.
Strategy:
Aggressive: Scale-in within 0.0010–0.0016 demand zone, Stop Loss below 0.00085.
Conservative: Wait for breakout above 0.002338 before entering.
---
⚠️ Bearish Scenario
Confirmation: Weekly close below 0.0009 with strong selling pressure.
Downside targets:
0.0005 (psychological level)
0.000226 (historical capitulation low)
Implication: A breakdown would extend the bear cycle and delay recovery significantly.
---
📚 Extra Insights
This demand zone is essentially VRA’s “last stand” before retesting the all-time lows.
Market context matters: VRA’s ability to recover strongly depends on BTC trend and altcoin season strength.
Volume is key: Breakouts without volume are often fake; watch for strong confirmation.
---
📝 Conclusion
VRA is at a make-or-break point:
Bullish case: Hold demand zone + breakout above 0.002338 = potential multi-stage rally.
Bearish case: Breakdown below 0.0009 = opens path to 0.0005 → 0.000226.
📌 Short-term traders should watch 0.002338 as the breakout trigger.
📌 Long-term investors may see this zone as an accumulation opportunity — but risk management with strict stops is essential.
#VRAUSDT #Verasity #Crypto #AltcoinAnalysis #CryptoTrading #SupportResistance #TechnicalAnalysis #WeeklyChart #SupplyDemand
Vrausdtanalysis
VRAUSDT 1W AnalysisVRA ~ 1W Analysis
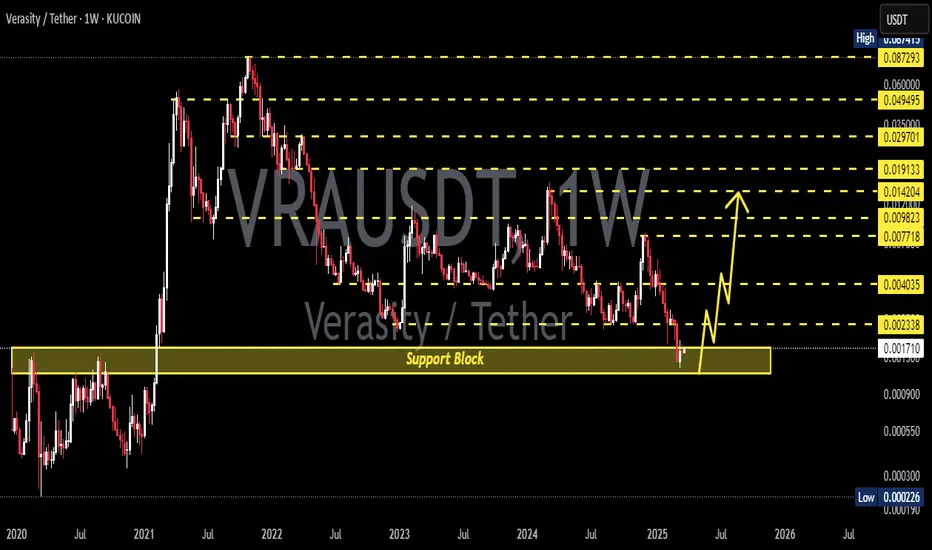
#VRA Buy back gradually from here if you still have confidence in this coin with a short-term target of at least 20%++ from this support block.

VRAUSDT 1WVRA ~ 1W Analysis
#VRA Buy gradually from here if you still have a Conviction on this coin with a short -term target of at least 20%+.
VRAUSDT Long-Term Accumulation StrategyIn this analysis, we focus on a long-term accumulation strategy for VRAUSDT. The chart reveals key levels where accumulation could potentially yield significant returns, based on technical indicators and historical price action.
Accumulation Zones:
$0.00512: Identified as an accumulation entry point for 10-20% of your position. Potential price movement of approximately 5-10%.
$0.00385: Stronger accumulation zone for an additional 5-10%. Potential price movement of 10-15%.
$0.00252: Critical demand zone, optimal for accumulating 10-20% of the position. Potential price movement of 15-20%.
Distribution Zones:
$0.01168: First major distribution zone for partial distribution of accumulated assets (1-5%). Potential price movement of 120%.
$0.01636: Next distribution zone for further distribution (1-5%). Potential price movement of 220%.
$0.02091: Higher distribution zone, ideal for 1-5% distribution. Potential price movement of 310%.
$0.03082: Ultimate distribution zone for significant returns (5-10%). Potential price movement of 500%.
Price movement along these trend lines provides clear entry and exit points.
Increased volume at support levels indicates strong buying interest and validates accumulation zones.
Current market sentiment shows potential consolidation with bullish reversal signals supported by trend lines and volume analysis.
This long-term accumulation strategy for VRAUSDT focuses on systematically entering positions at identified accumulation zones and distributing at key distribution zones. This methodical approach aims to capitalize on both the technical patterns and market sentiment, ensuring a balanced risk-reward ratio.
As on May 19:
Additional Details about Verasity (VRA):
Market Cap: Approximately $53 million
Fundamentals: Verasity is a blockchain-based platform for esports and digital content that aims to eliminate ad fraud and reward viewers and content creators fairly.
Potential: Rapidly growing esports market and increasing adoption of digital content platforms.
Previous Idea:

VRAUSDTVRA ~ 1W
#VRA Make purchases gradually on this support block. Make purchases twice for the worst case scenario.
Target at least 20%++

VRAUSDTVRA ~ 1W ✅
#VRA Make purchases gradually on this support block. Make purchases twice for the worst case scenario.
Target at least 20%++

VRAUSDT at monthly support, likely to head higherThe price has once again come back to monthly support MS1 zone. It has bounce since then and currently trading between MS1 and WR1. The price is likely to head towards WR1 in coming weeks. However, it is likely to be rejected from there at first and the price will pull back there before resuming its upward move. On this next upward move, it is likely to breaj this weekly resistance WR1 and move up further targeting towards monthly resistance zone MR1.
