Potential +50% Gain from PullbackSign of Strength in the chart:
1. Accumulation in Weekly Chart
2. Pullback Completed with Green Pentagon
Disclaimer
This information only serves as reference information and does not constitute a buy or sell call. Conduct your own research and assessment before deciding to buy or sell any stock
VSA

How to Profit from the Sideways MarketSign of Strength in the chart:
1. Strong accumulation stage
2. NS signal in the support
Disclaimer
This information only serves as reference information and does not constitute a buy or sell call. Conduct your own research and assessment before deciding to buy or sell any stock

Bears are attacking APPLE: 2 Major Weakness in the chartSign of Weakness in the chart:
1. Bearish market stages with Red Pentagon
2. Sell-Off with high volume
Disclaimer
This information only serves as reference information and does not constitute a buy or sell call. Conduct your own research and assessment before deciding to buy or sell any stock

3 Reasons Why Genting is on an uptrend movementSign of Strength in the chart:
1. High volume with change of trend
2. Reaaccumulation stage
3. Shakeout completed
Disclaimer
This information only serves as reference information and does not constitute a buy or sell call. Conduct your own research and assessment before deciding to buy or sell any stock

Is this a Healthy Pullback in SAPURA & SERBA ?Sign of Strength in the chart:
1. Line Change high volume
2. Downbar low volume
Disclaimer
This information only serves as reference information and does not constitute a buy or sell call. Conduct your own research and assessment before deciding to buy or sell any stock

Fantastic Volume with Pullback PatternSign of Strength in the chart:
1. Pullback setup
2. Close with support with right market stages
Disclaimer
This information only serves as reference information and does not constitute a buy or sell call. Conduct your own research and assessment before deciding to buy or sell any stock

Showcase: FCPO trade (Short to Long)1. Did a short trade on FCPO as the signs point to downtrend.
2. Price doesn't agree to downward movement as the upbars vol. is higher.
3. We flatten the trade at 5 points cut loss.
4. We then observe the chart and price seems to be moving higher; we have entered Long and will update whether we have achieve target or exit with loss.

The Beginning of Massive Downtrend....Sign of Weakness in the chart:
1. Bearish Market Stages
2. Bearish signal in daily chart
Disclaimer
This information only serves as reference information and does not constitute a buy or sell call. Conduct your own research and assessment before deciding to buy or sell any stock

Will the Shakeout Completed with Change of TrendSign of Strength in the chart:
1. Accumulation stage
2. Shakeout Pattern
Disclaimer
This information only serves as reference information and does not constitute a buy or sell call. Conduct your own research and assessment before deciding to buy or sell any stock

BTCUSDT 1HR WK #20Daily open in sight... If they take it with speed expect 26k real soon / if not then slow trend true trend
Weeks ahead setting up for decent range

BJFOOD Completed the Pullback in Weak Market Sign of Strength in the chart:
1. Green Pentagon with high volume
2. Market stages still in uptrend
Disclaimer
This information only serves as reference information and does not constitute a buy or sell call. Conduct your own research and assessment before deciding to buy or sell any stock

Showcase: Trading the e-mini Dow Jones (YM)1. Showcasing a simulation trade on e-mini Dow Jones. Price moving sideways earlier, setting the boundaries for Support & Resistance in 1 min chart.
2. I did a Long trade, looking at the price making a higher low while price and volume in 3min chart confirming this; closing on the high with higher volume.
3. Of course, there was some worry that price may move lower instead but the support and price movement on the upside seems to be strong.
4. Hit 10pts within 8 mins from Entry.

<TradeVSA> Solid Support but is it Ready to Breakout ?Sign of Strength in the chart:
1. Shakeout completed
2. NS signal at support
3. Volume increasing with Bullish signal
Disclaimer
This information only serves as reference information and does not constitute a buy or sell call. Conduct your own research and assessment before deciding to buy or sell any stock

<TradeVSA> Shakeout Completed in OVHSign of Strength in the chart:
1. Shakeout Pattern
2. Green Pentagon Bullish Signal
3. Healthy Pullback
Disclaimer
This information only serves as reference information and does not constitute a buy or sell call. Conduct your own research and assessment before deciding to buy or sell any stock

ZOOM - Avoided -71% Losses by Following Long-Term TrendSign of Weakness in the chart:
1. Mark-Down Stages
2. Sign of Weakness with Bearish signal in Weekly chart
Disclaimer
This information only serves as reference information and does not constitute a buy or sell call. Conduct your own research and assessment before deciding to buy or sell any stock

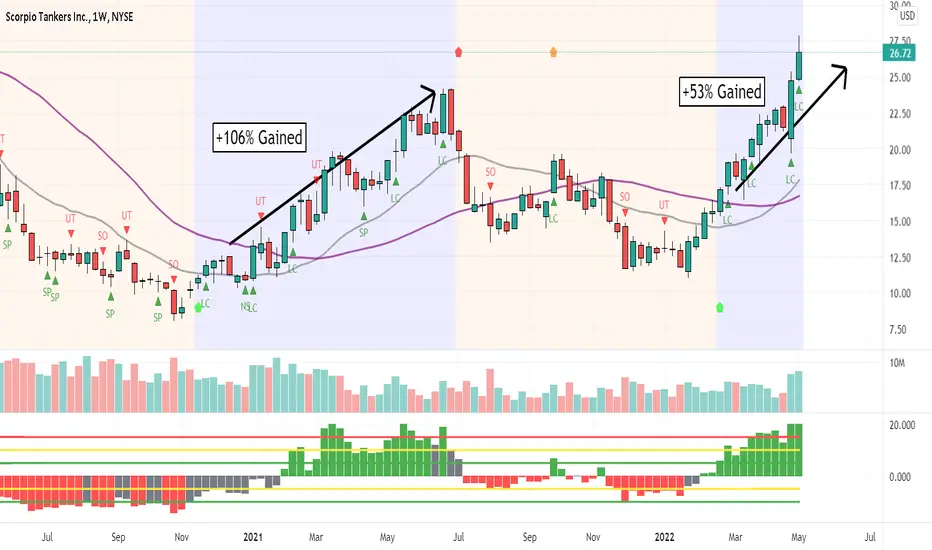
STNG - Uptrend Continue without DistributionSign of Strength in the chart:
1. Mark-up stage after Accumulation
2. Strong uptrend with Bullish Signal in weekly chart
3. Healthy Pullback in daily chart
Disclaimer
This information only serves as reference information and does not constitute a buy or sell call. Conduct your own research and assessment before deciding to buy or sell any stock
POST FOMC 1HR WK #18I encourage you to have a look at how price has behaved near the 1hr 800 ema or 4hr 200ema
Vol check


FB 1D FOMCVSA showing signs of possible trend change in the immediate future (thermo vwamp and vwma). Post FOMC will gie more information

BITCOIN IS STILL FALLING??? Analitics Good evening, ladies and gentlemen. Today we are going to take a look at Bitcoin.
First of all, we need to say that Bitcoin is in a bearish movement. No matter how hard he tried to rise, the sellers wanted to torture him a little bit. After we had seen a major break of market structure (CHoCH), our asses started playing out the bearish scenario. We have seen a strong downtrend with the zone (zones of supply), which were left above for Big Money to take more shot positions. As soon as we touched the SMT Trap zone (this is a fake zone, where SM Traders take the position and get stopped out), we saw another bullish bos, after which the asset went up. But this doe not last long and we pulled back to create a new low. Right now we are spending some time gaining new positions to make a move up. Unfortunately, the liquidity, which is left below, is telling us about another pullback. Right now the a lot of buyers were stopped out and liquidated.
We do not recommend you to take long positions, because market situation is not safe for us right now. Certainly, we could see a breakout, but this would not last for long. But you should now worry about the current situation. If the market structure changes, we will let you know the possible entry zones for scalp or swing trades. Keep safe. By order of the Peaky Blinders.

Wyckoff trading using the example of ADA/BTC Accumulation schemePay attention to the phases and letter designations on the graph that I showed on the ADA / BTC pair. (Cardano). A diagram of the accumulation phases is shown. Which are relevant for trading now. Several trading methods are combined on the chart:
1) Trading by the Wyckoff method.
2) Trade in horizontal channels.
3) Trade from important areas (price reversal points).
4) Trading in secondary local trends.
Now the price is at the important zone of the mirror level which, from the development of the situation, can act as support or resistance. Channel pitch 30%. You can work in two directions.
_________________________________
About Wyckoff's trading method.
The forerunner of volume analysis (VSA) is Richard Wyckoff. Roughly speaking, the whole point of the method can be expressed - trade for a major market player. The creator of this technique himself was a man who had a system-forming influence on stock trading. It was not a poor theorist who got rich after publishing books! He was a very successful trader and earned impressive capital in his day. The very method that he was allowed to achieve and the entire 40 years of experience in trading, he published in his book in the public domain is already closer to his death Wall Street Ventures and Adventures Through Forty Years. At the end of his life's journey, Wyckoff became more altruistic, and decided to share the knowledge that led him to wealth. He died in 1934.
The Wyckoff trading method was developed in the early 1930s. It consists of a number of principles and strategies originally developed for traders and investors. Wyckoff devoted much of his life experience to studying market behavior, and his work still has an impact on much of modern technical analysis (TA). Currently, the Wyckoff method is applied to all types of financial markets, although initially it was focused only on stocks.
During the creation of his work, Wyckoff was inspired by the trading methods of other successful traders (especially Jesse Livermore). Today, he enjoys the same respect as other key figures such as Charles Dow and Ralph Nelson Elliott. But for example, unlike Elliot’s theory, which is good in theory, but not always applicable in practice, the Wyckoff method is many times more effective for making money not in theory, but in practice.
_________________________________________
According to Richard Wyckoff's trading method, there are 3 laws:
1) The law of supply and demand.
2) The law of causation.
3) The law of communication efforts and results.
The first law states that the value of assets begins to rise when demand exceeds supply, and accordingly falls in the reverse order. This is one of the most basic principles in the financial markets, which does not exclude Wyckoff in his work.
We can represent the first law in the form of three simple equations:
1) Demand> supply = price increases.
2) Demand


EURUSD 24HR WK #17 plandemicMM decided to slam through the 2020. based off volume analysis im favoring high prices plandemic lows
