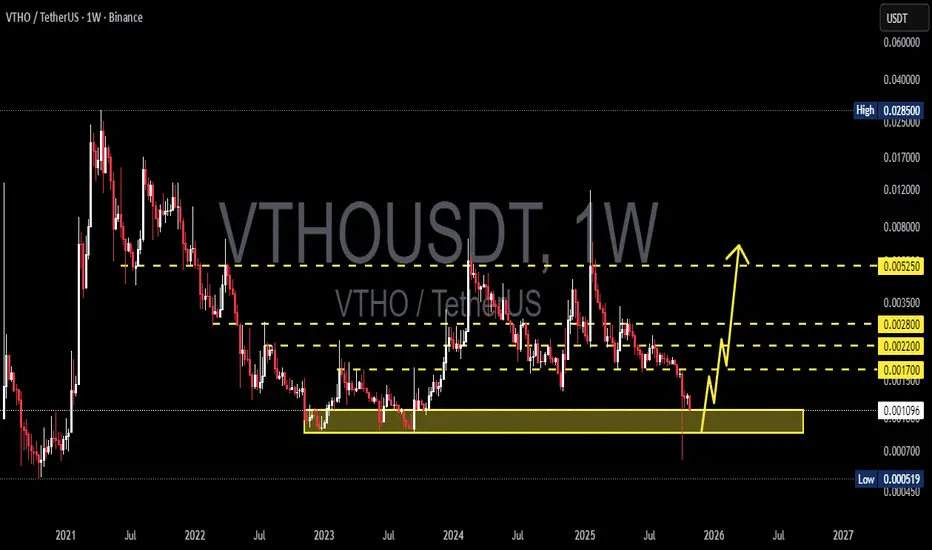
VTHOUSDT - Final Accumulation or Start of Capitulation?After nearly four years of continuous decline, VTHO has once again returned to a make-or-break zone — a strong demand area between 0.00109 – 0.00085.
This zone isn’t just a price range; it’s the final line of defense for buyers, which previously saved the market from a major breakdown in mid-2023 and early 2024.
But this time looks different — the latest weekly candle shows a deep wick below support, signaling a massive liquidity sweep and a possible re-accumulation phase if price manages to hold.
If not, the next scenario could be a final capitulation toward the all-time low around 0.00052.
---
Structure & Pattern
Primary Trend: Persistent bearish since 2021, though price now sits within a macro support zone.
Major Pattern: Potential double bottom / accumulation base if price closes above 0.00085 with a strong weekly candle.
Previous Price Behavior: Several strong rallies (+100–200%) have started from this same zone, but each failed to break through the 0.0022–0.0028 resistance range.
---
Bullish Scenario (Potential Reversal)
Weekly candle holds and closes above 0.00109, showing that buyers are defending the zone.
Rising volume confirms accumulation and may trigger a relief rally toward:
Target 1: 0.00170 — minor resistance & initial reaction zone.
Target 2: 0.00220 — light distribution area.
Target 3: 0.00280 — confirmation of a local trend reversal.
Final target: 0.00525 — key profit-taking zone if the macro reversal unfolds.
If the double bottom pattern confirms, VTHO could enter a mid-term recovery phase, pushing above the psychological 0.003 level.
---
Bearish Scenario (Further Breakdown)
A weekly close below 0.00085 would confirm that the long-term support has failed.
The yellow zone then flips into a supply zone (retest resistance).
Downside continuation would likely target 0.00052, the historical low and final support line.
A breakdown below 0.00052 would mark total capitulation, opening the door to new price discovery to the downside.
---
Market Outlook & Perspective
VTHO stands in a high-stakes phase, where a single weekly candle could decide the direction of the next several months.
The long wick below support suggests that the market is testing the conviction of long-term holders.
If the zone holds — the strongest hands will be rewarded.
But if it breaks, the market will write a new chapter in VTHO’s long downtrend.
---
#VTHO #VTHOUSDT #CryptoAnalysis #TechnicalAnalysis #SupportAndResistance #CryptoUpdate #CryptoReversal #PriceAction #MarketStructure #SwingTrade #CryptoChart
Vtholong
VTHO/USDT Reversal Zone? Weekly Demand Area Holds the Key!📊 Full Analysis of VTHO/USDT (1W Timeframe):
📌 Overview:
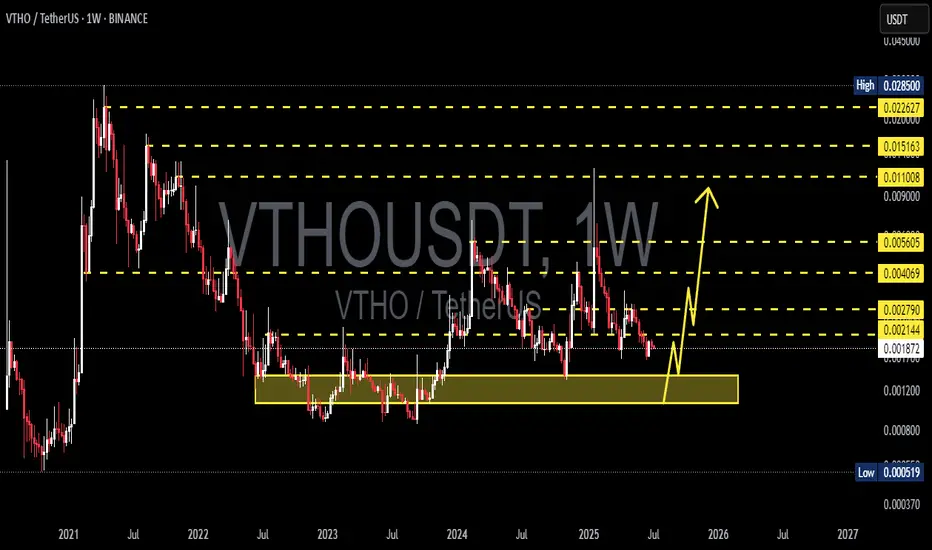
VTHO/USDT is currently sitting at a critical level after revisiting a strong historical demand zone around 0.0012–0.0018 USDT. This support zone has been respected multiple times since mid-2022 and has acted as a key reversal point in the past.
📈 Bullish Scenario:
✅ Support Zone Holding
The price is holding within the yellow support box, indicating active buyers and potential accumulation.
✅ Possible Reversal Pattern
If the price forms a higher low or a clear rejection here, there’s potential for a Double Bottom or even an Adam & Eve reversal pattern.
✅ Potential Upside Targets:
Minor Resistance: 0.00214 – 0.00279
Intermediate Target: 0.00406
Major Resistance: 0.0056 – 0.011
Higher Target: 0.015 – 0.022 USDT
Ultimate Long-Term Target: 0.0285 USDT (historical high)
📌 Bullish confirmation can come from: a strong bounce with volume, VeChain/VTHO ecosystem news, or general crypto market strength.
📉 Bearish Scenario:
❌ Breakdown from Key Support
If price breaks down below 0.0012, it opens the risk of a further drop toward 0.00052 USDT, which is the multi-year low last seen in 2020.
📉 Bearish signs to watch:
Weekly candle close below support
Increasing sell volume
Weak buyer reaction near support
🔍 Pattern Analysis:
📌 Potential Double Bottom Zone
The highlighted yellow zone may form the base for a double bottom reversal pattern—a bullish setup if confirmed.
📌 Range-Bound Structure
Price has been consolidating in a wide horizontal range between 0.0018 – 0.0056. A breakout from this range will determine the next long-term direction.
📢 Conclusion:
VTHO is at a critical accumulation zone. If the demand zone holds, a bullish reversal may unfold with significant upside potential. However, a breakdown below the zone would invalidate the bullish setup and signal deeper downside.
#VTHO #VTHOUSDT #CryptoAnalysis #AltcoinSeason #TechnicalAnalysis #BullishSetup #BearishScenario #CryptoTrading #SupportZone #ReversalPattern
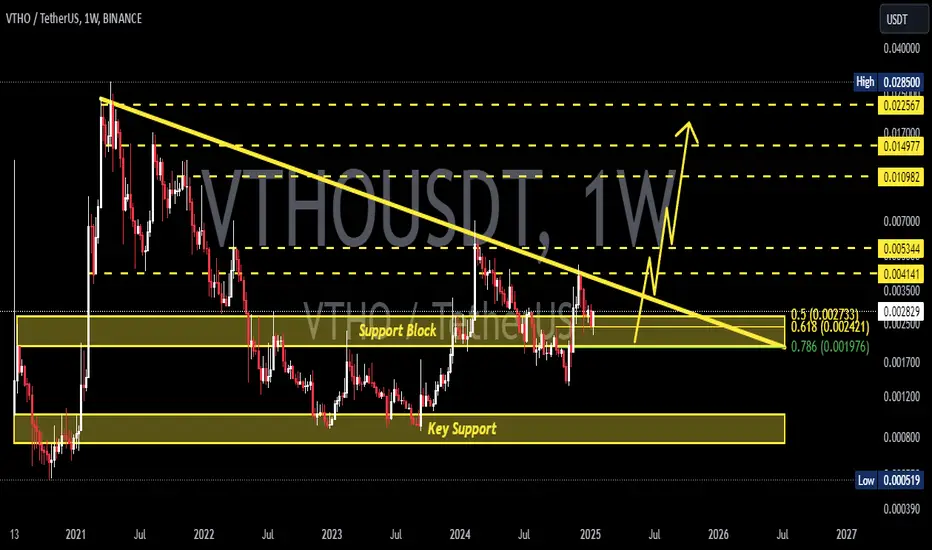
VTHOUSDT 1WVTHO ~ 1W
#VTHO So far it still maintains its bullish structure. If you still have Conviction on this coin,. Buy gradually within this support block with a minimum target of 20%+
Vtho Looks Promising For Midterm Seems Like Vtho Getting Ready for Massive Bulish Move In midterm
Forming descending Channel In day timeframe Incase Of Breakout expecting 300 to 320% bulish move

VeThor Token (VTHO) formed bullish Gartley for 22% moveHi dear friends, hope you are well and welcome to the new update on VeThor Token (VTHO) with US Dollar pair.
On a 4-hr time frame, VTHO has formed a bullish Gartley pattern.
Note: Above idea is for educational purpose only. It is advised to diversify and strictly follow the stop loss, and don't get stuck with trade

VeThor Token (VTHO) formed bullish Gartley for upto 110% pumpHi dear friends, hope you are well and welcome to the new update on VeThor Token (VTHO) with US Dollar pair.
On a weekly time frame, VTHO has formed a bullish Gartley pattern.
Note: Above idea is for educational purpose only. It is advised to diversify and strictly follow the stop loss, and don't get stuck with trade

$VTHO Arc de TriompheAn interesting look at $VTHO/USD following the inside and outside arc(s) almost perfectly to $.0038 support line where, if hit, should springboard up to a price between 1.618 - 3.618 fib extensions shown. Obviously, any close above the bull flag trend line, or below the aforementioned support will negate this analysis. DYOR. #carbon-is-the-new-oil BINANCEUS:VTHOUSD


VTHOUSDT POSITEV
#Vtho coin
Positive, God willing
#vtho
Buy between
Buy zoon
$ 0.02 / $ 0.0166
Goals, God willing
The goals of shaky hands
0.022 $ 📍0.04 $ 📍
The goals of the mighty patient
$ 0.026 $ 0.031 $ 0.041 $ 📍0.052 $ 0.62 $
Stpo loss
Close one candle below
$ 0.0133

VTHO/USDT possible move up Please don't trust market and use stoploss
For Donation If u like my analysis :
USDT : 0xaeac0e3d230da8b26d05af618e74c557a917315f
BTC : 1HuiRoQvUF2p5rf1YhPFZebuCJNSjXChkZ
ETH : 0xaeac0e3d230da8b26d05af618e74c557a917315f

VTHO UPDATE 2Hello guys. We hit the 0.024 perfectly. Other take profits avaliable at the below. Good Luck :)
New TP1 0,035
TP2 0,045
TP3 0,071

VTHO UPDATEWhen we look at the bollinger bands on the daily chart, we see the baseline level as a very good reference in the previous draws. We are now at the bollinger base level, so as long as the bulky breakdown downward does not occur, there is nothing to be afraid of. Our direction is still up. Good luck

VTHO about to break outVery noticeable repeat of start of previous pump up has been spotted and right now it is about to start making the flag before the pump. If it be the same size of pump as last we could expect it to reach 0.0295 or even higher giving a 77% pump from the flag, but it could even go higher.

VTHOUSDT next leg up? 🤷♀️Hello Traders. I hope you are having a fantastic 1st of April.
Today I want to share my thoughts on VTHO. As you can see, VTHO broke the resistance ( purple range ) on 20 march and had a nice bullish run.
Now it has made a pullback to the resistance area now acting as a support for it. Also we have a blue short term trend line acting as a support.
So overall, in my opinion, you can make a nice long position here.
Entry = 0.0135 $ Target 1 = 0.024 $ Target 2 = 0.08 $ Stop loss = 0.0125 $ ( if the 4H candle closes below the support area )
🚩 Always remember to put stop loss for your orders in order to reduce the risk of your trades.
🚩 Always keep an eye on BTC chart as well because it can affect the movement of altcoins as you all know my dear traders.
If you want to check out my other analysis , I have linked them below and also don`t forget to follow me for further updates and new analysis.
Thank you guys for reading my idea on VTHO and don`t forget to comment what you think. ✌

