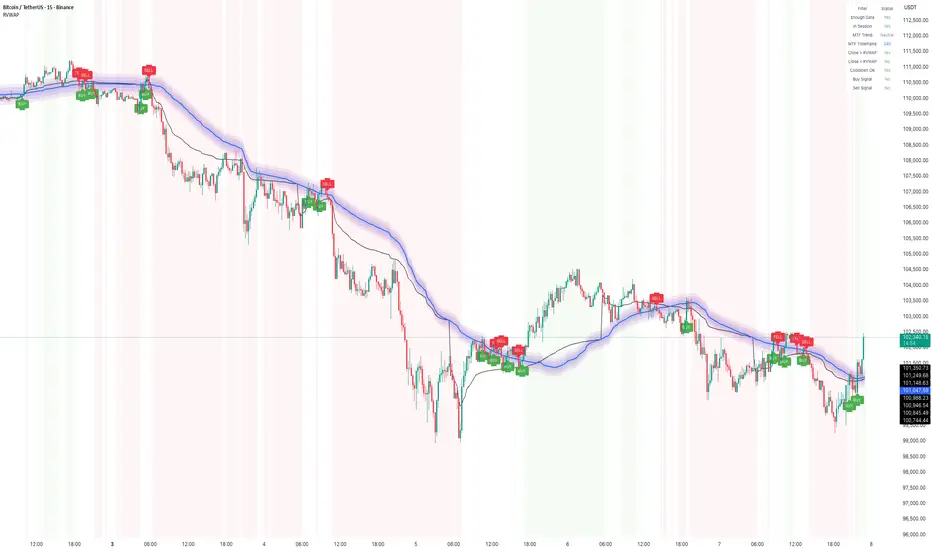
How to Use Rolling VWAP – Early US Session Trend TrackerIn today’s BTC/USDT 15-min chart, the Rolling VWAP perfectly captured the directional bias throughout the session.
The smooth transition between compression and expansion phases clearly aligned with VWAP slope shifts — giving multiple early signals during the US market open, when volatility tends to expand sharply.
Performance Highlights
• The indicator tracked clean trend waves with minimal lag, showing how price respected the VWAP envelope dynamically.
• BUY and SELL zones were well-defined, with fading reversals quickly replaced by trend-aligned setups.
• Session filter (US Market) ensured signals appeared primarily during active volatility windows, avoiding false setups during low-volume hours.
• The rolling nature of VWAP (instead of session-based VWAP) allowed continuous trend capture across intraday transitions.
Additional Notes
1. Cooldown Setting:
Currently set to 1 candle — which makes the chart more responsive but slightly denser with signals.
Increasing it (e.g., to 3–5 bars) can make the chart cleaner, though some reversal entries may not display visually even though they’re logically detected.
2. US Session Filter:
The logic focuses on the early US market phase, effectively capturing directional bursts when liquidity and volatility spike — ideal for short-term scalping or trend continuation setups.
⸻
🧠 Tip:
Combine the Rolling VWAP bias with higher-timeframe structure (e.g., 1H trend) for even more reliable directional trades.
Vwapbreakout
HOW To use Order Flow / Delta Volume Indicator to identify TrapOrder Flow / Delta Volume Indicator: Performance & Trap Identification Analysis
### Overview
The Order Flow / Delta Volume Indicator analyzes real-time buying and selling imbalances , accurately capturing momentum shifts and highlighting potential market traps . This analysis clearly demonstrates the indicator’s effectiveness in pinpointing trend reversals, momentum shifts, and identifying price traps.
Indicator Functionality
- ** Order Flow Dynamics **: Tracks cumulative buy/sell volumes, indicating shifts in market sentiment.
- ** Delta Volume Analysis* *: Highlights buyer-seller imbalances, pinpointing precise moments of significant market activity or divergences.
- **Signal Logic**:
- ** Buy Signals **: Generated when positive order flow aligns with positive delta, suggesting buying dominance.
- ** Sell Signals **: Produced when negative order flow and negative delta indicate increased selling pressure.
- ** Trap Identification **: Divergence between cumulative delta and price direction signals potential market traps . For instance, rising prices with declining cumulative delta suggest weakening buying pressure and possible bearish reversals (traps).
Performance Insights (from chart)
1. **Bullish & Bearish Signal Accuracy**
- Clear, timely bullish and bearish signals aligned precisely with genuine market momentum shifts.
- Robust performance capturing sharp upward and downward price movements, validated by volume spikes.
2. **Effective Market Trap Identification**
- Detected key divergences between cumulative delta and price movement, effectively highlighting potential market traps.
- Example highlighted: recent market scenario where price rose while cumulative delta declined, signaling weakening bullish momentum and indicating a potential bearish reversal.
3. **Momentum Shift Reliability**
- Successfully differentiated significant momentum changes from short-lived price movements.
- Signals consistently matched subsequent market behavior, reinforcing the indicator’s reliability.
Key Takeaways
✅ Accurate and timely identification of trend reversals and continuation.
✅ Effective in highlighting divergences, significantly aiding in identifying market traps.
✅ Clear volume-based signals, ensuring traders can easily interpret market conditions.
✅ Consistent performance across diverse market scenarios, demonstrating strong analytical capability.
The Order Flow / Delta Volume Indicator remains an essential tool, reliably capturing crucial market turns and effectively highlighting potential traps through clear cumulative delta divergences.

Daily-chart reveals 1,000,000 different ideas for profit. GBPNZD
It's been a big bullish day in Asia for GBPNZD Longs, up over 0.5% today but I think so long as GBP financial news today is not disruptive for the pound, then I think we can be sure that this is the one to breakout and retest those highs 2.1880, we are only about 1% below that level.

Continuation Open Interest to 1.0600Riding with pen interest after LO open to 1.0600
-Liquidity Grab
-Profile gap filled
-Double bottom
-Bullish market structure
Vwap Breakout


10RR Cont. >VWAP-Bearish cum. delta on the day
-Continuation on structure
-move from vwap
-confirmed by OF
-Entry off imbalance on VP

UROY an energy penny stock LONGUROY basically sells rights to mine uranium for a percentage of the production. It is a penny
stock in the nuclear subsector of energy which is undergoing a renaissance in this era of
fossil fuel addiction detoxification in the context of climate change remediation agendas.
The 240 minute chart shows a parabolic move in mid January followed by consolidation
and capitulation into a double top all at about the first anchored VWAP line above the mean
followed by a trend down into the present level near to the first lower VWAP line.
I will take a long trade here targeting the mean VWAP confluent with a standard Fibonacci
retractment which is the green line on the chart. $.05 is taken as a safe stop loss at the lows.
The target is 0.40 upside yielding a R:r of 8. I have positions in URA and UEC at this time.
The entire uranium subsector is cycling from warm to hot again.

SPY Daily Chart Analysis: Approaching Key Resistance at $564Looking at the SPY daily chart, the price has recovered well from its recent pullback and is now approaching a significant resistance level around $564.
Key Levels:
Resistance at $564: The green dashed line highlights this key resistance zone. SPY has tested this level multiple times, and we’re nearing another test. Each time the price approached this zone, it faced rejection, making it a critical level to break for continued upside.
Support at $552.49: This is the immediate support zone, and it’s holding strong. Any pullback towards this level would be a natural correction but as long as we stay above it, the bulls remain in control.
What I Expect:
Potential Breakout: If SPY manages to break and hold above $564, we could see a significant rally, possibly testing higher resistance levels around $570. However, failure to break this resistance might lead to another pullback, with $552 acting as the first major support.
Sideways Action:
There’s also the chance that SPY could consolidate in the $552 - $564 range before making a decisive move in either direction. This would create a buildup of momentum before the next big breakout or breakdown.
Final Thoughts:
We’re at a critical juncture. If the bulls can push through $564, we might see a continuation of the larger uptrend. However, resistance here has been strong, so I’ll be watching closely for either a breakout or a rejection at this level. Stay cautious and watch for clear confirmation before making your move.

LCID Anchored VWAP based swing trade LONGLCID on the 15 minute chart is shown with two sets of anchored VWAP lines overlaid being set
at the pivot low of April 22 and the pivot high of May 6th. LCID completed a trend down today
which began on May 6th. Price has reversed and is breaking up through VWAP band lines on the
chart. The faster green RSI line has crossed over the 50 level in the past trading session. Price
is now about to cross over the longer mean black VWAP line. I am taking a long trade here
targeting 2.88 for 25% of the position, 3.10 for 50% of the position and the reminder for a
runner position to extend for the uppermost band lines. The first two targets are based on the
intermediate VWAP lines as well as the upper and lower boundaries of a standard Fibonacci
retracement. The stop loss will be raised incrementally from its initial setting of
2.74 at the top on the EMA cloud. As the trend down took a few weeks. I am expecting a 2-3
week long trade following a projected trend up.

GE is GEAerospace a buy 5% below its ATH? - LONGGE is now priced at 5% below its recent ATH. The daily chart shows it to be on a VWAP breakout
over two standard deviations above the mean anchored VWAP originating in 2 and a half years
ago. Price has dipped and pulled back to the midline of the Bollinger Bands and buying volatility
is fading as can be seen on the indicators. I see this as a safe point to add to my GE long
positions of shares and call options. Having trimmed some of those positions 4 weeks ago, I
will add the same amount back in along with 20% extra. When earnings are upcoming in
August I will again look for a pivot high from which to trim again.

UNG Natural Gas ETF now rising from its reversal LONG (XNGUSD )UNG on a 120-minute chart has reversed from a long trend down which started in mid -January.
This was a steep trend down from the start into mid- March where the trend angle lessened in
a period of relative consolidation until May 1st where the reversal occurred. This is a falling
wedge breakout with the trendlines of the wedge in thick red and thick green for resistance
and support respectively. The VWAP band lines have been downsloping. Price is breaking through
the lower band lines and heading toward the mean anchored VWAP line. Price is now above
a EMA 100 Keltner Channel which is now trending up.
I will take long trades here of both shares and call options. The targets are marked with
black horizontal lines from pivots in Jnauary. The are in the levels of 21 and 26 for now.
I would not be surprised if UNG moves up and targets the highs of last October at 30 in the
upcoming months. Many utility companies this summer will be burning gas to generate
electricity needed for air conditioning and demand should be rising.

CAKE rises on VWAP bounce LONGCAKE on a 30-minute chart with a set of VWAP band lines anchored back one month shows
the cycle of a trend up from a good earnings report into the uppermost band lines followed
by a retracement down to the slowly rising mean VWAP where after consolidation and
testing of that support, price has begun a new trend up. This is confirmed by EMA line
convergences as well as RSI strength bullish divergence prior to the price action reversal.
I will take a long trade here targeting 39 and 41 price levels reflecting the upper VWAP band
lines. These are roughly 5 and 10% as realistic targets with a stop loss below the mean VWAP
line at 36.8.

RIVN a trade from deeply undervalued LONGRIVN on a 60 minute chart with set of anchored VWAP lines appears to be finishing a double
bottom at the 8.5 level and making a move higher in a VWAP band breakout potnetially rising
to the mean anchored VWAP and beyond it into the upper bands. I will take a long trage here
with the targets in a textbox on the chart. I am interested in the action of the lesser EV stock
while TSLAs fundamentals are challenged by earnings constraints in the face of downward
pricing and whether discounting will stimulate demand or instead accelerate the path down as
investors may perceive the pricing scheme as a sign of weakness ( or even desperation).

LCID Long Trade Setup VWAP and Falling Wedge BreakoutsLCID on a 30 minute chart showed a falling wedge from mid-December to late January then with
breakout which took it 30% in one and a half days. This was a previous idea. I believe the news
catalyst from Saudi Arabia prompted a burst of trader interest. The following day, the price
began another falling wedge pattern for one week. It then broke out for a 10 % move in a short
time interval.
The chart also demonstrates the bigger moves are centered around VWAP band lines where
trading volume and volatility are the greatest. The relative volume and volatility indicators
help emphasize this point.
At this point, LCID may be turning down into another albeit smaller and lower-duration
falling wedge and is well positioned for a brief short trade. The target would be the
mean anchored VWAP at 3.25. For a better entry selection, a zoom into 3-10 minutes would
be helpful

XBI the ETF for Biotechnology LONGBiotechnology is expected to be a hot subsector this year as healthcare recovered further from
the COVID pandemic anything from startups to big pharma- from vaccines to new drugs for
diabetes, liver disease and obesity. This is shown on a weekly chart to show the long term trend
with XBI pivoting to bullish back in early November. I add long positions when I see a dip
on the 3-4hr chart. My targets are the fib retracement expectation at 116 confluent with
the first upper VWAP band line and then the 135-138 zone underneath the second upper line
shown in thin red on the chart. This ETF smooths out the volatility characteristic of some
of the smaller biotechnology firms making it safer albeit with lesser rewards expectations.
Positions in NVAX and MRNA are having a good start to the week and will reflect in a small
way in this ETF which has broad constituent stocks within its portfolio.

TSLA Long Monday intraday movementThis is my predicted price action for Monday 4/29. I will update the trades I take as the day goes on, obviously if price action moves against me completely I will have to change my strategy. This may include me not taking a trade on NASDAQ:TSLA at all for the day. To make this price prediction I only used VWAP and Volume Profile

ROKU trade for upcoming earnings LONGROKU is here on a 15 minute chart. An anchored VWAP breakout from the lowermost bands
three days prior to earnings suggests to me a long trade through the earnings. The target
is on the chart as the recent high pivots and mean VWAP line. This is a swing trade of about
4-5 days expectant for a 6% gain and perhaps more with a call option trade to supplement
the shares.

SOUN a small cap AI stock ready for a VWAP reversal LONGSOUN on the 15 minute chart as fallen again to the anchored mean VWAP. Each previous
time this has occurred in the past month, price has bounced into the second or third upper
VWAP band line for a bullish momentum move. The mean VWAP is where big players like
to pick up and drop off shares. Liquidity is at the highest. Teh Relative Trend Indicator will
show best entries where the trend is negative but the returns to the chop zone to climb
out of it and go positive. This indicator can function with alerts and notifications. SOUN
uses AI and voice control of it to make apps more user friendly and potent. A similiar stock
is DuoLingo ( DUOL) which also adds language translation into the functionality. Those on a
budget in their trading love the price. Those not on a budget make love the volatility and the
quick profits it can bring if traded properly.

ACB Cannabais Peeny Stock with News LONGCannabis socks got a boost in the past day as the Biden administration seeks a reclassification
of cannabis with the Drug Enforcement Agency ( DEA) This will likely give the entire sector
some momentum. Here on a 60 minute chart, Aurora ACB is seen in a VWAP band breakout,
crossing over the fair vlaue area of the mean VWAP accompanied on the indicators with
confirmatory volume and volatility. On the zero lag MACD, the lines have crossed above the
zero horizontal and above the histogram. I see this as an excellent long entry targeting 4.35
which was the pivot high after the last earnings. This represents a conservative 17-20% upside
with potential upside beyond that price level given the potential impact of the federal news.

ESPR a penny and medtech stock LONGESPR on the 120-minute chart is surging with momentum from an FDA approval for a new
cholestrol and lipid medication which will be an alternative to the at statin class which has
side effects and can cause diabetes. I am familar with a few of the professionals on the
science advisory board they are researchers and academics of the highest claiber. The chart
shows price testing and getting support from the mean VWAP and a little bit of resistance
from the first upper VWAP line. I have added to my existing position at the consolidation at
VWAP. I am well informed on ESPR market prospects; this could be disruptive.
The dual time frame RSI of Chris Moody has curled up and validates the idea. My interim
target is the double top of this past winter. I do expect increasing volume in time with the
price action that follows.
Disclaimer This a hot penny stock highly volatile - you could lose on this trade. Do not trade
with money you cannot afford to lose. You must manage the trade well to realize profit.
There are options if the put to call ratio is rising big money is pushing a reversal

EURUSD set up to rise from dynamic support LONGEURUSD is currently sitting at the price level from which it reversed in mid-December as
well as mid-February. Price is at the second lower anchored VWAP band line which adds
confluence to the support. From here, price should move toward the mean VWAP.
Upside to the target mean VWAP is about 1.25%. The RSI indicator shows weakness and
an undervalued / oversold condition.
The predictive algorithm based on lookback regression line analysis suggests a move up
to the first upper VWAP line at 1.0954.

AUDUSD cleared mean VWAP in bullish momentum LONGAUDUSD as shown on the 30-minute chart has crossed over the mean VWAP anchored back 5
days. From here I expect a move toward the upper first and second VWAP lines and so will
take a long trade targeting 0.6535 initially ( aVWAP+1) and 0.655 for the higher target ( aVWAP
+2) The stop loss will be under the mean VWAP at 0.6515.

NAIL a homebuilding leveraged ETF rising from support LONGNAIL on a 14 minute chart tested the support at the rising trendline confluent with the mean
anchored VWAP and has bounced and crossed over the latter. Relative strength lines are
crossing over the 50 level and the relative volume is showing a gradual rise. This is the
beginning of homebuilding season after all. Mortgage rates might be getting a cut. I will take
a long trade here expecting a swing trade for a few months. Targets are on the chart. They
are based on the resistance rising trendline as well as the upper VWAP bands.
