EUR/USD rally: "Sell America" targets 1.18 – Buying Wave 4 dip?We are witnessing a strong repricing in EUR/USD, driven by a "Sell America" trade that is crushing the dollar across the board. The pair is up 1.6% this week alone, breaking out of a bullish flag and confirming a vertical impulsive move. But the question is: with Wave 4 near the 100% extension as support, is it time to buy the dip?
We analyse the shift driven by President Trump's tariff threats at Davos, which has intensified the selling pressure on the greenback. We overlay this geopolitical risk with a classic Elliott Wave setup on the 4-hour chart, mapping out the path to 1.1800 and potentially 1.1900.
Key topics covered :
"Sell America" intensifies: How Trump's double-down on the February 1st tariff deadline at Davos triggered a second wave of dollar weakness, sending gold to $4,850 and the euro soaring.
Elliott Wave analysis :
Wave 3 peak: The impulsive leg from Monday's open was rejected exactly at the 161.8% Fibonacci extension (1.1767), signalling a temporary top.
Wave 4 entry: We are now looking for a corrective pullback to the 100% Extension and 50% Retracement near 1.1700—a major psychological support and our "buy zone."
Wave 5 targets: If 1.1700 holds, the net distance projection targets 1.1784, 1.1807, and potentially 1.1830.
Risk Factors : Tomorrow's US PCE data (expected steady at 2.8%) is the wild card. A hot print could deepen the correction, while an in-line result supports the higher grind.
Are you buying the Wave 4 dip at 1.17 or fading the rally? Let us know in the comments!
This content is not directed to residents of the EU or UK. Any opinions, news, research, analyses, prices or other information contained on this website is provided as general market commentary and does not constitute investment advice. ThinkMarkets will not accept liability for any loss or damage including, without limitation, to any loss of profit which may arise directly or indirectly from use of or reliance on such information.
Wave4

BABA – Weekly / Daily Structure | Wave (4) Update
Thesis
NYSE:BABA remains in a broader bullish reversal, with the current pullback continuing to resolve as an intermediate corrective phase.
Context
- Weekly and daily timeframes
- Multi-year base already completed
- Prior impulsive advance followed by a controlled retracement
What I see
- Pullback continues to respect the prior breakout structure
- Price is consolidating inside a descending corrective channel
- Rising longer-term moving-average support remains intact
- Structure remains consistent with an intermediate Wave (4) correction
What matters now
- The 50-day moving average is aligned with the 0.382 Fibonacci retracement near the $159 area
- A break and hold above this confluence would signal completion of Wave (4)
- Failure to reclaim this level likely extends consolidation
Buy / Accumulation zone
- Current consolidation range within the Wave (4) retracement zone
- Risk remains defined against the recent higher low
Targets
- A confirmed flip of the $159 confluence opens the path toward the $230 area
- That level aligns with the next intermediate upside reference
Risk / Invalidation
- Loss of rising support would weaken the bullish reversal structure

BankNifty to reverse direction?With the triangle unfolding in wave 4, we may see a correction on the downside after a small 5th wave.

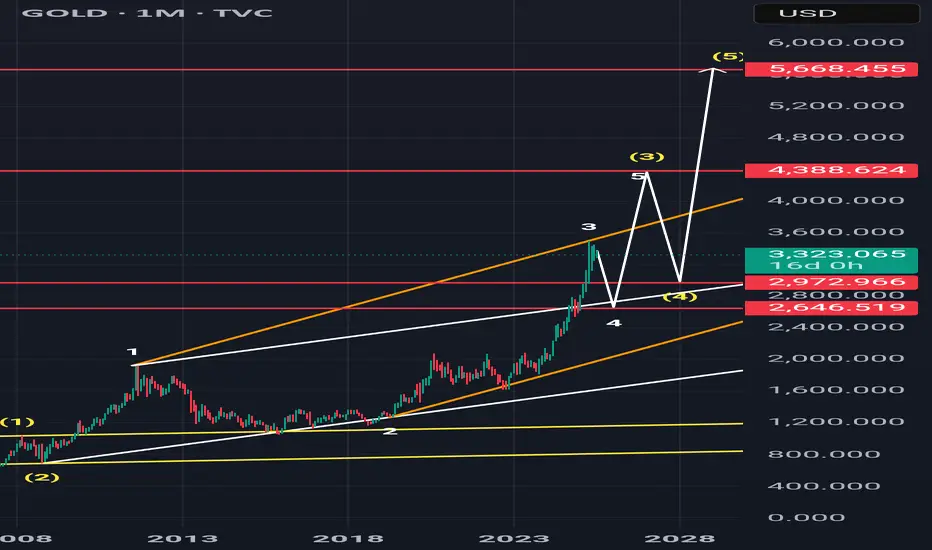
Xauusd gold Elliott Wave update yearlyThis count is based on my assumptions so anything can happen not a trading or financial advice just for educational purposes only kindly do your own ta thanks trade with care good luck.

Gold w3 top? Elliott Wave Analysis yearlyThis count is based on my assumptions so anything can happen not a trading or financial advice just for educational purposes only kindly do your own ta thanks trade with care good luck.

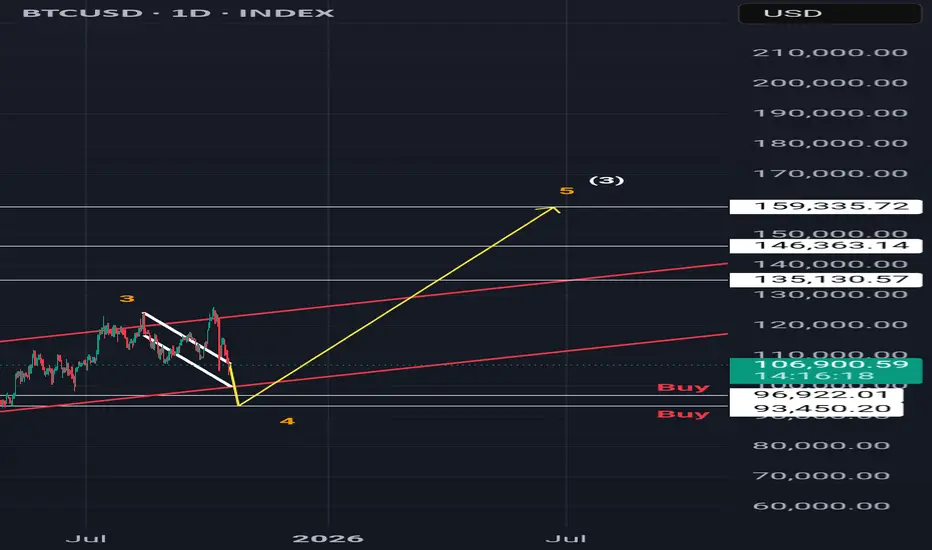
Bitcoin elliott wave count wave 4 of 3 in play?This count is based on my assumptions so anything can happen not a trading or financial advice just for educational purposes only kindly do your own ta thanks trade with care good luck.
Gold Elliott Wave Outlook: Possible Wave 4 CorrectionGold Elliott Wave Analysis: Potential Wave 4 Correction Toward $3,650
The price of gold (XAU/USD) has recently shown signs of completing its third Elliott wave around the $3,720 region. According to Elliott Wave analysis for gold, this level may have marked the peak of Wave 3, and the market could now be setting up for a Wave 4 correction. The minimum retracement target for this corrective move appears to be in the $3,650 support zone. However, the ascending trendline remains intact, which means entering a short position prematurely—before a decisive break of the trendline—still carries significant risk.
Elliott Wave Perspective
In Elliott Wave theory, Wave 4 typically represents a corrective phase following the strong impulsive move of Wave 3. These corrections often retrace into previously consolidated zones, creating a buying opportunity before Wave 5 emerges. In this case, the highlighted box around $3,650 represents the most probable demand zone where buyers could step back in.
The critical factors to watch on the chart are:
Whether gold can hold above the rising green trendline. A confirmed breakdown would significantly increase bearish momentum.
If gold fails to reclaim and sustain the $3,720 level, sellers may gain confidence and push prices lower.
The $3,650 area is both a psychological and technical support, making it an ideal candidate for the bottom of Wave 4.
Keywords for SEO: gold Elliott Wave analysis, wave 4 correction, gold price forecast, gold support zone, XAUUSD technical outlook, gold bearish scenario, gold trading strategy
Fundamental Catalysts Supporting a Bearish Outlook
While technical analysis suggests a potential drop, fundamentals also align with the possibility of a correction in gold prices. Several macroeconomic and market factors could act as catalysts for a decline from $3,720 toward $3,650.
Stronger U.S. Economic Data
Recent data releases from the United States have shown resilience in the economy. Stronger-than-expected GDP growth or consumer spending could push the Federal Reserve to maintain higher interest rates for longer. This hawkish outlook would support the U.S. dollar, making gold less attractive as a non-yielding asset.
Rising Real Yields
Gold has no yield, so its attractiveness declines when real interest rates rise. If U.S. Treasury yields continue to move higher while inflation expectations remain anchored, real yields will climb. This environment historically creates downward pressure on gold.
Strength in the U.S. Dollar
The U.S. dollar index (DXY) has been consolidating near higher levels. A renewed surge in the dollar would make gold more expensive for foreign buyers, limiting demand and contributing to downside pressure.
Weak Physical Demand from Asia
Physical demand from key gold-buying nations like China and India remains a major factor. Recent reports indicate that China’s gold imports via Hong Kong fell by nearly 39% compared to the previous month, signaling weakening appetite. This reduction in demand could remove an important support pillar for gold prices.
ETF Outflows and Reduced Speculative Interest
Gold ETFs and futures often amplify momentum. If speculative capital continues to exit the market, price declines could accelerate.
Diminished Geopolitical Tensions
Gold acts as a safe-haven asset during crises. However, if global geopolitical risks or inflation fears ease, investor demand for gold could wane, further validating a correction.
Trading Strategy and Risk Management
The current technical setup suggests caution. While the Elliott Wave pattern points toward a corrective move, timing the entry is crucial:
A break below the green uptrend line would confirm bearish momentum and increase the probability of a decline toward $3,650.
Aggressive traders may attempt to short below $3,720 resistance, but conservative traders may prefer waiting for a clean break and retest of the trendline.
Risk management remains essential, as failure of the bearish scenario could lead to a renewed rally above $3,800.
Conclusion: Gold Outlook for Traders
Combining Elliott Wave theory with fundamental drivers, gold appears vulnerable to a Wave 4 correction. A break of the rising trendline could accelerate selling pressure, with a minimum downside target of $3,650. Strong U.S. economic data, rising real yields, weaker physical demand from China, and strength in the U.S. dollar all support this bearish outlook.
Still, traders should remain flexible. Gold remains a safe-haven asset, and renewed geopolitical tensions or dovish central bank commentary could quickly reverse the bearish narrative. For now, monitoring the $3,720 resistance and the green uptrend line will be essential to confirm whether the next move is indeed a correction or just a consolidation before another rally.

#btc #btcusd #elliottwave short sell setup wave 4 16Jul24This count is based on my assumptions so anything can happen not a trading or financial advice just for educational purposes only kindly do your own ta thanks trade with care good luck.

#xauusd #elliottwave short sell setup wave 4 16Jul24This count is based on my assumptions so anything can happen not a trading or financial advice just for educational purposes only kindly do your own ta thanks trade with care good luck.
#btc #btcusd #elliottwave short sell setup wave 4 7Jul25This count is based on my assumptions so anything can happen not a trading or financial advice just for educational purposes only kindly do your own ta thanks trade with care good luck.


#xauusd #elliottwave short sell setup wave 4 5Feb25This count is based on my assumptions so anything can happen not a trading or financial advice just for educational purposes only kindly do your own ta thanks trade with care good luck.

#btcusd #BTC #elliottwave short sell setup wave 4 24Jan25This count is based on my assumptions so anything can happen not a trading or financial advice just for educational purposes only kindly do your own ta thanks trade with care good luck.

Oberoi reality consolidation #oberoireality is consolidated in daily Timeframe, it looks like triangle pattern, but one needs to be aware has lot of time fake breakout is been seen, good for buying in cash, risk management and patience is important overall bullish for short-term swing.

#xauusd #elliottwave short sell setup wave 4 10Jan25This count is based on my assumptions so anything can happen not a trading or financial advice just for educational purposes only kindly do your own ta thanks trade with care good luck.

#btc #btcusd #elliottwave short sell setup wave 4 28Dec24This count is based on my assumptions so anything can happen not a trading or financial advice just for educational purposes only kindly do your own ta thanks trade with care good luck.

#btc #elliottwave short sell setup wave 4 a 15Dec24This count is based on my assumptions so anything can happen not a trading or financial advice just for educational purposes only kindly do your own ta thanks trade with care good luck.

#xauusd #elliottwave short sell setup wave c 4 11Dec24This count is based on my assumptions so anything can happen not a trading or financial advice just for educational purposes only kindly do your own ta thanks trade with care good luck.

#xauusd #elliottwave short sell setup wave 4 c 4Dec24This count is based on my assumptions so anything can happen not a trading or financial advice just for educational purposes only kindly do your own ta thanks trade with care good luck.

#btcusd #BTC #elliottwave short wave 4 c 94% Discount 1Dec24This count is based on my assumptions so anything can happen not a trading or financial advice just for educational purposes only kindly do your own ta thanks trade with care good luck.

#btc #btcusd #elliottwave short sell setup wave 4 c 1Dec24This count is based on my assumptions so anything can happen not a trading or financial advice just for educational purposes only kindly do your own ta thanks trade with care good luck.

#btc #btcusd #elliottwave short sell setup wave 4 30Nov24This count is based on my assumptions so anything can happen not a trading or financial advice just for educational purposes only kindly do your own ta thanks trade with care good luck.

#xauusd #elliottwave short sell setup wave 4 30Nov24This count is based on my assumptions so anything can happen not a trading or financial advice just for educational purposes only kindly do your own ta thanks trade with care good luck.
