Bullish Reversal Signals at Harmonic SupportCRD is showing multiple bullish signals suggesting a significant low may be forming.
Scenario 1 — Weekly low volume Spring Confirmation
If the weekly candle closes in its current position, it strengthens the case for a spring out of the Wyckoff range.
In this scenario, an entry on next week’s open is justified. with a clear invalidation under the spring.
The trade-off is that the major resistance cluster sits relatively close overhead, so the risk‑to‑reward isn’t ideal for short‑term traders.
However, for a longer‑term position, the structure supports the idea that this could be the beginning of a larger reversal. As Always, there are no guarantees and must adapt to the chart as it unfolds.
Scenario 2 — Throw-under Into S1 Pivot
Price may continue to pull back into the new yearly S1 pivot, creating a throw-under of the wedge structure.
A close back inside the range after this throw-under would significantly improve the risk‑to‑reward, as it would confirm a deeper spring and clear out remaining weak hands.
This scenario offers a cleaner entry and a more defined invalidation level.
*arrows are not time-based analysis just overall pathing
Wedgeformation

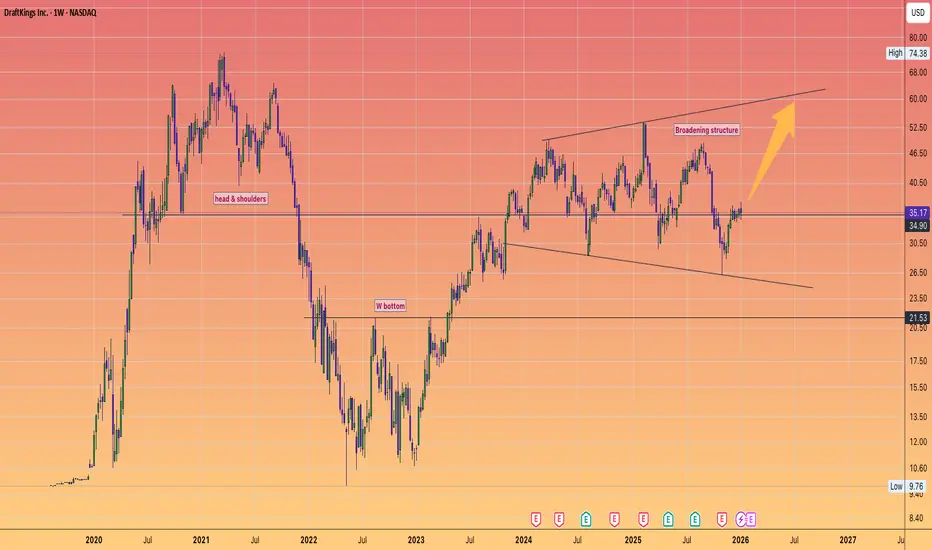
DraftKings Super Bowl ReboundThe Super Bowl is typically the largest customer acquisition event of the year for sportsbooks, and DraftKings is currently positioning itself to capture massive volume for Super Bowl LX
Customer Acquisition Spike: DraftKings is currently running aggressive "Bet $5, Get $300" promos to lock in new users ahead of the playoffs. This surge in downloads and active users often translates into bullish sentiment in the weeks leading up to the big game.
Handle Growth: Management recently reported that sportsbook wagering was up 17% year-over-year as of late 2025, providing a strong baseline of momentum heading into the peak betting season of Q1 2026.
Revenue Projection: For the current quarter, analysts are projecting massive revenue of $1.94 billion, a 38.95% increase from the previous year, driven largely by the heavy NFL postseason and Super Bowl slate.
2. The New 2026 Catalyst: "DraftKings Predictions"
A unique factor for this year's "Super Bowl madness" is the launch of DraftKings Predictions.
This new platform allows DraftKings to enter states that do not yet have legal online sports betting, significantly expanding their addressable market for the Super Bowl.
Analysts expect this "event contract" model to have higher margins and lower promotional costs than traditional betting, which could be the "X-factor" that drives a breakout.
3. Technical Analysis ($35.17 as of Jan 9)
Your TradingView chart likely shows NASDAQ:DKNG testing a key structural pivot:
Resistance: The stock is currently fighting the $36.00 level. A high-volume break above this would be a "Strong Buy" signal, potentially targeting the $50.00 range seen in early 2025.
Broadening Structure: As of January 9, 2026, the stock is trading in a horizontal trend channel. The "Super Bowl run" usually provides the volume needed to break out of such a range.
SPX at verge of breaking down?SP:SPX is treading dangerously in a bearish wedge formation with multiple bearish divergences in RSI.
A breakdown from here could send it around 6200 zone. And that might just be beginning of the fall everyone is waiting for, on account of excessive debt and inflation situation.

XAUUSD Technical OutlookWhat I see!
XAUUSD Technical Daily Outlook
Gold (XAUUSD) is forming a falling wedge after the sharp drop from the 3,430s high - - a structure that often signals a potential bullish reversal.
Price is consolidating inside the wedge, rejecting from the Daily FVG while holding the H4 demand zone at 3,320. A break above the wedge trend-line could spark an impulsive move toward the 3,375 BSL, with further upside into 3,439 if liquidity is cleared.
The wedge has already completed five legs, adding confluence for a possible breakout soon. Conversely, failure to hold 3,320 may invite deeper retracement before bulls re-enter.
This chart is presented for educational discussion of market structure and technical patterns only. It is not a trade signal or financial advice.
Learn before earning!

XAUUSD edges lower on geopolitical reliefXAUUSD edges lower on geopolitical relief
Gold dipped in early Asian trading on Monday, as easing geopolitical tensions reduced its safe-haven appeal. Despite no progress in Friday’s Trump-Putin meeting, Trump told European leaders he’s open to U.S. security guarantees for Ukraine, with Putin reportedly agreeing to Western troop presence in any peace deal.
On the contrary, Thursday's PPI came out weaker than expected, signaling the possibility of a higher inflation in the nearest future. This may influence on Jerome Powell's decision on the U.S. key rate. Some experts already expect Powell to be hawkish on September 17. This week Powell will be participating on annual Jackson Hole event.
XAUUSD has been moving within a wedge for the last week. MACD is turning into a green zone on 4-h chart. Price successfully rebounds from the local support of 3,300.00. Future sideways movement is expected, the price may rebound from local support of 3,300.00 towards 3,380.00 as a first target.

Wedge Pattern: A Key to Trend Reversals and Continuations📈 Wedge Pattern: A Key to Trend Reversals and Continuations
A wedge pattern is a technical chart formation that signals a potential reversal or continuation in the market. It’s formed when price moves between two converging trendlines — either sloping upward or downward — creating a narrowing range over time.
There are two main types of wedge patterns:
🔻 Falling Wedge (Bullish)
Formed during a downtrend or as a correction in an uptrend.
Characterized by lower highs and lower lows, with the slope of the support line steeper than the resistance line.
Typically signals a bullish reversal as momentum builds for a breakout to the upside.
✅ Confirmation: Break above the resistance line with volume surge.
🔺 Rising Wedge (Bearish)
Appears during an uptrend or as a correction in a downtrend.
Shows higher highs and higher lows, but the support line is steeper than the resistance line.
Often leads to a bearish reversal, especially when volume declines into the pattern.
⚠️ Confirmation: Break below the support line with increasing volume.
🧠 Key Characteristics
Volume tends to decrease as the pattern forms, indicating a pause in momentum.
The breakout direction (up or down) determines whether it’s a continuation or reversal signal.
Wedges can appear on any time frame and are useful for both day traders and long-term investors.
📊 Trading Tip
Always wait for confirmation of the breakout before entering a trade. False breakouts can be common, especially in low-volume environments

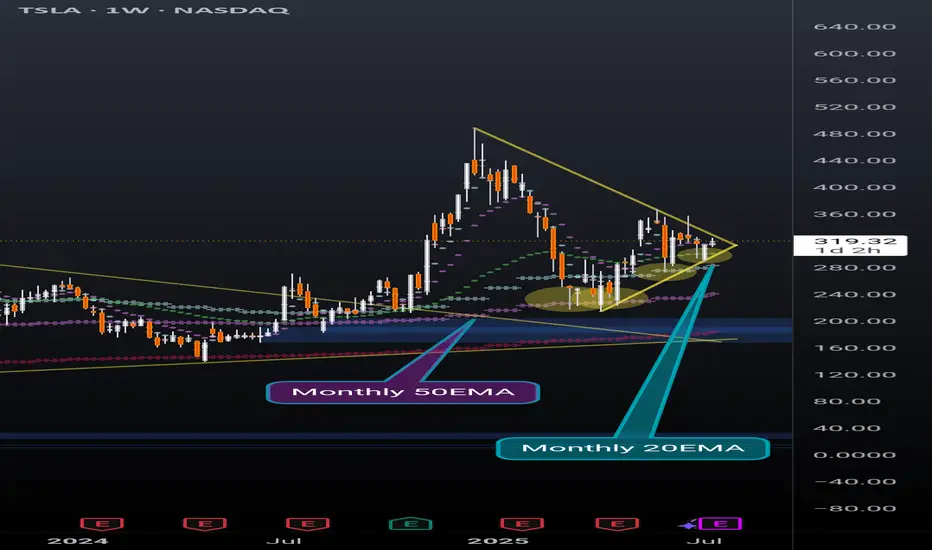
TSLA weekly coiling into something powerfulNever doubt the power of TSLA. Recently broke out of a huge pennant, and now nearing the end of another pennant while simultaneously holding support above the daily 20EMA(overlayed on this weekly chart).
Also recently found support off of the monthly 20EMA (overlayed on this weekly chart) and took 2 direct hits on the monthly 50EMA (overlayed on this weekly chart) before that and rallied up. It will take a lot to crush this setup but anything can happen. Possibly a longer pennant formation.
I'm just a cat not a financial advisor.
SWIGGY MAY DELIVER ON TIME Swiggy's stock has been facing challenges recently, with its share price hitting an all-time low after the IPO lock-in period ended. The company has been struggling with profitability, and its losses widened to ₹1,081 crore in Q4FY25, compared to ₹555 crore in the same period last year. Despite this, analysts remain cautiously optimistic, with 13 out of 20 maintaining a "buy" rating on the stock.
Swiggy's food delivery business has shown strong growth, but its quick commerce segment, Instamart, has been underperforming compared to competitors like Blinkit. The company has been aggressively expanding its store count, but rising expenses have impacted its bottom line. Some analysts believe Swiggy is following a similar path to Paytm, struggling to convert losses into sustainable profits.
- Revenue Growth: Swiggy's revenue has been increasing steadily, with a 45% year-on-year growth.
- Profitability Concerns: The company reported a net loss of ₹1,081 crore in Q4FY25, nearly double the previous year.
- Market Sentiment: Analysts remain cautiously optimistic, with some maintaining a buy rating despite recent stock declines.
- Stock Price Target: The average long-term price target for Swiggy is ₹600, representing an 87.32% upside from its current price.
- Competitive Position: Swiggy continues to dominate the food delivery market, but its quick commerce segment (Instamart) faces stiff competition.
- Market Sentiment: Despite recent losses, Swiggy remains a midcap stock with strong investor interest.
Overall, Swiggy's stock is facing selling pressure, and traders may want to watch for breakout signals before making a move
BUT PERSONALLY I WILL ADD SOME QTY AT CURRENT LEVELS.

Is SOXL ever going to breakout...Have held long on SOXL for about 5.5 weeks now with an average price of $30. I identified a wedge alongside "hidden" divergence on the MACD on a weekly time scale but it's still been pretty much in the same zone/area of consolidation.
When the DeepSeek news broke out, I was for sure ready to cut ties with this one since the Nasdaq was in a complete bloodbath but I gave it some room and glad to see it has been recovering OK for now.
My original target for one is/was $40 but I'd consider taking it off the table if we saw $35+ again. We'll see how this week performs and watch for that gap being filled.
Good Luck & Trade Safe.

VESUVIUS: Symmetrical wedge in Formation
Consolidation Phase:
NSE:VESUVIUS has been consolidating for a while, indicating reduced volatility and balanced forces between buyers and sellers. This phase often precedes significant price moves.
Symmetrical Wedge Formation:
The current price action is forming a symmetrical wedge pattern, characterized by converging trendlines as the price makes higher lows and lower highs. This pattern suggests indecision in the market, with neither bulls nor bears having full control.
Breakout Strategy:
Traders should wait for a decisive breakout from the wedge before entering a trade.
Bullish Breakout : Look for a break above the upper trendline with high volume, signaling potential upward momentum.
Bearish Breakout : Watch for a break below the lower trendline with significant volume, suggesting a potential downside move.
Key Levels to Monitor:
Identify key support and resistance levels near the wedge boundaries. A confirmed breakout often targets the height of the wedge projected from the breakout point.
Disclaimer : This analysis is for educational and informational purposes only and does not constitute financial advice or a call to trade. Trading and investing involve significant risk, and you should perform your own research or consult with a qualified financial advisor before making any trading decisions. Past performance is not indicative of future results.

AUDCAD - Technical Analysis [Short Setup]🔹 AUDCAD Analysis on 1H chart
- The current Trend is BULLISH
- There is BEARISH divergences
- Reversal pattern is present which is rising wedge
🔹 Trade Plan
- Entry Level = 0.93494
- Stop Loss = 0.93746
- TP1 = 0.93264
- TP2 = 0.93008
🔹 Risk Management
- First TP is 1:1
- Second TP is 1:2
🔹 How to Take Trade?
- Only risk 2% of your portfolio
- Take 1% risk entry with 1:1 RR
- Take 1% risk entry with 1:2 RR
Like and subscribe to never miss a new idea! ✌🏼

The XRP monthly chart is looking absolutely incredible!The XRP monthly chart price action is wicking outside of the long-term trend line for the first time since establishing the second point of contact. This could be a sign of very good things to come!
Good luck, and always use a stop-loss!

BTC at some support levelsLets look at BTC. Some people have been saying that its getting ready to take off again, so I wanted to do my own analysis.
I've got three indicators I'm using here.
- Wedges/channels (the thin green lines)
- Fibs - the gold colored fib levels
- Wick Strength - the oscilalator at the bottom
First, Wedges.
We can see that price is at the bottom of a wedge/channel. Its been pretty consistent on the plotted wedges that breakouts have been significant. However with the support of the Wick Strength as well as support of the 0.382 fib level, it looks like we might return to the top of the channel rather than crashing through the bottom.
Next, Fibs.
Fibonacci are one of my favorite technicals and popular for a reason. Look at all the times price has bounced right off a near-exact fib level! Recently BTC hit the 0.5 with a STRONG support. And here we are again at the 0.382. Looking left on this line we can see multiple wax and wick bottoms rejecting at this price point in recent months.
Lastly, Wick Strength.
I'm still learning this one as its new, but here's what I've seen. In up markets, Wick Strength is low, because there is constant downward pressure from all the bears. So the top wicks are long, and the bottom wick are short. (Indicating that bulls are stronger since wax is bullish, but bears still have a voice and top wicks are longer than bottom). In down markets, its the opposite, and the Wick Score goes up due to longer bottom wicks by the bulls. Here, Wick Strength is relatively high actually, and we're in a flag price action pattern. Looking like Wick Strength will come down as the market takes off bullish again.
Just at thought! We'll see what happens.
What do you think?

PENDLE Long Position (Descending Wedge Formation)Market Context: PENDLE is forming a descending wedge, presenting a strong opportunity to dollar-cost average (DCA) into a spot long position. The setup focuses on key resistance and support levels.
Trade Setup:
Entry: Long trade around $2.50 to $3.00.
Take Profit:
First target: $3.80
Second target: $4.60
Third target: $5.50
Stop Loss: Close below $2.40.
📊 This trade leverages the potential breakout of the descending wedge, with DCA allowing for better risk management and positioning. #PENDLE #CryptoTrading #WedgeFormation

MURATA _ Next Target +30% _ Rising Wedge Pattern Top at JPY 4600Rising Wedge Pattern forming and Break All Time High in Murata Manufacturing. So Next Target is Wedge Pattern Top (or) Resistance line of Wedge Pattern. And Offering a Chance to Make PROFIT of +30 % or more.
Support me; I want to Help People Make PROFIT all over the "World."

HBLPOWER: SYMMETRICAL WEDGENSE:HBLPOWER stock is currently forming a symmetrical wedge pattern following a significant rally, indicating potential consolidation before the next major price move. This pattern suggests a period of indecision in the market, with equal pressure from both buyers and sellers. A breakout above the upper trendline would signal a continuation of the previous uptrend, targeting 770. Conversely, a breakdown below the lower trendline would indicate a reversal, suggesting a possible decline towards the stop loss at 505. Traders should watch for a decisive breakout or breakdown to confirm the next direction.

INDOTECH - Symmetrical wedge patternNSE:INDOTECH stock has formed a symmetrical wedge pattern following a strong rally, indicating a potential continuation or reversal. Symmetrical wedges often signal consolidation before a significant price move. If the price breaks above the upper trendline, it suggests a continuation of the upward trend with a price target of 2450. Conversely, a break below the lower trendline could indicate a reversal, warranting a stop loss at 1600 to mitigate potential losses.
Trading Strategy:
Bullish Breakout:
Entry Point:
Consider entering a long position on a confirmed breakout above the upper resistance trend line, ideally accompanied by increased volume.
Target Price:
Measure the height of the wedge at its widest point and project it upwards from the breakout point.
Stop Loss:
Place a stop loss below the lower support trend line to manage risk.
Bearish Breakdown:
Entry Point:
Consider entering a short position on a confirmed breakdown below the lower support trend line, with accompanying high volume.
Target Price:
Project the height of the wedge downwards from the breakdown point for the target price.
Stop Loss:
Place a stop loss above the upper resistance trend line.

$TOTAL will triple until end of 2024It sounds impossible, but take a look!
As CRYPTOCAP:TOTAL crypto marketcap is inside a multiyear wedge, it will likely continue this trend for next months as we are testing the support
If you take a look at the RSI on the panel bellow, another trend is forming and will likely hit the resistence before end of year (big purple arrow), with more then 230% gain
After that, we may see a strong correction, mirroring last cicles as is showed on the RSI panel with the 3 dashed red arcs

USDCAD wedge patternThis pair is forming a bullish wedge pattern. The price is likely to break out to the upside in the near future, presenting a potential buying opportunity for traders looking to go long on this pair. However, currently the price is at a support zone, so we consider buying. Our target is 1.37266 price area.We anticipate a potential rebound from this support level, as historical price action suggests strong buying interest in this area. Traders looking to capitalize on this setup may consider entering a long position with a stop-loss below the support level for risk management. The target price of 1.37266 presents a favorable risk-reward ratio, offering a clear objective for profit-taking. Monitoring price action closely and adjusting the trade as necessary based on market dynamics will be crucial for maximizing gains in this trade setup.

XLV is shaping falling wedgeBullish context: weekly uptrend
Price position: near last weekly trend low
Pattern: four consecutive red days with little upthrust (progression of lows)
It looks like previous weekly consolidation area is providing support, and bears are too exhausted to break through it now.
This provides an opportunity for a long play. An example of possible trade is shown on the chart. It is important that today closes above 138.6, otherwise, setup is invalidated
Disclaimer
I don't give trading or investing advice, just sharing my thoughts.

AFRM Wedging on the DailyAFRM is tightening into a wedge on the daily chart. Trying to break out and now sitting up above all three major EMAs. 12% short interest could add fuel to the fire if this decides to squeeze.

Latentview : Symmetrical WedgeAfter hitting all three of our previous targets the NSE:LATENTVIEW is currently exhibiting characteristics of a symmetrical wedge pattern, indicating a potential period of consolidation and indecision in the market. A symmetrical wedge pattern is identified by two converging trendlines, both sloping inwards. This formation signifies a period of decreasing volatility and tightening trading ranges as the highs and lows of the price action gradually converge. The symmetrical wedge pattern is considered a continuation pattern, implying that the prior trend, in this case, the prolonged upside run, could resume after the pattern's completion.
Breakout Strategy:
To effectively capitalize on this pattern, traders should exercise patience and wait for a confirmed breakout from the symmetrical wedge formation. A breakout occurs when the price decisively moves above or below one of the trendlines, accompanied by significant volume, signaling a shift in market sentiment.
Confirmation and Risk Management:
It's crucial to wait for confirmation of the breakout and avoid preemptive entries. Additionally, traders should implement proper risk management techniques, such as setting stop-loss orders to mitigate potential losses in case of a false breakout or adverse price movement.
Conclusion:
In summary, the formation of a symmetrical wedge pattern after a long upside run on the NSE:LATENTVIEW chart suggests a period of consolidation and indecision in the market.
