the ZW1! Preparing to flyIt seems that there's a big probability over 90% that the ZW1! is preparing to fly today. and this probability is verified by the most important and Fundamental line in this chart.
Wheatfutures


Cycle is down for Wheat until August 31st.Wheat has just finished a corrective move and because of its nature (Wheat is a very volatile instrument) it may seem to an untrained eye that the trend is up. However, that is not the case in my opinion - cycle is down. To approach this trade now we go long September PUT options, strike 475. The approximate price target is 435 at the point when the cycle bottoms. Later on I will upload ideas giving out recommendations to trade the futures contract, for now we want to limit our risk. Fundamentally, Russian farmers this year are expecting a record crop since the late 1980s, according to the head of Russian agricultural department (Russia is the largest producer and exporter of the grain). Despite this fact, I would avoid reading the news regarding wheat as a trading strategy. There is a lot of misleading information and I just read it for entertainment, not for trading. Please do remember that futures trading involves a substantial risk of loss and is not suitable for all investors.
Don't listen to the noise and I know that you will make a success.
Have a good weekend, fellow traders!


Rally in wheat is not done yetWheat futures rallied last week as it was expected. Congrats on your profits! Wheat is one of my favorite instruments. It follows setups very well. Many traders focus on more volatile instruments. But that is wrong. As traders, we have to be focused on a less speculative instrument that gives a better risk/reward ratio. I believe the price will retest recent highs near 570. But this market needs some breath. It is overbought on smaller time frames. However, Wheat is a very tight market. Usually doesn’t give big pullbacks. I continue to look for and take buy signals in this market.


Potential rally in wheatBased on COT reports commercials are long wheat. They are correct 98%. It may take time to form a buy signal. But with that in mind, we look for buy signals - whatever happens first
- break out of daily resistance
- lower high + oversold oscillator
- divergence (I use RSI and OBV)


ANALYSE DU BLÉ ! VENTE MOYEN-COURT TERME la semaine dernière sur l'amélioration des perspectives du commerce américain avec la Chine, bien que bénigne aux États-Unis. les prévisions météorologiques ont poussés les vendeurs sur le marché du blé à vendre une partie de leurs stocks. .
le département américain publiera mardi le 30 ses derniers rapports sur les stocks des céréales américains trimestriels . Les analystes s'attendent a une augmentation de l'offre ce qui pourrait emmener à la baisse le cours du prix du blé et des autres céréales à la baisse à court terme.
Analyse technique :
Mois(graphique en bas): la tendance de fond représentée par l'oblique représentant l’histoire du cours du blé depuis 1971 est haussière . les prix pour le moment son bloqués par un niveau pivot à 499.6 $ le boisseau.
Au niveau ichimoku. les prix sont dans le nuage donc montrant un signal neutre pour le moment; mais les autres éléments de ichimoku montrent aisément qu'on entre dans une phase de stabilisation donc début d'un potentiel range.
Avec comme indicateur la matérialisation d'un squeeze et le niveau plat de kijun et de la tenkan.
Semaine(en haut à gauche): la tendance de court terme est bel et bien baissière . les prix sont en dessous su nuage , la tenkan en dessous de la kijun et la chicou qui ne semble pas avoir d'obstacle a part des niveau support de court et moyen terme . le squeeze qui montre son nez semble nous indiquer que la tendance n'a pas fini de donner son dernier mot. j'ai donc ciblé comme objectif 436.4 $ et comme deuxième objectif 439.4$ qui représente un niveau clé historique .
Jour(en haut à droite): Après avoir clôturer en baisse avec prêt de 2.5% le vendredi, les acheteurs semblent avoir repris la main pour un certains temps . nous attendrons donc le signal vendeur avec les bougies HA pour renforcer noter position vendeuse sur cette matière première.

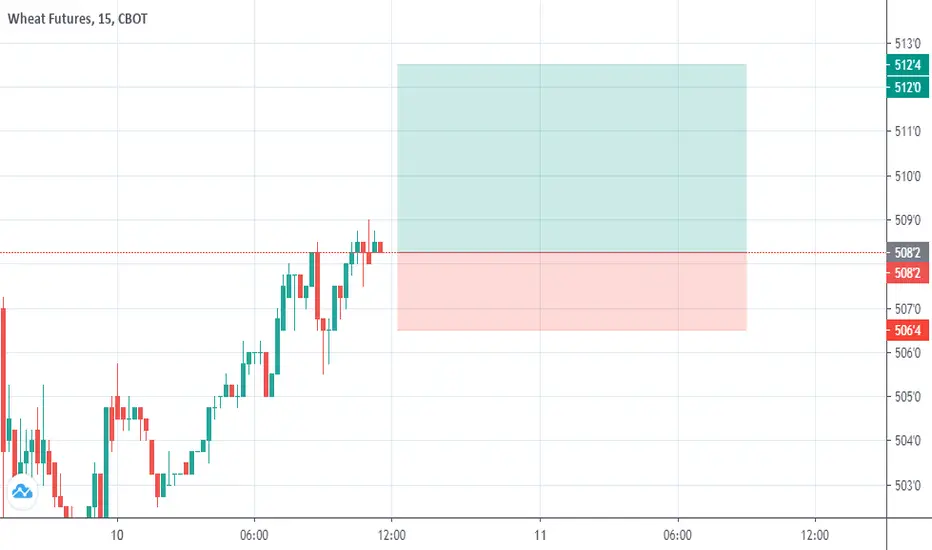
Wheat Futures have broken out the top of an ascending triangleI expect a retest of the breakout level then bounce, or I just proceed up to the target


Is the Crisis over and demand for wheat is low?If the price crosses the supports level at 5.294 and 5.253, the next target is at 4.917.


WHEAT FUTURES (KE1!) MonthlyThe Djinn Predictive Indicators are simple mathematical equations. Once an equation is given to Siri the algorithm provides the future price swing date. Djinn Indicators work on all charts, for any asset category and in all time frames. Occasionally a Djinn Predictive Indicator will miss its prediction date by one candlestick .
Dates in the future with the greatest probability for a price high or price low.

WHEAT FUTURES (KE1!) WeeklyThe Djinn Predictive Indicators are simple mathematical equations. Once an equation is given to Siri the algorithm provides the future price swing date. Djinn Indicators work on all charts, for any asset category and in all time frames. Occasionally a Djinn Predictive Indicator will miss its prediction date by one candlestick .
Dates in the future with the greatest probability for a price high or price low.

WHEAT FUTURES (KE1!) DailyThe Djinn Predictive Indicators are simple mathematical equations. Once an equation is given to Siri the algorithm provides the future price swing date. Djinn Indicators work on all charts, for any asset category and in all time frames. Occasionally a Djinn Predictive Indicator will miss its prediction date by one candlestick .
Dates in the future with the greatest probability for a price high or price low.


Wheat / Trendline RetestIt"s not just grocery shoppers who are hoarding pantry staples.
Some governments are moving to secure domestic food supplies during the
corona virus pandemic . (Bloomberg)
Disclaimer:
We are not registered or licensed in any jurisdiction whatsoever to provide investing advice or anything of an advisory or consultancy nature,
and are therefore are unqualified to give investment recommendations.
Always do your own research and consult with a licensed investment professional before investing.
This communication is never to be used as the basis of making investment decisions, and it is for entertainment purposes only.


Kansas Cory Wheat Short Opportunity Off Of HighsLooking at a short opportunity with KC Wheat being at highs of 500’s I also look for other conditions.
1- divergence on almost all Macro time frames including the daily , and indecision here on monthly and weekly timeframes.
2-seasonal historic patterns showing a time where commercials can flip position to net buyers meaning they are hedging against the speculators that can drive prices back down
3-momentum looks weak up there
Let’s see what happens all I am short one calendar spread from here. Good luck !
