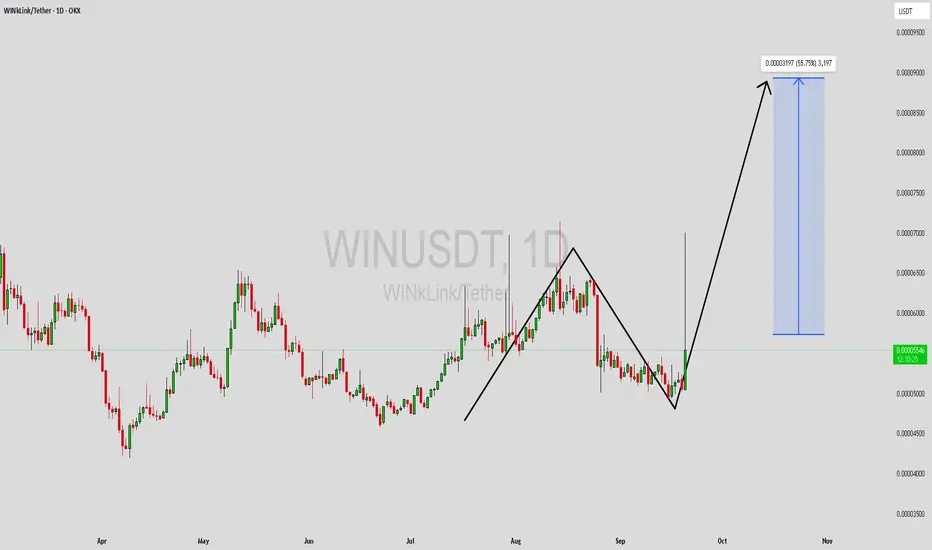
WINUSDT Forming Falling WedgeWINUSDT is forming a clear falling wedge pattern, a classic bullish reversal signal that often indicates an upcoming breakout. The price has been consolidating within a narrowing range, suggesting that selling pressure is weakening while buyers are beginning to regain control. With consistent volume confirming accumulation at lower levels, the setup hints at a potential bullish breakout soon. The projected move could lead to an impressive gain of around 90% to 100% once the price breaks above the wedge resistance.
This falling wedge pattern is typically seen at the end of downtrends or corrective phases, and it represents a potential shift in market sentiment from bearish to bullish. Traders closely watching WINUSDT are noting the strengthening momentum as it nears a breakout zone. The good trading volume adds confidence to this pattern, showing that market participants are positioning early in anticipation of a reversal.
Investors’ growing interest in WINUSDT reflects rising confidence in the project’s long-term fundamentals and current technical strength. If the breakout confirms with sustained volume, this could mark the start of a fresh bullish leg. Traders might find this a valuable setup for medium-term gains, especially as the wedge pattern completes and buying momentum accelerates.
✅ Show your support by hitting the like button and
✅ Leaving a comment below! (What is your opinion about this Coin?)
Your feedback and engagement keep me inspired to share more insightful market analysis with you!
WINBTC

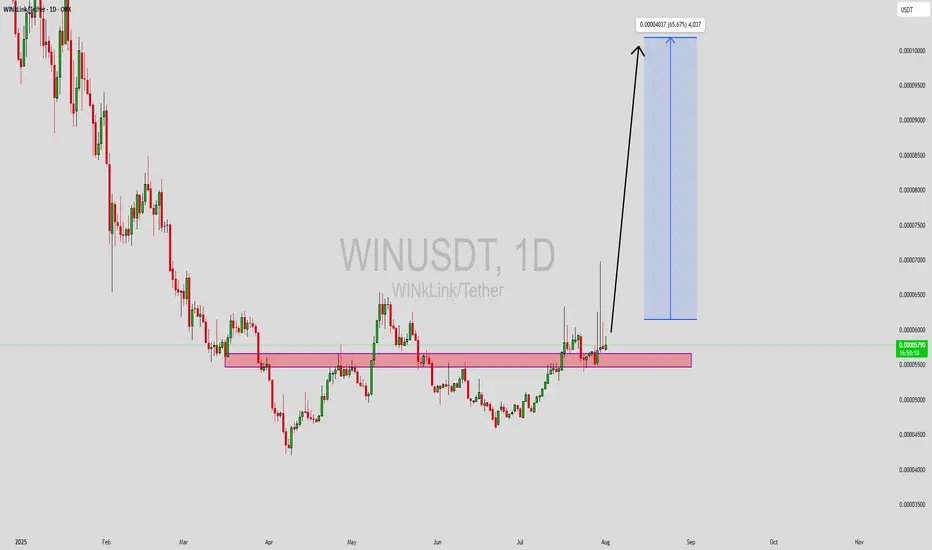
WINUSDT Forming Potential ReversalWINUSDT is currently showing an interesting setup as the price action suggests a potential reversal structure forming on the daily chart. After a long period of consolidation, the pair has started to gain upward momentum, with fresh bullish candles breaking through recent resistance zones. This signals that accumulation might be underway, with traders positioning themselves for the next leg up.
Trading volume has been stable and supportive of this upward move, which is a key confirmation of genuine buying interest. Based on the current technical outlook, WINUSDT could deliver gains in the range of 40% to 50%+ if momentum continues. The chart suggests that once the breakout level is sustained, the price may rally toward the projected target, bringing renewed attention to this coin in the short to mid-term.
Investor interest in WINUSDT has also been picking up, aligning with the technical structure. With positive sentiment in the market and favorable price action patterns, the pair is well-positioned for further growth. This makes it a crypto asset worth watching closely, especially for traders seeking medium-term opportunities.
✅ Show your support by hitting the like button and
✅ Leaving a comment below! (What is You opinion about this Coin)
Your feedback and engagement keep me inspired to share more insightful market analysis with you!
WINUSDT Forming Bullish ReversalWINUSDT is currently showcasing a classic bullish reversal pattern, indicating a potential shift from its recent downtrend toward an upward trajectory. This pattern is typically observed at market bottoms and often serves as a signal for a strong rebound. With solid volume support accompanying the recent candles, market participation is increasing—suggesting that smart money may be accumulating positions ahead of a major breakout.
Technically, WIN has tested and respected key support zones multiple times, strengthening the validity of this reversal formation. The price structure suggests growing momentum, and if it breaks above its immediate resistance level with a confirmed candle close, it could trigger a new bullish wave. Based on the pattern's breakout potential and measured move targets, a 50% to 60% price gain is reasonably anticipated in the short to mid-term.
Moreover, WIN is gaining attention across trading forums and crypto communities due to its low market cap and historical tendency to deliver sharp rallies once momentum shifts. This adds to its speculative appeal and could attract more volume and volatility in the days ahead. Traders seeking early entries into potentially explosive moves should keep a close eye on this coin.
Overall, WINUSDT presents a compelling technical case supported by strong demand zones and a classic bullish setup. If current levels hold and breakout confirmation arrives, the coin could offer lucrative returns for disciplined traders.
✅ Show your support by hitting the like button and
✅ Leaving a comment below! (What is You opinion about this Coin)
Your feedback and engagement keep me inspired to share more insightful market analysis with you!
WinkLink Same setup since November Hello Traders and have a good sunday,
Here we go again, same chart, same setup, same idea about this crypto.
Not much has changed, I have various positions on the project because I'm interested, I have seen their site, I am not a player/shuffler because you always lose,
but people like to play so the industry thanks to blockchain could grow and if it were to be so winklink will be in the forefront having developed the platform first.
The platform is fluid, you can bet on anything and there are also live games. In addition to this winklink has entered the NFT world (I am not a fan of NFT, but we have it! ) but the interesting thing is that winklink has a good basis for growth and development.
After the long introduction on why I follow this market, let's move on to the facts; we are still below the support of the main trendline but if you have opened positions or bought tokens in the buying areas that I indicated in the previous months we are in positive, but I think it will go down again so we continue to accumulate lower. If BITSTAMP:BTCUSD grows to 48K probably we'll see 0.0005-0.00055 .
Thanks to those who support me and follow me, I do not sell signals .
I am a trader like you and I bring my experience available to all.

WINK is ready to Shoot UP 20/02/2021it has done its accumulation and now very much ready to have its show run

WINk pumping soon?Hello guys 😃
Before we start to discuss, I would be glad if you share your opinion on this post's comment section and hit the like button if you enjoyed it!
yesterday, the price almost hit the MA100 line and bounce back from that point so it shows that MA100 can be a firm support for WIN right now.
on the other hand, there was a zone which was broken yesterday too and it shows price between 0.0006282 till 0.0006834 can be the huge support zone and also can be our first step of buying.
for me, mid-term targets are 0.0008063 and 0.0009944(specified with Fibonacci) however it may change over time and that's for sure I am not selling all of WINks before reaching the ATH.(if we lost MA100 support, next is that zone I drew which include MA200 in it.)
Hope you enjoyed my analysis, You can support me with your likes and comments! (always open to hearing points from the others)
Attention: this isn't financial advice I'm just trying to share my vision and remember we must always see what's up with BTC after that go buy altcoins. never forget investment principles and do your research before investing.

WIN/USDT - We are witnessing an upward trend!It is time to analyze WIN/USDT!
On a daily and 4-hour timeframe, we are witnessing an upward trend. It has strong support at $0.00071 and 0.00064. If it can maintain this support, you can enter. Targets are mentioned on the chart.

WINUSDT Technical Analysis
⏳ Spot
💎 WINUSDT has broken above the symmetrical triangle and a major resistance. It might go lower for a retest before it continues the Bullish move. The Bullish move may start by a large bullish engulfing candle
🌐 Tradingview
🏁 Short & Medium Term
💵 Invest Only 5% of your Portfolio
🎳 Entry at Market or at 0.0005370
☕️ TP1 0.0006666
🍺 TP2 0.0010000
🍻 TP3 0.0014000
🍾 TP4 _________
🍷 TP5 _________
🍸 TP6 _________
🍹 TP7 _________
🎁 TP8 _________
🚫 SL 0.0004320
Good Luck 🎲
Check the Links in Description and If you LIKE this analysis, Please support our page and Ideas by hitting the LIKE 👍 button. ❤️ Your Support is really appreciated! ❤️
Traders, if you have your own opinion about it, please write your own in the comment box. We will be glad for this.
Feel free to request any pair/instrument analysis or ask any questions in the comment section below.
We will have more FREE forecasts in TradingView soon
Have a Profitable Day


WINkLink vs Bitcoin (WIN / BTC ) __ 1Day Binance charttrade your BTC to collect WIN tokens at green price range, or below price range (DISCOUNT)

WINUSDT 4- Hours Analysiswinusdt is in a descending channel, it also is upper the historical price.
as you can see at the chart, it is below the midline, So we can expect one of those target, if the price can break the midline we can go Long, otherwise Short.
Good luck.

Requested: Update on WINUSDT (yet another scalp, maybe)After my last idea on WIN, which played wonderfully as expected (.012 to .0.15, see previous idea), this altcoin did get into a descending channel, bringing the price all the way down to .0009
Right now everything looks bearish, there’s no volume (barring the exact candle that got the coin out of the downtrend, most probably a whale/insider bought to save it).
However, we can wait and see a break out of the green triangle. If this does happen with a strong volume candle, we can expect some kind of parabolic move to at least the first resistance, which is at 0.012. Pay attention to the 4hrs candle the most, don’t be fooled by some fake breakouts in the 15m/1hr.
Good luck, and stay safe!
Not financial advice.

WIN possible trade??So WINK has been sleeping for a while! And it has been tanking a lot!
Right now it has bounced from the long term trend level I frew month ago.
But it also got rejected from the bearish trend it has been following for over a week.
It might actually be forming a new support around 0.00088 as you can see!
These few arrows are possible scenarios... I don't think this coin can go even lower...
With the decreasing volume it just had to go down... Right now if there will be enough volume it might do at least movement to 0.001 or 0.0011...
We will see... But I am pretty bullish!


WINk (WIN) - April 21Hello?
Dear traders, nice to meet you.
By "following" you can always get new information quickly.
Please also click "Like".
Have a good day.
----------------------------------
(WINUSD 1W chart)
(1D chart)
We have to see if we can quickly ascend above the 0.00136811 point.
If it falls from the 0.00065416 point, a Stop Loss is required to preserve the profit and loss.
We need to see if the volatility between around 20th and around 24th of April will cause any movement outside the 0.00092861-0.00180761 range.
-----------------------------------
(WINBTC 1D chart)
We have to see if we can get support and climb in the 218 Satoshi-237 Satoshi section.
If you fall from the 218 Satoshi point, you can touch the 165 Satoshi point, so you need a short Stop Loss.
-------------------------------------------------- -------------------------------------------
** All indicators are lagging indicators.
So, it's important to be aware that the indicator moves accordingly with the movement of price and volume.
Just for the sake of convenience, we are talking upside down for interpretation of the indicators.
** The wRSI_SR indicator is an indicator created by adding settings and options from the existing Stochastic RSI indicator.
Therefore, the interpretation is the same as the conventional stochastic RSI indicator. (K, D line -> R, S line)
** The OBV indicator was re-created by applying a formula to the DepthHouse Trading indicator, an indicator that oh92 disclosed. (Thank you for this.)
** Check support, resistance, and abbreviation points.
** Support or resistance is based on the closing price of the 1D chart.
** All explanations are for reference only and do not guarantee profit or loss on investment.
Explanation of abbreviations displayed on the chart
R: A point or section of resistance that requires a response to preserve profits
S-L: Stop Loss point or section
S: A point or segment that can be bought for profit generation as a support point or segment
(Short-term Stop Loss can be said to be a point where profits and losses can be preserved or additionally entered through installment transactions. It is a short-term investment perspective.)
GAP refers to the difference in prices that occurred when the stock market, CME, and BAKKT exchanges were closed because they do not trade 24 hours a day.
G1: Closing price when closed
G2: Cigar at the time of opening
(Example) Gap (G1-G2)

FUNBTC, BUY FROM SUPPORT LEVEL OR WAIT FOR BULLISH BREAKOUT...FUNBTC, BUY FROM SUPPORT LEVEL OR WAIT FOR BULLISH BREAKOUT... Buy with strong evidence.

WINBTC, BUY AFTER BULLISH BREAKOUT OF HORIZONTAL RANGEWINBTC is ranging from many days. Buy after proper breakout above the resistance line as mentioned in the chart.. Thanks Kaptan Forex


WIN/USDT Bullish WIN has been growing like his family in recent days
and now with the retest it has done, it is expected to continue its upward trend.
Retest is done and breakout can be easily seen
I expect it to be up after this route

WIN/USDT 1 hour chartIn this idea I showing the movement I expect to see out of this coin as it has just made a formation that leads into a parabolic move.
If you agree throw me a like and follow me for more ideas and concepts that keep you in the gains. Much love to my supporters
ND

WINUSDT292% 🔥
I spend time to choose the best cryptocurrencies with the highest profit and least possible risk .
Many of you are present here, but you neither 'like' nor comment. Unfortunately I don't receive much energy from you! These analyses really deserve more than 10 or 20 'like's.
I won't share my analysis anymore if you don't share and like.


Wink: add it to your watch list!It seems to want to break out!:)
Wait for it to break out and retest the resistance.
Please hit LIKE if you find this useful!
