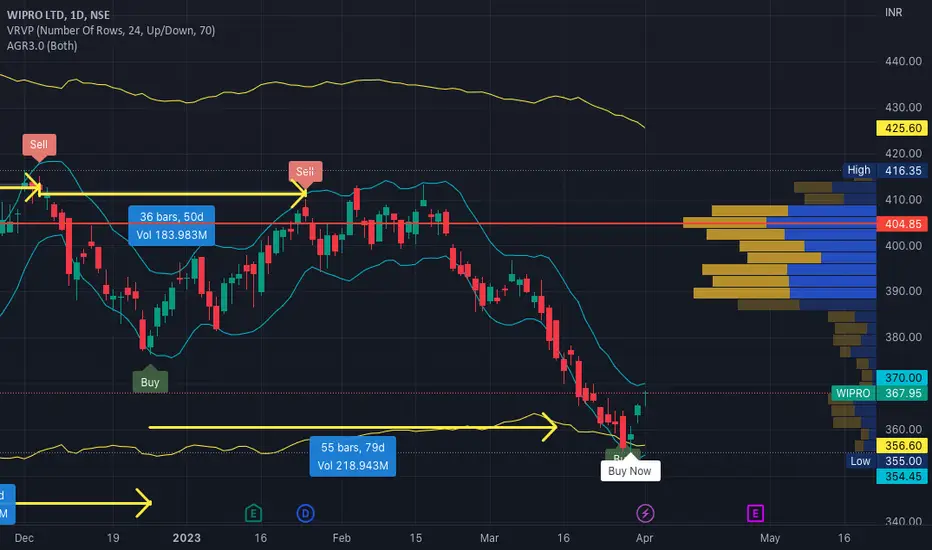
Wipro can be a good buy at this level
Wipro can be a good buy at this level for upside of around 5% in very short term.
Wipro
Wipro Break Very Importent Level wipro break importent level with 200W Moving Average. In upcoming weeks we will see a fall In wipro stocks
(Always Do your own analysis)

WiproMost of the price action views for a stock are reliable and here on the chart of Wipro; formation of Triple Bottom Pattern clearly depicting a new signal and will provide a good opportunity after its reversal from price of 377. Whereas new orders will arise at 400 witha target of 60points and the booton of the pattern will be a stoploss for the trade.
Thank you.
Hope you like my view.

Major Correction for Nifty ITNEGATIVE SIDE :
1. Nifty IT broke the major support level at 34450pts during the last trading session.
2. The two major rejection candle at the level 36750pts in the recent time is so crucial. This is because of the two major correction happened in the past one in 2000 and the other during the corona situation. Both the corrections have the 4.236 fibonacci level at around 36000pts. Which will play the major supply zone for the coming days for IT.
3. The Fibonacci level drawn in this chart shows the pullback happens exactly at 0.618 level, which is again a negative side.
4. The moving average 20 & 50 is getting closer.
POSITIVE SIDE:
1. Currently, Nifty IT is at a major support level. Lets hope that it will bounce back from the level.

Wipro Long time investment Opportunity Wipro Long time investment Opportunity. Retesting the multiyear breakout level and also forming rounding bottom pattern. Looks good opportunity for long term investment.

W pattern in weekly chart Wipeout stock made W pattern in weekly chart. By the way, this stock is fundamentally strong in my view so, didn't sold even I have a bought near 550 rupees. After consolidation again wipro is ready to move up with good pattern.

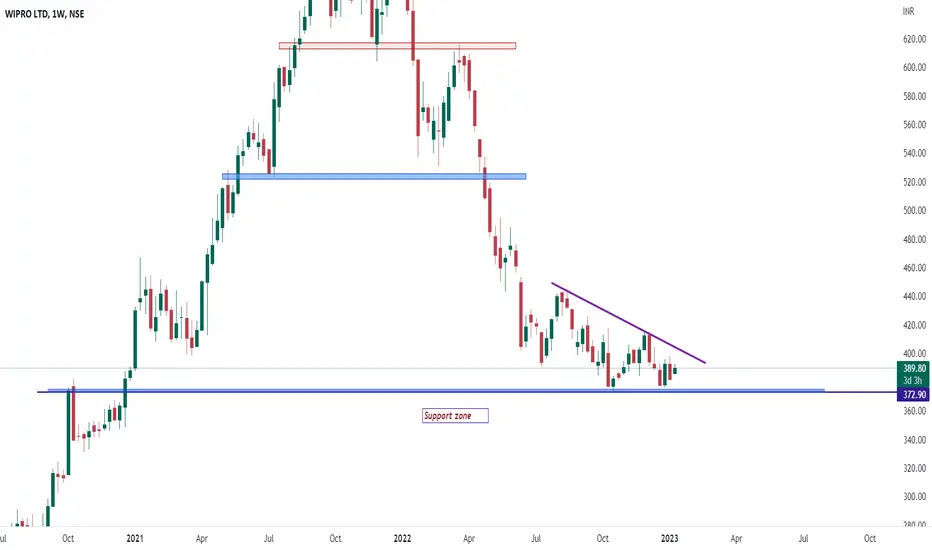
WIPRO A weekly timeframe chart of WIPRO which is losing from the last year
Strong support zone is 370
Minor resistance zone is 420 zone

Wipro Bullish in 1 DTF!#The Pattern is a simple Support and Resistance
Points to Look:
1.The Channel Pattern is slanted downwards, this pattern has a high success rate!
2.Inside the pattern the recent trend is Bullish(Higher Lowes formation)
3.There is 'W' shape pull visible(23 Dec to Jan 6 touch points) in the trend which is also a good bullish sign.
4.Despite all this wait for a confirmation candle tomorrow and then take the position.
5.The Stoploss is minimal which can be kept below the upper trend line also shown in chart.
$Happy Trading Mates$

Wipro 4 Hourly Timeframe Wipro in 4 Hour Timeframe formed Twizzer top pattern & bearish engulfing. If next candle formed bearish then pattern will be confirmed i.e bearish engulfing and you can set 1:1 target.

WIPRONSE:WIPRO
Good Earnings !
All Indicators look Positive , Much Needed BO !
One can Go Long !
Note :
1.One Can Go long with a Strict SL below the Trendline or Swing Low of Daily Candle.
2. Close, should be good and Clean.
3. R:R ratio should be 1 :2 minimum
4. Plan as per your RISK appetite
Disclaimer : You are responsible for your Profits and loss, Shared for Educational purpose!

Wipro Looks good for Swing/IntradayWipro has given a breakout of a small pattern from cmp we can aim for small target or even higher levels too.

WIPROWipro weekly chart
from Last 3 month this stock is trading from 370-430 zone
Strong support is 370
Strong Resistance is trendline
NiftyIT - historical performance since 2007The chart shows 15 years track record of the Nifty-IT sector.
Out-performers :
1. Coforge
2. HCLTech
3. TCS
4. Infy
Under-performers :
1. TechM
2. Mphasis
3. LTIM
4. Wipro
5. LTTS
When the IT sector starts to turn and takes charge in the sector rotation, I would be rooting for the historical out-performers which create value.

#CARBORUNIV #ORIENTABRA #WENDT #GRINDWELL #HEG #WHIRLPOOL #TWL #CARBORUNIV
NSE:CARBORUNIV
CMP: 885
TP: 1050
SL: 828
TF: <6m
RR > 2.8 times
Return 18%
Factors:
BULLISH WEDGE BREAKOUT
Trend Following
Rising Volume with rising Prices.
Flag pattern breakout.
Pennant Pattern Breakout with Bullish Candle.
Retest Successful.
Higher Highs & Higher Lows.
Broken above RESISTANCE levels
Trading at SUPPORT levels
Earnings are strong.
Bullish Wedge Breakout
Risk Return Ratio is healthy.
And
Rising from Double Bottom Pattern to Flag Pattern forming.
If you like my work KINDLY LIKE SHARE & FOLLOW this page for free Stock Recommendations.
With 💚 from Rachit Sethia

#MtarTech #MINDTREE #LTI #LTTS #INFY #TCS #CNXIT #WIPRO #COFORGE#MTARTECH
NSE: MTARTECH
CMP: 1737.80
TARGET: 2200
SL: 1550
RR: >2.5 times
Return > 26%
Timeframe: <6M
CAN BREAK ALL-TIME HIGH IN FUTURE
Factors:
BULLISH WEDGE BREAKOUT
Trend Following
Rising Volume with rising Prices.
Flag pattern breakout.
Pennant Pattern Breakout with Bullish Candle.
Retest Successful.
Higher Highs & Higher Lows.
Broken above RESISTANCE levels
Trading at SUPPORT levels
Earnings are strong.
Bullish Wedge Breakout
Risk Return Ratio is healthy.
And
Rising from Double Bottom Pattern to Flag Pattern forming.
If you like my work KINDLY LIKE SHARE & FOLLOW this page for free Stock Recommendations.
With 💚 from Rachit Sethia

Wipro broke falling wedge on daily TF also RSI above 60+ on dailWipro broke falling wedge on daily TF also RSI above 60+ on daily weekly
taken support from 60 level its good time to get in


WIPROday chart of wipro in which this stocks make bottom or strong support zone at 372 and next strong resistance zone is 446

LONG ::: WIPRODATE: 23 NOV 2022
INSTRUMENT: WIPRO
CMP: 388.75
BUY ABOVE: 389.70
SL: 384.45
EXIT 01: 395.10
EXIT 02: 401.40
RISK DISCLOSURE:
We are not SEBI registered analyst.
views expressed here are for our record purposes only.
Please consult your personal financial advisor before investing.
We are not responsible for your profits / losses what so ever.

Wipro Hey traders this a wipro daily chart an IT sector company which is falling rapidly from last year now it making falling wedge pattern which is bullish 370 zone will be striong support zone

WIPRO LTD 60% RetracementNSE:WIPRO has retraced 60% from its top. As per analysis, this is the best time to make entry for long position.
My entry point is 380. Will wait for target of 449 & 515
Stop loss will be only 30 points (350)
Note: This is my personal analysis, only for learning.
Thanks.

Wipro forming Cup and handle FormCan take a trade above 430 levels for long term
If crossed those levels will give a very good move
#wipro

WIPRO ANALYSIS!!, 50 MOVING AVERAGE!!WPRO has given a bas returns this year, its quartly results also gave a negative affect on its stock prices. but this are all short term, things.
this stock has pastly given great returns(look at the past trend i have drawn, the returns are approx.. 45% in a year).
long term things are the moving averages, stock is in tis 50 moving average, as shown in its chart. good stock to buy now.
