#WIPRO wipro - Double Inside bar formed in daily.
take trade buy/ sell once crosses high / low of mother bar respectively.
Modified pitchfork used
Wipro

WIPRO - BULLISHDATE: 18 MAY 2021
INSTRUMENT: WIPRO
TREND: BUY
TIME FRAME: DAY
CMP: 508.05
BUY ABOVE: 515
STOP LOSS: 505
TGT 01: 526
DISCLAIMER:
We are not S E B I registered analysts. Please consult your personal financial advisor before investing. We are not responsible for your profits/losses whatsoever.

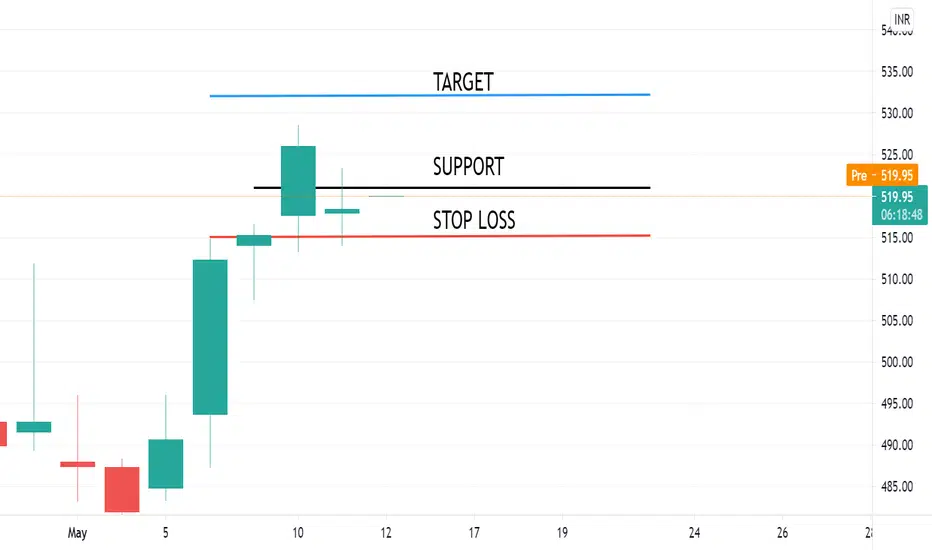
WIPRO LONG INTRADAY 12 MAY,2021Dear trader,
If u look at the chart of WIPRO (analysis based intraday only) the WIPRO Buy at 521 and Target at 532
Best Buy at 519.
Our Best Buy is based on high quality research and when the instrument reaches this level , it’s a jackpot trade.
Best Buy level might be executed or might not be executed.
The chart clearly indicates Bullish Trend you can also see the candle stick patters for more indepth analysis.
In Intraday most important thing is to enter and exit points.
Our signals are based on analytics, algorithms, mathematical derivatives.
Always be a responsible trader, kindly trade only when you have maximum opportunity in the market with minimum risk and with keynotes like data, analysis and proper strategies.
Kindly message us for strategies and analysis.
My View On Wipro The stock is Close Within 52 Week High Zone. Near term, the target is 545. There is Buying opportunity at levels 440 to 460.

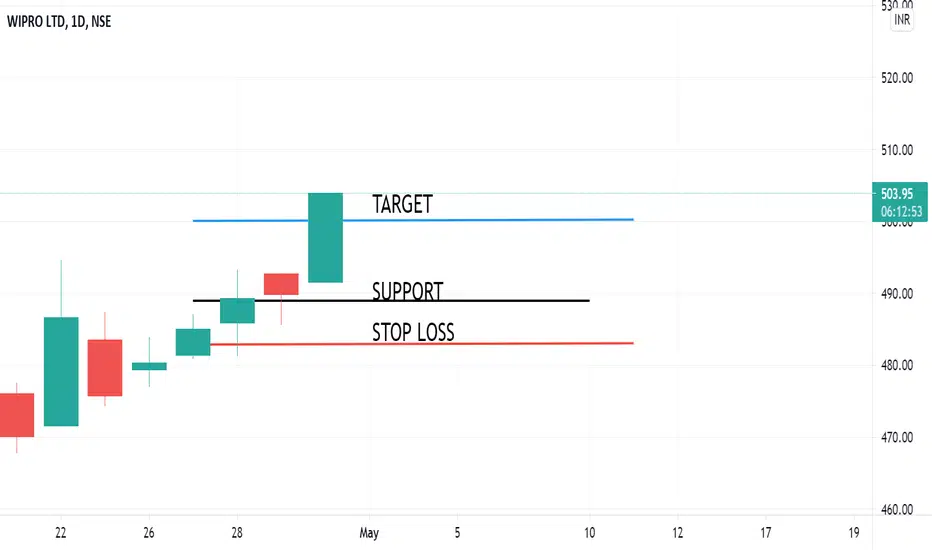
WIPRO LONG INTRADAY 30 APR,2021Dear trader,
If u look at the chart of WIPRO (analysis based intraday only) the WIPRO Buy at 489 and Target at 500
Best Buy at 485.
Our Best Buy is based on high quality research and when the instrument reaches this level , it’s a jackpot trade.
Best Buy level might be executed or might not be executed.
The chart clearly indicates Bullish Trend you can also see the candle stick patters for more indepth analysis.
In Intraday most important thing is to enter and exit points.
Our signals are based on analytics, algorithms, mathematical derivatives.
Always be a responsible trader, kindly trade only when you have maximum opportunity in the market with minimum risk and with keynotes like data, analysis and proper strategies.
Kindly message us for strategies and analysis.
WIPRO LONG INTRADAY 28 APR, 2021Dear trader,
If u look at the chart of WIPRO (analysis based intraday only) the WIPRO Buy at 490.50 and Target at 500
Best Buy at 488.
Our Best Buy is based on high quality research and when the instrument reaches this level , it’s a jackpot trade.
Best Buy level might be executed or might not be executed.
The chart clearly indicates Bullish Trend you can also see the candle stick patters for more indepth analysis.
In Intraday most important thing is to enter and exit points.
Our signals are based on analytics, algorithms, mathematical derivatives.
Always be a responsible trader, kindly trade only when you have maximum opportunity in the market with minimum risk and with keynotes like data, analysis and proper strategies.
Kindly message us for strategies and analysis.

Missed Move in Wipro ? worry not let this blackline guide youThere's nothing more fearful than FOMO but hey dont worry if you missed on this one If the price of wipro retraces back to black line enter BUY and keep trailing profits .

WIPRO - Wipro LtdLevels -
Buy - 432+
Target - 470
SL - 418
The stock has tended to show a strong up move in the month where earnings are reported. The trend has been consistent over the past year and by looking at the current outset of WFH and COVID-19 second wave, it is most likely to continue. The quarterly and annual results will be announced on April 15, 2021, which might make the stock revisit the levels of 470. In addition to that, post Q3 results the stock has formed a flag pattern on both weekly and daily charts, therefore a breakout cannot be ruled out while an event is planned for the coming week. Once the level of 430 is breached on the upside, which is acting as a resistance, the stock can go up to the levels of 470, an up move of close to 10%.
IT shares in the given circumstances of WFH due to COVID-19 is a safe bet as there has been a significant increase in operating profit of the companies which will continue in coming quarters if the situation stays like this. This can be observed by looking at their quarterly results.
NOTE: These findings and levels are purely based upon the knowledge and understanding of the post publisher. The idea here is to predict the future price movements hence, please do not consider this as stock advice or recommendation.

Wipro - Flag BreakoutWipro has given a perfect flag breakout, expected t move up to 450 and 460 levels.

Buy wipro for big profitBuy wipro its following this patter from last 3 times, It'll give u big profit...


Wipro Intraday Analysis and Prediction for 08.03.2021Things to be kept in mind :
``````````````````````````````````````
>> Take this trade only if Nifty is red in its pre-market session.
>> Take this trade only if Wipro opens equal to or below last day close price.
>> Maintain strict stoploss as per risk adequate.
>> Trade under professional supervision only.

WIPRO LTD EXPECTED MOVE - TRADING IDEA - WIPRO INDIA WIPRO LTD EXPECTED MOVE - TRADING IDEA - WIPRO INDIA

WIPRO LTD - Under the triangleWIPRO
Triangle- waiting fo Breakout
Bouncing 0ff 100 MA
buy the breakout with volume
Targets in green

Wipro trading IdeaAs it showing Wipro is trading on harmonic butterfly pattern. Keep an eye on 394 level if this level does not break and the price crosses over again above 410 level again. We can target 480 level.

Wipro on supportWipro previously gave pennant breakout at daily timeframe but failed to achieve target, now wipro at major support and at 50% retraement.Targets on chart...

IT STOCKS - Start of another leg of bull rally? - ANALYSISThe analysis is done purely based on chart patterns and price action.
The analysis is done on 15 min TF, but the target as shown in charts can take couple of days upto weeks.
As can be seen from NITFY IT chart as well as from charts of stocks linked below, price went for retracement phase, made a low on 21st December 2020 and then gave breakout from trendline.
Thereafter the price gave good breakout and came down to retest the levels.
This can be a signal another leg of bull rally.
Targets are determined with the help of Trend-Based Fib extension tool.
Traders must check for signals of reversal before entering into any trade.
This analysis is just for study purpose and to show beginners how to analyse a sector and its stocks.
This is not a trade recommendation. Traders must trade with their own risk and money management.
TCS chart analysis-
INFY Chart analysis -
WIPRO chart analysis -
HCLTECH chart analysis -
Feel free to comment for any suggestion or query regarding price action or chart analysis.

Wipro buy opportunity wipro near crucial levels
possibility to fill the the gap is high
caution:- it may come down to test the levels again and then make a big move up
but target is sure to come within the next few days
trade safe
keep SLs wisely
happy trading


WIPRO Long for Target 530WIPRO moved as shown in previous chart.
It may correct to 400 in coming days. Monday January 11 it may cross 450 . Then a correction to 400 and rally begin for target 520+ .However its not end .
