FireHoseReel | WLD at a Major Decision Zone Range Break Incoming🔥 Welcome To FireHoseReel !
Let’s dive into Worldcoin (WLD) analysis.
⛳️ WLD Fundamental Overview
Worldcoin (WLD) is a digital identity and crypto project using biometric proof of personhood. Ranked #52 on CoinMarketCap, it has ~2.58B circulating supply, ~$1.24B market cap, and steady daily volume.
👀 WLD 4H Overview
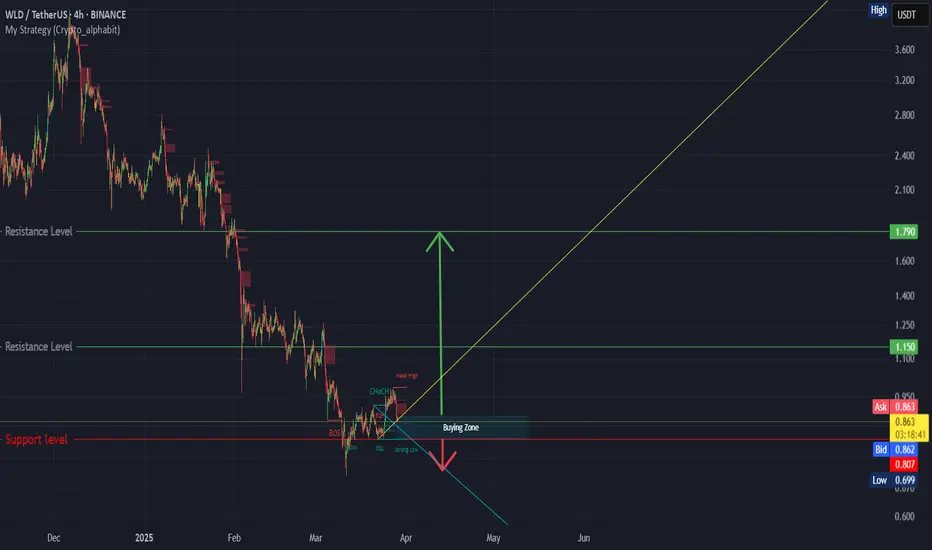
After recent sell-offs, WLD is trading below a descending curve trendline. Price is currently ranging between the $0.5587 resistance and $0.4728 support. A breakout from this structure could offer a solid trading opportunity.
📊 Volume Analysis
Worldcoin is experiencing strong selling pressure, with sell-side momentum and fear outweighing buying interest. Sellers are currently driving price toward the lower boundary of the range.
✍️ WLD Trading Scenarios
🟢 Long Scenario:
There are two resistance-based long setups to choose from. The first is our pre-breakout trigger at the orange trendline around $0.5247, which requires increasing buying volume to activate a long. The second and stronger long trigger is the monthly resistance at $0.5587.
🔴 Short Scenario:
The short setup is straightforward. A breakdown below the daily support at $0.4728, confirmed by rising sell volume, could provide a valid short entry.
🧠 Protect your capital first. No setup is worth blowing your account. If risk isn’t controlled, profit means nothing. Trade with rules, not emotions.
Wldanalysis

WLD/USDT — Retest at the Golden Zone. Bullish Momentum Continue?📝 Full Analysis & Narrative
The WLD/USDT chart (2D timeframe, Binance) is showing one of the most exciting moves in recent months. After being pressured in a prolonged downtrend, the price finally printed an explosive breakout, breaking through significant resistance with a strong bullish candle, and leaving a long upper wick up to the 1.93 USDT area.
However, the euphoria quickly faded with a strong rejection at that resistance zone. At present, price is once again testing the Golden Zone (Fibonacci 0.5–0.618 at 1.357–1.519), which also coincides with a new support area after the role flip from previous resistance.
This makes the yellow zone a critical level:
If the zone successfully holds selling pressure, WLD has strong potential to continue its bullish rally.
On the other hand, if the zone breaks down, the market may treat the previous breakout as a false breakout, opening the way for a deeper decline.
---
🔎 Structure & Pattern
Previous trend: Long bearish phase → accumulation stage → impulsive breakout.
Current pattern: Breakout + Retest (confluence support at the Golden Zone).
Liquidity event: The long wick above 1.93 indicates a stop-hunt before retracement.
Confluence: Fibonacci retracement 0.5–0.618, historical support, and psychological level at 1.5.
This setup is commonly referred to as a “Breakout-Retest-Continuation” in price action, but it is also prone to becoming a bull trap if the support fails.
---
🚀 Bullish Scenario
1. Price holds within the 1.357–1.519 zone with a bullish rejection candle → potential rebound.
2. Additional confirmation: A 2D close above 1.93 → validates bullish momentum.
3. Step-by-step upside targets:
2.316 (minor resistance)
2.794 (major supply zone)
3.780 → 4.397 → 5.913 (mid-to-long-term Fibonacci extension and historical resistance levels).
---
📉 Bearish Scenario
1. Price breaks down and closes 2D below 1.357 → invalidation of the Golden Zone.
2. Selling pressure intensifies, opening room for further downside:
1.00 (psychological support)
0.80 (minor support)
0.573 (historical swing low, last demand zone)
3. Such breakdown would confirm a false breakout and likely trigger distribution.
---
📊 Conclusion
The Golden Zone (1.357–1.519) is the ultimate key area.
As long as price holds above this zone, the bullish trend remains valid with potential towards 1.93 and beyond.
Failure to hold opens the risk of a sharp correction back to the 1.00–0.57 area.
The 2D candle close & volume are the most important confirmations to watch.
Remember: this is an area full of both opportunity and risk. Proper risk management is essential.
---
#WLDUSDT #WLD #Altcoin #Crypto #Breakout #Fibonacci #GoldenZone #PriceAction #TechnicalAnalysis #SupportResistance #Bullish #Bearish #SwingTrade #DYOR

WLD/USDT — Testing Major Demand Zone — Breakout or Bull Trap?Summary:
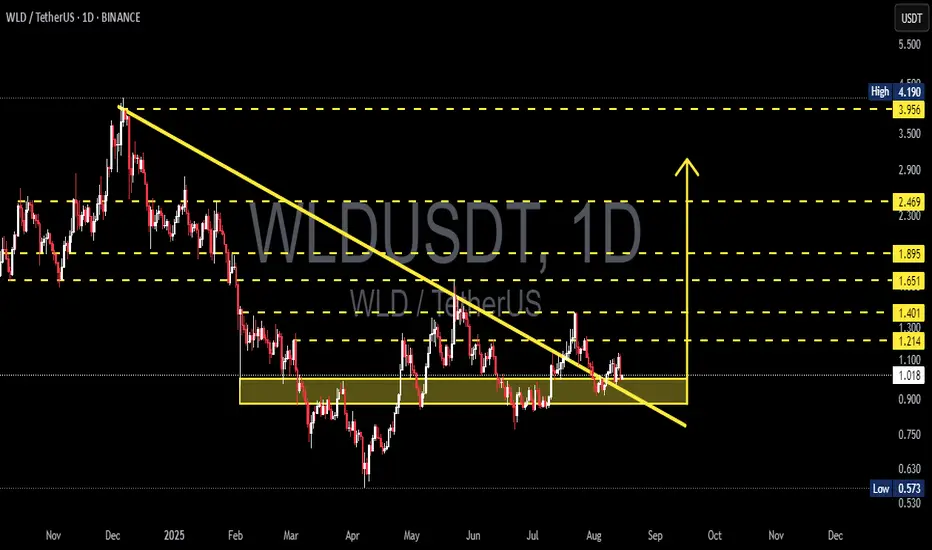
Price is sitting right inside a major demand zone (~0.90–1.10 USDT) after previously breaking above and then pulling back around the long-term descending trendline (yellow line). This zone has repeatedly acted as a strong floor — the next move (bounce & rally vs. breakdown) will set the medium-term direction.
---
Key Levels
Current price ≈ 1.014 USDT (dotted line).
Demand / support zone: ~0.90 – 1.10 USDT (yellow box).
Resistances / upside targets: 1.214, 1.401, 1.651, 1.895, 2.469 USDT.
Structural high: ~3.95 – 4.19 USDT.
Major low: 0.573 USDT.
---
Pattern Analysis
1. Multi-month descending trendline — the yellow line shows a sustained downtrend from Dec–Jan highs. Sellers have dominated until a potential structural shift.
2. Breakout & retest — price broke above the trendline earlier but fell back into the demand zone → this could be a breakout + retest (bullish) or a false breakout / bull trap (bearish) depending on confirmation from price & volume.
3. Range / consolidation — since March–May, price has been oscillating around the yellow box → a clear accumulation/demand area.
4. Lower highs structure is still visible on the higher timeframe — sellers are not fully out of the picture.
---
Bullish Scenario
Confirmation needed: Daily close above 1.214 USDT (stronger if backed by higher volume).
Conservative plan: Wait for a daily close > 1.214 and enter on a retest; stop below 1.01), stop tight at 0.88.
Example R:R (entry 1.014, stop 0.88):
Target 1: 1.214 → +19.7% upside, ~13.2% risk → R:R ≈ 1.5:1.
Target 2: 1.401 → +38.2% upside → R:R ≈ 2.9:1.
Target 3: 1.651 → +62.8% upside → R:R ≈ 4.8:1.
Note: Hold / trail stop after 1.401 break to maximize potential.
---
Bearish Scenario
Confirmation needed: Daily close below 0.90 with strong selling volume.
Downside targets: Next major support ~0.57 USDT, with intermediate zone around 0.63–0.75 likely tested first.
Example short setup: Entry after breakdown (<0.90), stop above 1.214. Entry 0.90, stop 1.214, target 0.573 → ~36.3% profit, ~34.9% risk → R:R ≈ 1.04:1 (less attractive unless strong confirmation).
Note: A breakdown of this demand zone could trigger a sharp sell-off — use stop-loss.
---
Key Confirmation Signals
Volume spike during breakout/breakdown (volume up = stronger validation).
Daily/weekly close above resistance or below support (avoid false wicks).
Momentum indicators: Bullish divergence on RSI / MACD cross for longs; bearish momentum (falling RSI, MACD cross down) for shorts.
Trendline reaction: Long upper wicks = rejection; clean close = strength.
---
Risk Management Tips
Confirm setups on daily + 4H before entry.
Limit risk per trade (e.g., 1–2% of capital).
Beware of bull traps — don’t overleverage on weak-volume breakouts.
Use trailing stops when in profit.
---
> WLD/USDT — Testing major demand zone (0.90–1.10).
Previous breakout failed to hold momentum → price is back inside the accumulation zone. Watch for daily close >1.214 (bullish) or breakdown <0.90 (bearish). Manage your risk.
#WLDUSDT #Worldcoin #CryptoAnalysis #SupportResistance #Breakout #Retest #BullVsBear #TechnicalAnalysis #RiskManagement
#WLD/USDT#WLD
The price is moving within an ascending channel on the 1-hour frame, adhering well to it, and is on its way to breaking strongly upwards and retesting it.
We have support from the lower boundary of the ascending channel, at 0.890.
We have a downtrend on the RSI indicator that is about to be broken and retested, supporting the upside.
There is a major support area in green at 0.900, which represents a strong basis for the upside.
Don't forget a simple thing: ease and capital.
When you reach the first target, save some money and then change your stop-loss order to an entry order.
For inquiries, please leave a comment.
We have a trend to hold above the 100 Moving Average.
Entry price: 0.939
First target: 0.959
Second target: 0.986
Third target: 1.016
Don't forget a simple thing: ease and capital.
When you reach the first target, save some money and then change your stop-loss order to an entry order.
For inquiries, please leave a comment.
Thank you.

WLDUSDT at a Critical Level: Valid Breakout or Just a Fakeout?WLDUSDT is catching traders' attention after successfully breaking above a long-term descending trendline that has capped price since late 2024. But the big question now is — is this the start of a real trend reversal, or just a classic bull trap fakeout?
---
📌 Detailed Technical Breakdown
🟡 1. Major Trendline Breakout
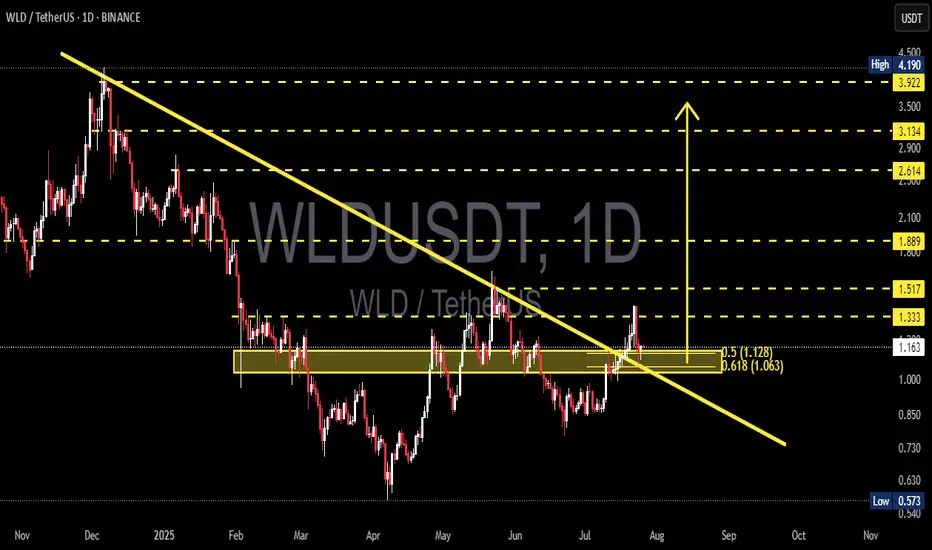
The yellow trendline drawn from November 2024 has finally been broken to the upside.
This is a potential signal that bearish momentum is weakening significantly.
🟨 2. Key Demand Zone (Horizontal Yellow Box)
The area between 1.063 – 1.128 USDT has acted as a strong demand/support zone since March 2025.
Price is currently retesting this zone, which makes it a decisive level for validating the breakout.
🔁 3. Fibonacci Retracement Levels
Price is retesting the 0.5 (1.128) and 0.618 (1.063) retracement levels.
These fib levels could serve as a launchpad for a bullish continuation if held.
🧱 4. Layered Resistance Structure
If the bounce holds, WLD could target:
🔹 1.333 – Psychological resistance
🔹 1.517 – Previous structural resistance
🔹 1.889 – Key horizontal level
🔹 2.614 – 3.922 – Medium-term targets based on historical structure and fib extension
---
🟢 Bullish Scenario (Increasing Probability)
Price holds above the 1.063 – 1.128 zone and confirms a rebound.
A daily close above 1.333 would further confirm bullish continuation.
Formation of higher highs and higher lows would validate trend reversal.
🔴 Bearish Scenario (If Breakdown Occurs)
Price loses support at 1.063, invalidating the breakout and retest.
Possible targets to the downside:
Minor support: 0.85 – 0.75
Major support: 0.573 (Previous macro low)
---
📈 Interesting Chart Pattern
Potential formation of an Inverse Head and Shoulders, with the neckline around 1.333.
A confirmed breakout above the neckline could trigger a strong bullish impulse.
---
🎯 Conclusion
WLD is now in a golden zone that will decide its medium-to-long-term trend.
The 1.063 – 1.128 area is make-or-break. If bulls defend this zone, it confirms trend reversal. If it fails, WLD could slide back into a distribution range.
📌 Traders who wait for confirmation at this stage may have the strategic edge.
#WLDUSDT #WLDAnalysis #CryptoBreakout #TrendlineBreak #TechnicalAnalysis #InverseHeadAndShoulders #FibonacciSupport #AltcoinSetup #CryptoTrading #CryptoUpdate
#WLD/USDT#WLD
The price is moving within a descending channel on the 1-hour frame, adhering well to it, and is heading towards a strong breakout and retest.
We are experiencing a rebound from the lower boundary of the descending channel, which is support at 0.950.
We are experiencing a downtrend on the RSI indicator that is about to be broken and retested, supporting the upward trend.
We are looking for stability above the 100 moving average.
Entry price: 1.20
First target: 1.04
Second target: 1.07
Third target: 1.10

#WLD/USDT#WLD
The price is moving within a descending channel on the 1-hour frame and is expected to break and continue upward.
We have a trend to stabilize above the 100 moving average once again.
We have a downtrend on the RSI indicator that supports the upward move with a breakout.
We have a support area at the lower limit of the channel at 0.900, acting as strong support from which the price can rebound.
Entry price: 0.913
First target: 0.944
Second target: 0.971
Third target: 1.004

Worldcoin (WLD/USDT) Breakout Potential – Bullish Setup in PlayThis chart illustrates a potential breakout setup for Worldcoin (WLD) against USDT on the 2-day timeframe (2D), published on June 25, 2025. Key technical insights are as follows:
🔍 Technical Structure:
Strong support zone (accumulation area): Formed in the range of $0.9300 – $0.5728 (highlighted in yellow box). Price is currently consolidating within this zone, which has been tested multiple times and held, indicating a potential bottom formation.
Descending trendline: Has been broken with a bullish candle, suggesting an early signal of a potential trend reversal from bearish to bullish.
Key resistance levels (potential targets):
$1.4824 – initial breakout validation level
$2.4242 – mid-term resistance
$3.8198 – psychological and previous distribution zone
$6.0189 – major resistance before ATH
$10.7997 – $11.9650 – All Time High zone
📈 Projected Price Movement:
Bullish scenario depicted:
1. A possible retest of the breakout zone around $0.93
2. Gradual price rally toward $1.48 and $2.42 as initial targets
3. If momentum and volume support the move, a further rally toward $3.81 and $6.01 is possible
4. Ultimate long-term target lies near previous highs at $10.79–$11.96
💡 Additional Notes:
This setup is still unconfirmed and requires further breakout confirmation and supporting volume for reliability.
Trade remains high risk, as price is still near the final support zone before potential breakdown.

WLDUSDT 3D AnalysisWLD ~ 3D Analysis
#WLD Buy gradually from here if you still have confidence in this coin with a short term target of at least 15%+ from here.

#WLD/USDT#WLD
The price is moving within a descending channel on the 1-hour frame, adhering well to it, and is heading for a strong breakout and retest.
We are experiencing a rebound from the lower boundary of the descending channel, which is support at 1.18.
We are experiencing a downtrend on the RSI indicator that is about to be broken and retested, supporting the upward trend.
We are looking for stability above the 100 moving average.
Entry price: 1.26
First target: 1.316
Second target: 1.36
Third target: 1.408

Worldcoin WLD price analysisSam Altman has officially launched the World ID project in the United States, a digital identity system based on iris scanning.
Users are scanned using the Orb device and receive a digital ID (World ID) and 14 #WLD tokens
Last time then the price of OKX:WLDUSDT has been actively growing , when more than 12 million people from 100+ countries "sold" their "scanned eye" for a reward in #Worldcoin
Do you believe that history will repeat itself and the price of #WLDUSD will rise, at least to $3.75?

WLDUSDT 1D AnalysisWLD ~ 1D Analysis
#WLD Mark this coin, and buy when successfully penetrating this resistant line with a short -term target of at least 10%+.

#WLD/USDT#WLD
The price is moving within a descending channel on the 1-hour frame and is expected to continue lower.
We have a trend to stabilize below the 100 moving average once again.
We have a downtrend on the RSI indicator, supporting the upward move with a break above it.
We have a support area at the upper limit of the channel at 0.844.
Entry price: 0.838
First target: 0.828
Second target: 0.809
Third target: 0.789

WLD (SPOT)BINANCE:WLDUSDT
WLD / USDT
4H time frame
analysis tools
____________
SMC
FVG
Trend lines
Fibonacci
Support & resistance
MACD Cross
EMA Cross
______________________________________________________________
Golden Advices.
********************
* Please calculate your losses before any entry.
* Do not enter any trade you find it not suitable for you.
* No FOMO - No Rush , it is a long journey.
Useful Tags.
****************
My total posts
www.tradingview.com
WLDUSDT 3DWLD ~ 3D Analysis
#WLD This is the lowest support block for now. Buy from here if you still have a Conviction on this coin.

WLDUSDT 3DWLD ~ 3D
#WLD If you still have Conviction on this coin,. Maybe this support block is very interesting to start accumulating this coins.

#WLD/USDT Ready to go higher#WLD
The price is moving in a descending channel on the 1-hour frame and sticking to it well
We have a bounce from the lower limit of the descending channel, this support is at 2.30
We have a downtrend on the RSI indicator that is about to break, which supports the rise
We have a trend to stabilize above the moving average 100
Entry price 2.40
First target 2.50
Second target 2.60
Third target 2.71

wld update"🌟 Welcome to Golden Candle! 🌟
We're a team of 📈 passionate traders 📉 who love sharing our 🔍 technical analysis insights 🔎 with the TradingView community. 🌎
Our goal is to provide 💡 valuable perspectives 💡 on market trends and patterns, but 🚫 please note that our analyses are not intended as buy or sell recommendations. 🚫
Instead, they reflect our own 💭 personal attitudes and thoughts. 💭
Follow along and 📚 learn 📚 from our analyses! 📊💡"

#WLD (SPOT) entry range (1.550- 1.950) T.(8.000) SL(1.532)BINANCE:WLDUSDT
entry range ( 1.550- 1.950)
Target1 (3.600) - Target2 (4.590)- Target3 (6.000)- Target4 (8.000)
SL .1D close below (1.532)
Golden Advices.
**********************
* collect the coin slowly in the entry range.
* Please calculate your losses before the entry.
* Do not enter any trade you find it not suitable for you.
* No FOMO - No Rush , it is a long journey.
Useful Tags.
**********************
My total posts
( www.tradingview.com )
1Million Journey
( www.tradingview.com )
( www.tradingview.com )
********************************************************************************************************************** #Manta ,#OMNI, #DYM, #AI, #IO, #XAI , #ACE #NFP #RAD #WLD #ORDI #BLUR #SUI #Voxel #AEVO #VITE #APE #RDNT #FLUX #NMR #VANRY #TRB #HBAR #DGB #XEC #ERN #ALT #IO #ACA #HIVE #ASTR #ARDR #PIXEL #LTO #AERGO #SCRT #ATA #HOOK #FLOW #KSM #HFT #MINA #DATA #SC #JOE #RDNT #IQ #CFX #BICO #CTSI #KMD #FXS #DEGO #FORTH # AST #PORTAL #CYBER #RIF #ENJ #ZIL #APT #GALA #STEEM #ONE #LINK #NTRN #COTI #RENDER #ICX #IMX #ALICE #PYR #PORTAL #GRT #GMT # IDEX #NEAR #ICP #ETH #QTUM #VET #QNT #API3 #BURGER .

WLDUSDTWLD ~ 3D ✅
#WLD So far it has been able to maintain this support block. If you have Conviction on this coin,. Maybe it's time to start buying again.

#WLD 2ND scenarioMIL:WLD in case of failing the 1ST scenario so the
2nd scenario will be like that
re-entry range ( 1.028 ---- 1.268 )
Stop loss ... daily close below ( 0.971)
targets and taking profits are same
#WLD
MIL:WLD
#WLDUSDT
#WLDUSD
#swingtrade
#shortterminvestment
#ALTCOIN
#Cryptotading
#cryptoinvesting
#investment
##trading
#cryptocurrencytrading
#bitcoininvestments
#Investing_Coins
#Investingcoins
#Crypto_investing
#Cryptoinvesting
**** #Manta ,#OMNI, #DYM, #AI, #IO, #XAI , #ACE #NFP #RAD #WLD ****
#bitcoin
#BTC
#BTCUSDT
BINANCE:WLDUSDT

#WLD in a good buying range for a huge profit and small stoploss#WLD
MIL:WLD
#WLDUSDT
#WLDUSD
#swingtrade
#shortterminvestment
#ALTCOIN
#Cryptotading
#cryptoinvesting
#investment
##trading
#cryptocurrencytrading
#bitcoininvestments
#Investing_Coins
#Investingcoins
#Crypto_investing
#Cryptoinvesting
**** #Manta ,#OMNI, #DYM, #AI, #IO, #XAI , #ACE #NFP #RAD #WLD ****
#bitcoin
#BTC
#BTCUSDT
BINANCE:WLDUSDT

WLDUSDT 2DWLD ~ 2D
#WLD This support block must not be penetrated. this is key support for $WLDUSD. We placed a small buy here with a short term target of at 15%+ of this
