WLFIUSDT Forming Bullish MomentumWLFIUSDT is forming a clear bullish momentum pattern, a classic bullish reversal signal that often indicates an upcoming breakout. The price has been consolidating within a narrowing range, suggesting that selling pressure is weakening while buyers are beginning to regain control. With consistent volume confirming accumulation at lower levels, the setup hints at a potential bullish breakout soon. The projected move could lead to an impressive gain of around 50% to 60% once the price breaks above the wedge resistance.
This falling wedge pattern is typically seen at the end of downtrends or corrective phases, and it represents a potential shift in market sentiment from bearish to bullish. Traders closely watching WLFIUSDT are noting the strengthening momentum as it nears a breakout zone. The good trading volume adds confidence to this pattern, showing that market participants are positioning early in anticipation of a reversal.
Investors’ growing interest in WLFIUSDT reflects rising confidence in the project’s long-term fundamentals and current technical strength. If the breakout confirms with sustained volume, this could mark the start of a fresh bullish leg. Traders might find this a valuable setup for medium-term gains, especially as the wedge pattern completes and buying momentum accelerates.
✅ Show your support by hitting the like button and
✅ Leaving a comment below! (What is your opinion about this Coin?)
Your feedback and engagement keep me inspired to share more insightful market analysis with you!
Wlfi

WLFIUSDT Forming Falling WedgeWLFUSDT is forming a clear falling wedge pattern, a classic bullish reversal signal that often indicates an upcoming breakout. The price has been consolidating within a narrowing range, suggesting that selling pressure is weakening while buyers are beginning to regain control. With consistent volume confirming accumulation at lower levels, the setup hints at a potential bullish breakout soon. The projected move could lead to an impressive gain of around 50% to 70% once the price breaks above the wedge resistance.
This falling wedge pattern is typically seen at the end of downtrends or corrective phases, and it represents a potential shift in market sentiment from bearish to bullish. Traders closely watching WLFUSDT are noting the strengthening momentum as it nears a breakout zone. The good trading volume adds confidence to this pattern, showing that market participants are positioning early in anticipation of a reversal.
Investors’ growing interest in WLFUSDT reflects rising confidence in the project’s long-term fundamentals and current technical strength. If the breakout confirms with sustained volume, this could mark the start of a fresh bullish leg. Traders might find this a valuable setup for medium-term gains, especially as the wedge pattern completes and buying momentum accelerates.
✅ Show your support by hitting the like button and
✅ Leaving a comment below! (What is your opinion about this Coin?)
Your feedback and engagement keep me inspired to share more insightful market analysis with you!

FireHoseReel | WLFI: Ready to Explode, Don’t Get Left Behind🔥 Welcome FireHoseReel !
Let’s break down what’s happening with WLFI right now.
👀 WLFI – 4H Technical Breakdown
WLFI has successfully broken its 4H dynamic resistance and has already completed a clean pullback retest.
Price is now pushing into the 4H box top, and a confirmed breakout above this zone will activate our long trigger, giving us a valid entry setup.
📊 Volume Analysis – Key Factor for Breakout
Multi-timeframe volume is increasing as WLFI approaches this resistance.
This time, the breakout attempt is backed by stronger buy volume + a clean curve-line break, unlike previous attempts where price showed volume divergence and failed to break through.
For WLFI, volume is the critical element—without strong volume, this resistance has historically rejected price.
✔️ WLFI/BTC Pair Note
The WLFI/BTC pair isn’t very useful for analysis since it’s only listed on Upbit, and the chart lacks structure and clarity.
Because of that, we rely mainly on the WLFI/USDT pair, which currently shows solid momentum toward a breakout.
✍️ Long Scenario setup becomes valid with:
• Breakout above 0.1602
• Clear volume convergence + increasing buy pressure
• A structure that forms a higher high outside the 4H box
• You can also wait for a break-and-retest (pullback) of this resistance to enter.
This entry is slightly riskier but gives a cleaner confirmation if the pullback candle forms an indecision/rejection setup.
🛞 Risk Management & Disclaimer
Please remember to always use proper risk management and position sizing. Nothing in this analysis is financial advice. The market can change quickly, so always trade based on your own strategy, research, and risk tolerance. You are fully responsible for your own trades.

Breaking: World Liberty Financial ($WLFI) Token Spike 19% The price of World Liberty Financial ($WLFI) Spike 19% Albeit market turmoil. This week was short of surprise for many as CRYPTOCAP:BTC tanked to the $80k resistant zone with other altcoins following suit.
As per the 4-hour price chart, the asset is in a bullish flag pattern with possible retracement to the $0.13 support point before picking liquidity up.
About World Liberty Financial
USD1 Stablecoin: A fully reserved, dollar-pegged stablecoin deployed across Ethereum, BNB Chain, Solana, and Tron, enabling fast, low-cost global transactions.
$WLFI Governance Token: A non-transferable token used to vote on protocol upgrades, incentive structures, and ecosystem expansion.
Real-World Adoption: Billions in USD1 transactions, including institutional settlement deals, with reserves held by BitGo and verified through independent audits.
World Liberty Financial Price Data
The World Liberty Financial price today is $0.142165 USD with a 24-hour trading volume of $399,635,789 USD. World Liberty Financial is up 19.36% in the last 24 hours. The current CoinMarketCap ranking is #30, with a market cap of $3,497,298,050 USD. It has a circulating supply of 24,600,253,404 WLFI coins and a max. supply of 100,000,000,000 WLFI coins.

WLFI Update🚨📊 WLFI Update
WLFI is testing the black resistance line ⚫️,
and at the same time it has formed a bullish inverted head & shoulders pattern —
a strong reversal structure.
If WLFI breaks out above this resistance,
we can expect:
🟢 First target: green line level
🟢 Second target: next green line level
A breakout here could trigger a strong bullish move.

TradeCityPro | WLFI Coin: Eyes on Trump’s Project for Big Moves👋 Welcome to TradeCity Pro!
In this analysis, I want to review the WLFI coin.
✔️ Before we dive into the analysis, let me tell you that this coin is part of the World Liberty Finance project.
🔔 This is a DeFi project linked to Trump, which hasn't fully launched yet, and its token was recently listed. Given Trump's significant influence on social media, it might be worth keeping an eye on this coin, as it could potentially make sharp moves.
📅 Daily Timeframe
Since its listing in September, this coin has been trading in a range below the 0.2423 resistance level for about a month. After that, it experienced a sharp drop in line with the overall market downturn on October 10th.
📊 Currently, the main support level for this coin is at 0.1127, and the price is facing resistance at 0.1518.
🧩 One thing to note is that this chart is only two months old, so all the support and resistance levels in it have been formed within this short period. Therefore, don't view these levels as extremely strong and unbreakable. The token hasn't fully discovered its real value yet.
🧮 Moving on with the analysis:
If the price breaks 0.1518, the next resistance levels are 0.1804 and 0.2423. I will personally start buying this coin once the 0.2423 level is broken. The earlier trigger would be the break of 0.1518.
💡 For a bearish scenario, it’s quite clear:
A break of 0.1127 would confirm the start of a downward move.
📝 Final Thoughts
Stay calm, trade wisely, and let's capture the market's best opportunities!
This analysis reflects our opinions and is not financial advice.
Share your thoughts in the comments, and don’t forget to share this analysis with your friends! ❤️

WLFI has potential for at least 35% gain to 0.19$Hi the support and resistances on the chart are based on the previous data and weekly candlesticks if BINANCE:WLFIUSDT holds this last support the potential of 35% gain is logical toward 0.19$

WLFIUSDT Forming Falling WedgeWLFIUSDT is showing a strong technical setup as it forms a classic falling wedge pattern, which is typically seen as a bullish reversal signal. After a period of downward consolidation, the price is now narrowing within the wedge, indicating that selling pressure is weakening while buyers are gradually gaining control. This structure often precedes a significant breakout to the upside, with traders anticipating a potential gain of around 140% to 150% once a confirmed breakout occurs.
The trading volume remains consistently good, showing that market participants are actively engaging with WLFIUSDT. The steady rise in volume during consolidation suggests accumulation by smart money, which often leads to sharp bullish moves once key resistance levels are broken. This technical setup aligns perfectly with the current market environment, where traders are increasingly looking for undervalued assets showing strong reversal potential.
Investor sentiment toward WLFIUSDT has been improving as interest continues to grow across multiple exchanges. Many are recognizing the coin’s long-term potential, supported by technical strength and a recovering broader market. If momentum continues, WLFIUSDT could soon confirm its breakout from the falling wedge, setting the stage for a major bullish rally in the coming sessions.
✅ Show your support by hitting the like button and
✅ Leaving a comment below! (What is You opinion about this Coin)
Your feedback and engagement keep me inspired to share more insightful market analysis with you!

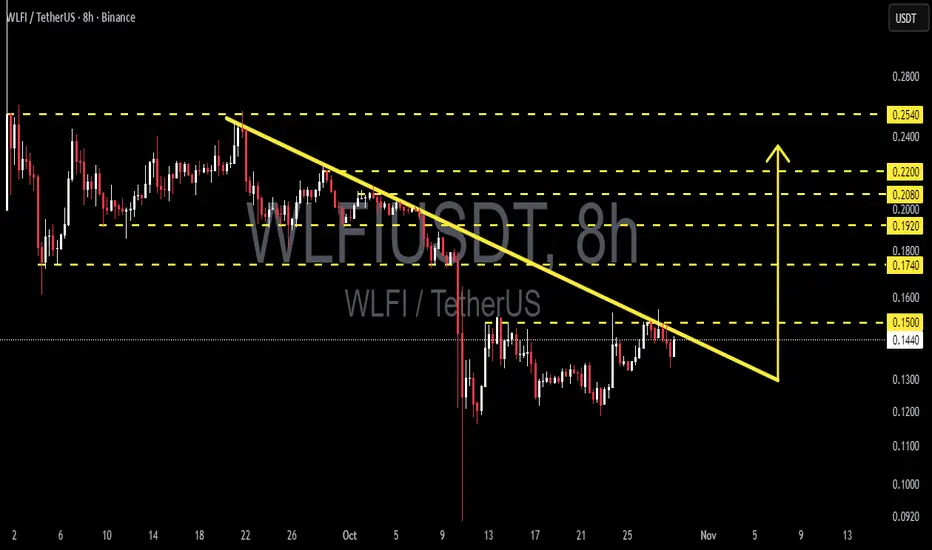
WLFI/USDT — Ready to Explode from Final Consolidation Zone?After weeks of staying under heavy selling pressure within a descending trendline, WLFI is finally showing early signs of life around the 0.13–0.14 demand zone.
The current structure indicates a phase of capitulation followed by silent accumulation, where sellers are losing strength while smart money gradually steps in.
A clear series of lower highs has formed since early October, pressing the price down under a strong descending resistance line (yellow) — and now, price is testing that barrier once again.
A confirmed breakout from this line could mark the beginning of a mid-term trend reversal.
---
Pattern Structure
The chart reveals a descending triangle pattern that’s losing momentum, combined with a potential double-bottom formation near 0.13.
If WLFI manages to break and close above the yellow trendline with solid 8H candle confirmation, the market could shift decisively to bullish territory.
---
Bullish Scenario
If price successfully breaks and closes above 0.1500, momentum will flip in favor of the bulls.
A confirmed breakout could unlock the next targets:
0.1740 – 0.1800 → first breakout zone,
0.1920 – 0.2000 → medium-term expansion area,
0.2200 – 0.2540 → final swing target zone.
Additional confirmation signals:
Rising breakout volume,
8H or daily candle closing firmly above trendline,
RSI & MACD showing early bullish crossover from neutral zone.
This scenario could signal the end of accumulation and the start of a new impulsive wave.
---
Bearish Scenario
If price fails to break the descending line and gets rejected again, the 0.13–0.12 zone becomes the last defense for bulls.
A breakdown below 0.1200 would re-confirm bearish control, targeting:
0.10 as the next liquidity pool,
and possibly 0.0920 if another liquidation spike occurs.
Rejection at the trendline would reinforce seller dominance and continue the broader downtrend until a new higher low forms.
---
Technical Conclusion
WLFI is standing at a make-or-break level, where just one decisive candle can flip the entire structure from bearish to bullish.
This setup is ideal for position traders seeking early accumulation before full breakout confirmation.
However — caution is key.
A breakout without volume is a trap, and a breakdown without confirmation could be a fakeout.
Watch the price reaction closely around the descending trendline, as this is where the next major move will be defined.
---
#WLFI #WLFIUSDT #CryptoBreakout #TrendlineResistance #CryptoAnalysis #ChartPattern #TechnicalAnalysis #CryptoTrading #AltcoinSetup #SwingTrade #SupportResistance #MarketStructure
WLFIUSDT UPDATE#WLFI
UPDATE
WLFI Technical Setup
Pattern: Bullish Falling Wedge
Current Price: $0.135
Target Price: $0.210
Target % Gain: 55.95%
$WLFI is breaking out of a bullish falling wedge pattern on the 4H timeframe. Current price is $0.135 with a target near $0.210, showing around 56% potential upside. The breakout indicates renewed bullish momentum, suggesting a potential continuation move higher.
Time Frame: 4H
Risk Management Tip: Always use proper risk management.

WLFIUSDT Forming Falling WedgeWLFIUSDT is currently forming a falling wedge pattern a well-known bullish reversal setup often seen before a strong upward breakout. This technical structure suggests that the recent downtrend is losing strength, with sellers gradually losing momentum while buyers start stepping in at key support levels. As the price continues to consolidate within the narrowing wedge, traders are watching closely for a breakout confirmation that could trigger a major bullish move in the coming sessions.
The trading volume remains strong, reflecting healthy participation and growing investor confidence. Typically, a falling wedge followed by an increase in buying volume signals the start of a trend reversal. With an expected gain ranging from 140% to 150%+, WLFIUSDT presents a potentially high-reward setup for traders who are eyeing mid-term opportunities. This volume-backed price action reinforces the view that momentum could soon shift decisively to the upside, making WLFI a strong candidate for bullish continuation once the breakout is confirmed.
Investors are showing renewed interest in the WLFI project, driven by its increasing visibility and potential in the broader crypto market. As optimism builds and technical conditions align, WLFIUSDT could become one of the standout performers in the upcoming market cycle. If the breakout sustains above resistance, it may pave the way for a significant rally, attracting both short-term traders and long-term investors looking for promising opportunities in emerging digital assets.
✅ Show your support by hitting the like button and
✅ Leaving a comment below! (What is You opinion about this Coin)
Your feedback and engagement keep me inspired to share more insightful market analysis with you!

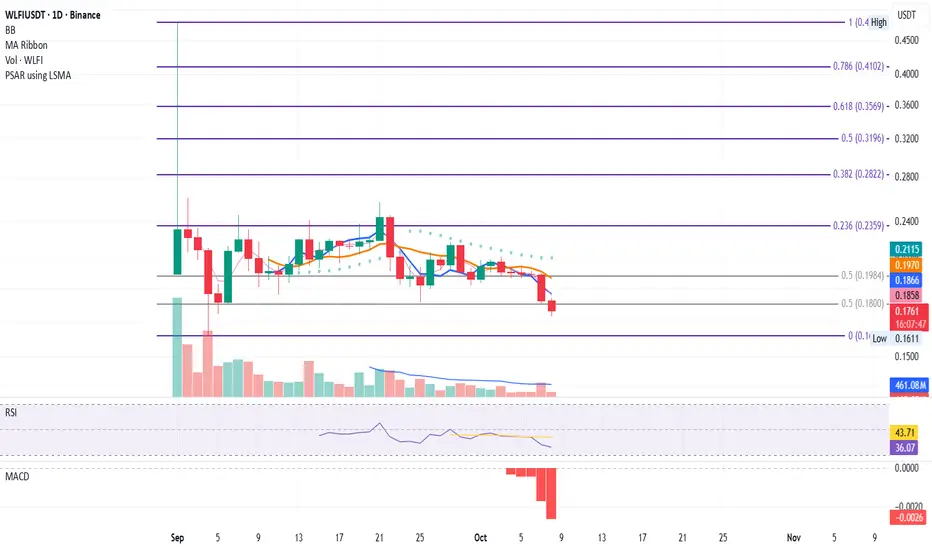
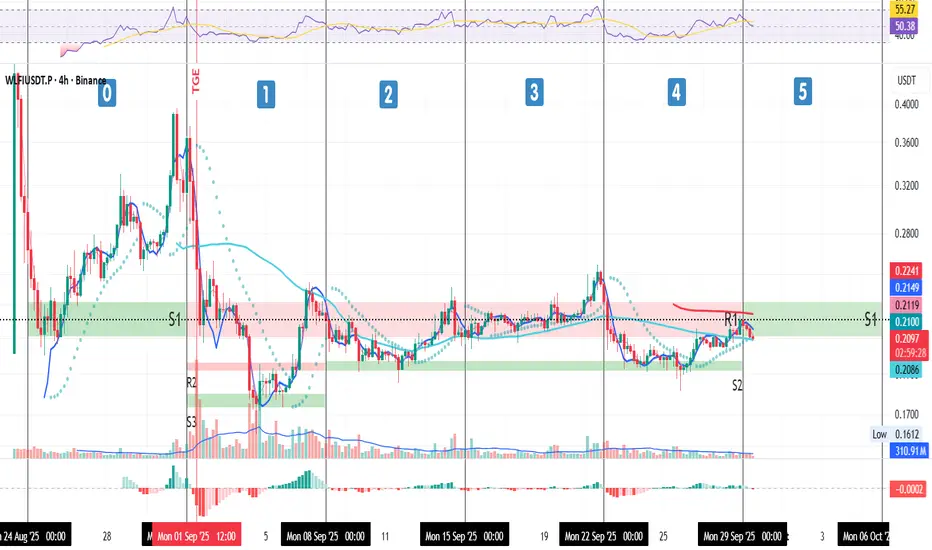
WLFI Daily – Key Support Broken After Multiple HoldsWLFI Daily – Losing Key Support at the 0.5 Level
WLFI has lost the 0.5 Fibonacci level at 0.1798, a support zone that held multiple times: first during the early September TGE dump, and again on October 7 and 8.
Yesterday, October 9, marked the first daily close below this level, and today price continues to trade under it.
Unless WLFI manages to reclaim 0.1798 by today’s close, the downtrend is likely to continue.
From a system perspective, momentum remains bearish:
Price < MLR < SMA < BB Center, confirming a short-term downtrend.
The next possible support lies around the dotted line, but a retest of the 0 Fib level at 0.1611 looks increasingly likely if weakness persists.
The broader market has shown early signs of cooling after BTC’s ATH, and WLFI’s price action is now reflecting that shift in sentiment.
At this stage, risk management is essential, catching a falling market without confirmation often leads to deeper drawdowns.
Bias:
Bearish, structure weakening further below 0.5 Fib; watching for reaction near dotted line.
Always take profits and manage risk.
Interaction is welcome.

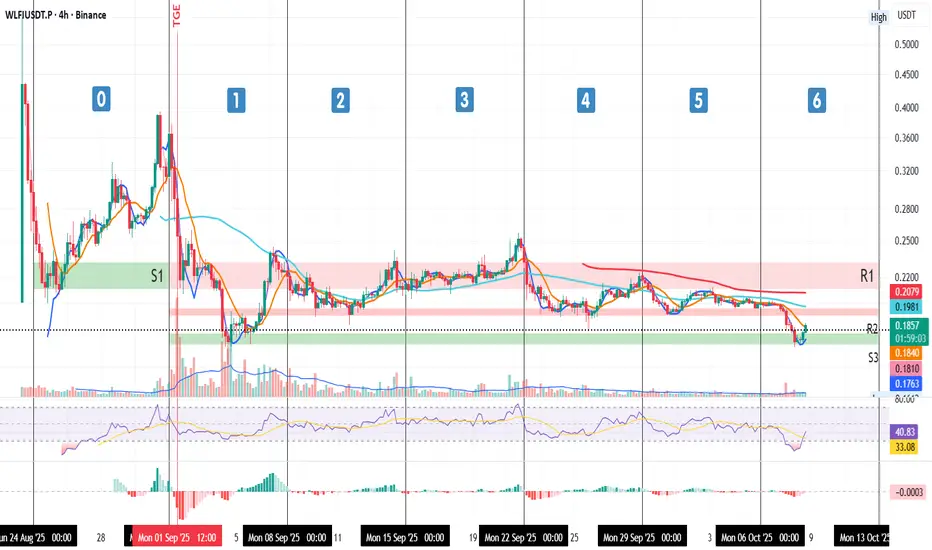
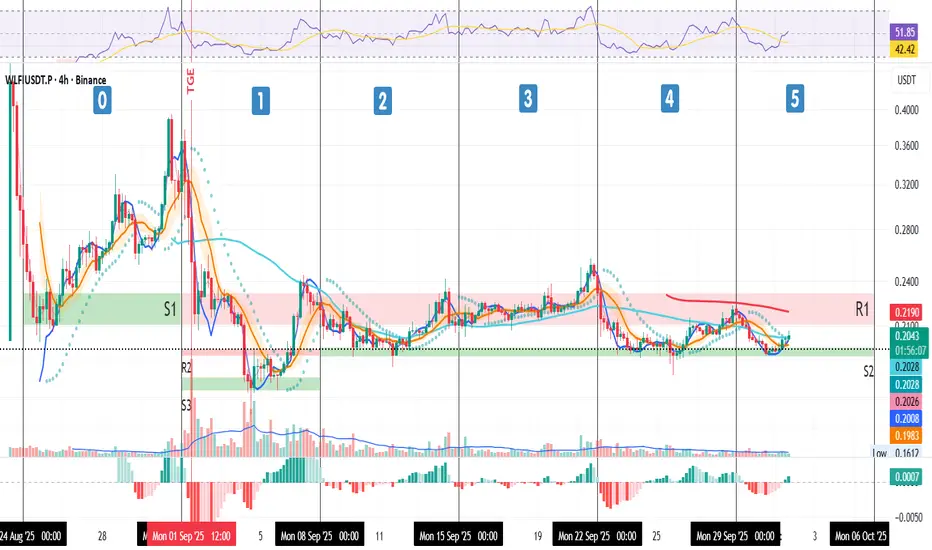
WLFI 4H – Week 6 / Oct 8 Update
Support at S3 is holding, and price has moved back above yesterday’s close.
From a system perspective, structure has flipped bullish:
Price > BB Centre > SMA > MLR, confirming a short-term uptrend.
The former S2 zone has turned into resistance, so price might pause once it reaches that level.
Across the crypto market, sentiment is improving as more assets recover.
Today’s close will show if this move can continue into tomorrow.
Bias:
Bullish short-term, structure improving, watching daily close for confirmation.
Always take profits and manage risk.
Interaction is welcome.
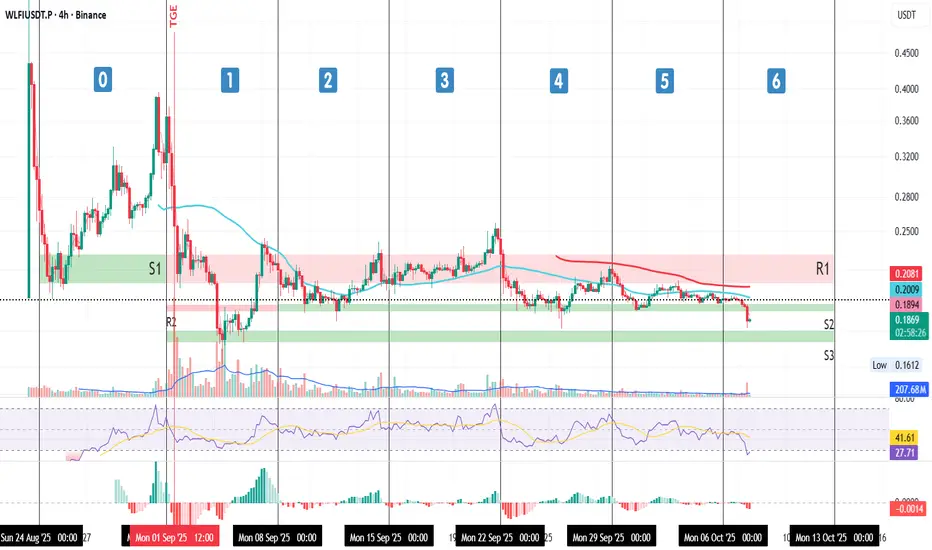
WLFI Daily – Risk Management Over HopeWLFI Daily – Testing the Last Support
WLFI has lost the 0.1984 level as support and is now testing 0.1800 USD, which marks the lowest daily close on record.
This makes today’s close particularly important, holding above this level could determine whether short-term structure stabilizes or breaks further.
From a system perspective, the current setup reads:
Price < SMA < MLR < BB Center, with PSAR still bearish, confirming a short-term downtrend.
Momentum indicators remain weak:
RSI is not yet oversold, leaving room for more downside, while MACD stays fully red.
There’s not much to add, these are the moments where risk management can save your account.
Controlling exposure and staying disciplined matters more than guessing the next candle.
Bias:
Bearish short-term, long-term view remains open once the market finds a confirmed bottom.
Always take profits and manage risk.
Interaction is welcome.
WLFI 4H – Week 6 / Oct 7
Price is falling sharply, breaking through the S2 green support zone and now approaching S3, which could act as the final line of support visible on this chart.
Risk management is active, I’ve reduced my position at a loss to avoid potential liquidation.
The drop isn’t isolated; it’s happening across the entire crypto market following BTC’s recent ATH around 125K.
Despite the short-term pressure, I’m keeping my long position open, as I strongly believe WLFI still has significant upside potential this Q4.
Bias: Long-term bullish ; short-term correction within a broader uptrend.
Always take profits and manage risk.
Interaction is welcome.
WLFI Daily on SPOT
Looking at the daily SPOT chart with Fibonacci levels, price action is showing some key spots.
Support: 0.5 Fib at $0.1984 (aligns with S2 from the 4H series).
Resistance: 0.236 Fib at $0.2354.
Technicals show early signs of strength: price is above the BB center and SMA, though PSAR is still bearish. RSI sits above its MA but remains under the mid-level.
Overall, the chart suggests price is condensing before a move. Considering the macro (rate cuts pushing risk-on), positive crypto news, and a historically bullish Q4, odds lean upward.
Patience and risk management remain key, otherwise you risk getting liquidated and watching price climb without you.
Always take profits and manage risk.
Interaction is welcome.

Week 5 / Oct 2 – WLFI 4H UpdateWLFI 4H Update – Week 5 / Oct 2
Price action holds above 50MA, SMA (pink), BB center, and MLR. The 200MA at R1 remains the ceiling to watch.
PSAR has flipped bullish, MACD positive, RSI steady above mid-level. Momentum structure points upward as long as support holds.
On the fundamentals, sentiment is boosted by Token2049 exposure and the new Aptos partnership, adding real weight behind the chart.
⚠️ Risk Management:
If price closes under S2, I’ll start scaling out to protect capital and avoid liquidation.
Always take profits and manage risk.
Interaction is welcome.
WLFI – Swing Trade Setup at Key SupportWLFI is currently testing a major support zone between $0.2000 – $0.2100, which aligns with a rising trendline on the 4H chart. This zone has previously acted as a strong base, and current price action suggests the potential for a bullish reversal. We're watching this area closely for a long swing trade opportunity.
📈 Entry Zone: $0.2000 – $0.2100
🎯 Take Profit Targets:
• TP1: $0.2200 – $0.2300
• TP2: $0.2400 – $0.2800
🔻 Stop Loss: 4H candle close below $0.1950 (invalidates the trendline support)
If price holds this zone and confirms with bullish structure, this trade offers a solid R:R. Always wait for confirmation and manage risk appropriately.

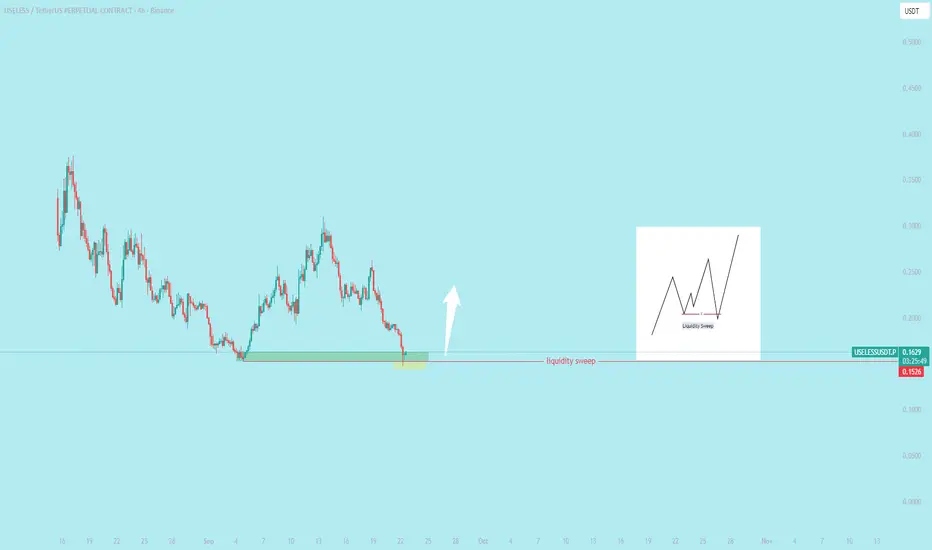
$USELESS liquidity sweep **liquidity sweep** in trading happens when the price of a coin or asset quickly moves to a level where many stop-loss orders or pending orders (buy/sell) are placed, triggering them. These orders are often clustered at key support or resistance levels, like round numbers or recent highs/lows. Large players (like whales or institutions) may intentionally push the price to these levels to "sweep" or clear out this liquidity (execute these orders), allowing them to buy low or sell high before the price reverses.
**In simple words**: It’s when the market price suddenly moves to hit a bunch of stop-losses or pending orders, clearing them out, often before a big price move in the opposite direction. For example, if many traders set stop-losses just below a support level, a liquidity sweep might push the price down to trigger those stops, then bounce back up.
**How to use this in trading**:
- Watch key levels (support/resistance) on charts where stop-losses might cluster.
- Avoid placing stop-losses at obvious levels (e.g., exact round numbers like $0.10).
- For coins like #WLFI or #USELESS, check order books or volume spikes to spot potential sweeps.
- Manage risk by using smaller position sizes and setting stops away from crowded levels.
Always confirm price action and trends before acting, especially with volatile new coins.
Week 5 / Oct 1 – WLFI 4H Update
Price action is holding support.
After bouncing off S2 as support, price is now pushing toward R1, where the 200MA sits, already proven resistance once.
Currently trading above the 50MA, SMA (pink), BB center, and MLR. PSAR looks ready to flip bullish. MACD has already crossed up, while RSI is above its MA and pressing into mid-range.
Momentum is cautious but tilting upward, shy signs of strength are building.
⚠️ Risk Management:
If price closes under S2, I’ll start scaling out to protect capital and avoid liquidation.
Always take profits and manage risk.
Interaction is welcome.
Week 5 Update – WLFI (4H)
Week 5 Update – WLFI (4H)
After holding S2 last week, price pushed higher into the red resistance zone, broke above the 50MA, and stopped right at the newly-formed 200MA, sitting perfectly in the middle of that red zone.
Today (Monday), price is testing the bottom of the S1 zone as support, which is now aligned with the 50MA, an important confluence level.
📈 Position:
I’m still long and plan to hold for a longer period, as long as the structure stays intact.
⚠️ Risk Management:
If price closes under S2, I’ll start scaling out to protect capital and avoid liquidation.
Always take profits and manage risk.
Interaction is welcome.
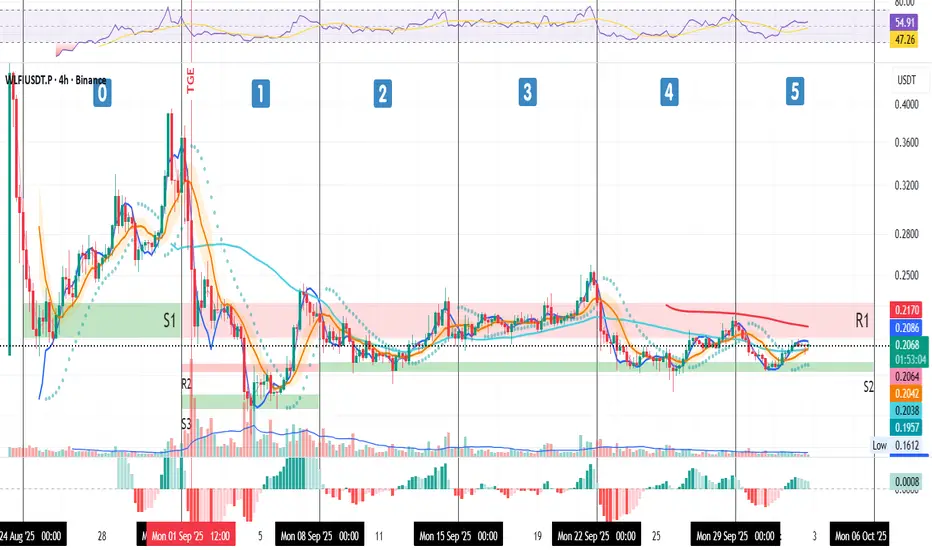
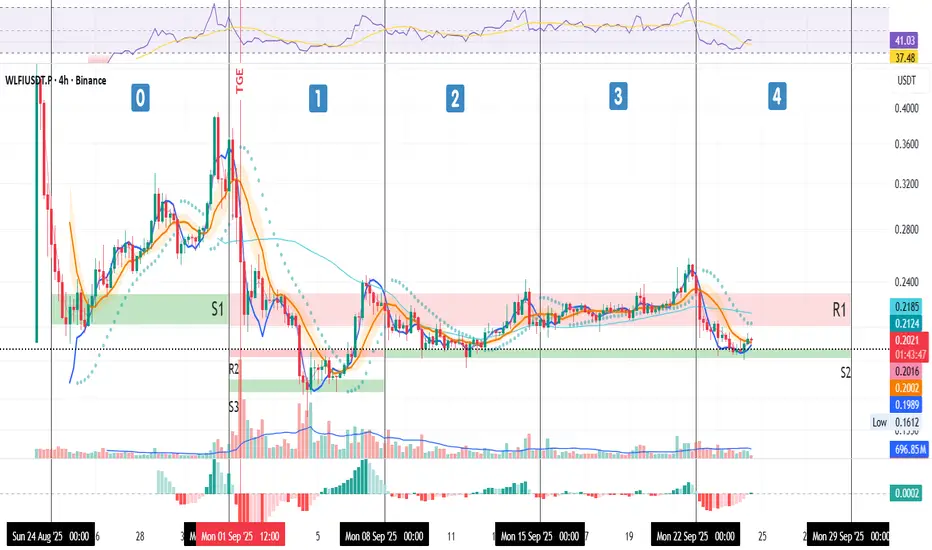
WLFI – Week 4 Test at SupportThis is $WLFI on the 4H
We’re now in week 4 since TGE, and some key price zones are starting to stand out:
🔹 S1 / R1 Zone: Started as support in week 0 (pre-TGE), flipped to resistance in week 1, and has remained resistance ever since.
🔹 R2 / S2 Zone: Started as resistance in week 1, flipped to support, and continues to hold.
🔹 S3 Zone: Acted as support only during week 1.
Right now, price is finding support at the S2 zone, after making a higher high above R1 last week. The recent 25% drop came with the broader crypto liquidation event early Monday, one of the largest in months. But here’s what stands out: selling volume wasn’t as heavy as week 1, suggesting sellers aren’t pushing as aggressively.
From a system perspective:
✅ Price is now above the pink SMA, orange BB center, and blue MLR → signs of leveling out.
⚠️ Price is still under the PSAR and the cyan 50MA → technically still in a downtrend.
I can’t predict what happens next, but I can prepare for scenarios.
🎯My focus: this looks like a good area to scale in, but risk management is key: if price loses S2, I’ll start scaling out to derisk and avoid liquidation.
Fundamentals Back the Case:
WLFI’s roadmap is getting stronger:
• USD1 stablecoin adoption is accelerating
• App launch + debit card are near
• Community engagement & governance are growing
🎯 My Plan:
Yes, this is an area where I scale in, but with strict risk management.
If price loses S2, I scale out to de-risk.
🔥 Conclusion:
This is where TA meets fundamentals.
If WLFI holds S2, the setup could become explosive.
Respect your risk and let the chart tell the story.
Always take profits and manage risk.
Interaction is welcome.
WLFI (SIGNAL)
Hello friends
Regarding the price flooring in the specified support area and the creation of higher floors, it can be said that if the specified resistance is broken, the price can move to the specified targets.
*Trade safely with us*
