WLFI has potential for at least 35% gain to 0.19$Hi the support and resistances on the chart are based on the previous data and weekly candlesticks if BINANCE:WLFIUSDT holds this last support the potential of 35% gain is logical toward 0.19$
Wlfiusd

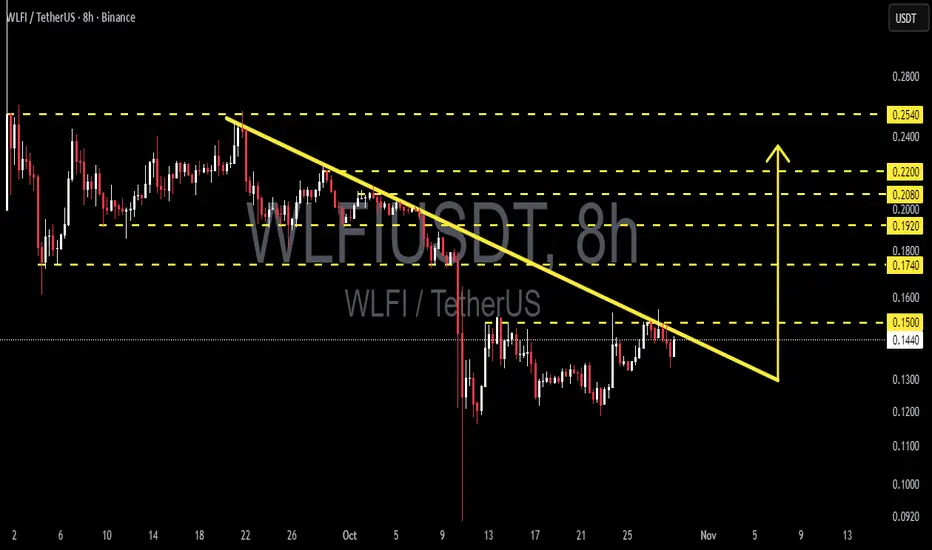
WLFI/USDT — Ready to Explode from Final Consolidation Zone?After weeks of staying under heavy selling pressure within a descending trendline, WLFI is finally showing early signs of life around the 0.13–0.14 demand zone.
The current structure indicates a phase of capitulation followed by silent accumulation, where sellers are losing strength while smart money gradually steps in.
A clear series of lower highs has formed since early October, pressing the price down under a strong descending resistance line (yellow) — and now, price is testing that barrier once again.
A confirmed breakout from this line could mark the beginning of a mid-term trend reversal.
---
Pattern Structure
The chart reveals a descending triangle pattern that’s losing momentum, combined with a potential double-bottom formation near 0.13.
If WLFI manages to break and close above the yellow trendline with solid 8H candle confirmation, the market could shift decisively to bullish territory.
---
Bullish Scenario
If price successfully breaks and closes above 0.1500, momentum will flip in favor of the bulls.
A confirmed breakout could unlock the next targets:
0.1740 – 0.1800 → first breakout zone,
0.1920 – 0.2000 → medium-term expansion area,
0.2200 – 0.2540 → final swing target zone.
Additional confirmation signals:
Rising breakout volume,
8H or daily candle closing firmly above trendline,
RSI & MACD showing early bullish crossover from neutral zone.
This scenario could signal the end of accumulation and the start of a new impulsive wave.
---
Bearish Scenario
If price fails to break the descending line and gets rejected again, the 0.13–0.12 zone becomes the last defense for bulls.
A breakdown below 0.1200 would re-confirm bearish control, targeting:
0.10 as the next liquidity pool,
and possibly 0.0920 if another liquidation spike occurs.
Rejection at the trendline would reinforce seller dominance and continue the broader downtrend until a new higher low forms.
---
Technical Conclusion
WLFI is standing at a make-or-break level, where just one decisive candle can flip the entire structure from bearish to bullish.
This setup is ideal for position traders seeking early accumulation before full breakout confirmation.
However — caution is key.
A breakout without volume is a trap, and a breakdown without confirmation could be a fakeout.
Watch the price reaction closely around the descending trendline, as this is where the next major move will be defined.
---
#WLFI #WLFIUSDT #CryptoBreakout #TrendlineResistance #CryptoAnalysis #ChartPattern #TechnicalAnalysis #CryptoTrading #AltcoinSetup #SwingTrade #SupportResistance #MarketStructure
WLFI (SIGNAL)
Hello friends
Regarding the price flooring in the specified support area and the creation of higher floors, it can be said that if the specified resistance is broken, the price can move to the specified targets.
*Trade safely with us*

WLFI/USDT — Ascending Triangle Pressing: Major Breakout?📊 Full Analysis
The WLFI/USDT pair on the 4-hour timeframe is forming a clear Ascending Triangle pattern:
A strong horizontal resistance around 0.2410, repeatedly tested but not yet broken.
Higher Lows along the ascending trendline (yellow) show growing buyer strength and continuous accumulation.
This structure is a classic bullish continuation pattern, signaling that the market is building momentum for a potential breakout.
Still, crypto markets are never one-sided. Failure to break higher could lead to a sharp rejection or even a breakdown.
---
🟢 Bullish Scenario
1. A valid breakout occurs if the 4H candle closes above 0.2410–0.245 with strong volume.
2. If confirmed, upside targets based on the measured move are:
Conservative target: 0.28 – 0.30
Full measured move: 0.30 – 0.32
3. Watch for a possible retest of 0.241 as new support. A successful retest bounce would reinforce bullish continuation.
---
🔴 Bearish Scenario
1. If the price fails to break 0.2410, a rejection may send it back toward the ascending trendline support.
2. A confirmed breakdown below 0.225–0.228 invalidates the ascending triangle.
3. Bearish downside levels to watch:
First support zone: 0.20
Major support: 0.161 (previous significant low).
---
🎯 Key Levels
Resistance zone: 0.2410 – 0.245
Dynamic trendline support: 0.225 – 0.228
Next supports: 0.20 → 0.161
Bullish targets: 0.28 – 0.32
---
⚖️ Conclusion
WLFI/USDT is at a critical crossroads. The Ascending Triangle signals that buyers are steadily pressuring resistance. A confirmed breakout above 0.2410 with volume could unlock the path toward 0.30–0.32.
However, failure at resistance combined with a trendline breakdown could trigger a correction back to 0.20 or even 0.161.
Best strategy: wait for confirmation (breakout or breakdown), manage risk carefully, and scale out profits at key target levels.
---
#WLFI #WLFIUSDT #Crypto #Altcoin #AscendingTriangle #ChartPattern #Breakout #Bullish #Bearish #SupportResistance #PriceAction #TechnicalAnalysis

Play the LONGTERM GAME with $WLFIPlay the LONGTERM GAME with TSXV:WLF
Remember that $TRUMP did 17x
$WLFI is going to 20usd - that's 92X
STOP SHORTING TODAY
Think LONGTERM

WORLD LIBERTY FINANCE HAS LAUNCHED!Will it kick off this Bull market into hyperdrive?
Here are the Fib extensions based on the Futures price action so far.
Can it break a dollar?
Has it cemented #ETHEREUM as the dominant layer 1 for serious money?
Whilst relegating #SOLANA to gen Z high speed casino?
We shall find out in the coming 6 months.
