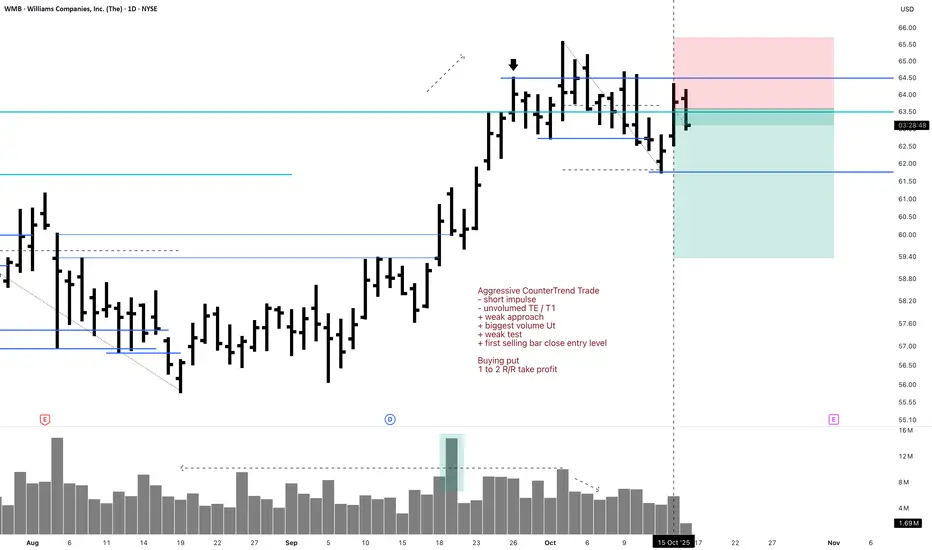
WMB 1D Short Aggressive CounterTrend Trade (Put Buy to Open)Aggressive CounterTrend Trade
- short impulse
- unvolumed TE / T1
+ weak approach
+ biggest volume Ut
+ weak test
+ first selling bar close entry level
Buying put
1 to 2 R/R take profit
Monthly CounterTrend
"- short balance
+ volumed expanding CREEK
+ resistance level
= wrong volume distribution weak approach"
Yearly CounterTrend
"- short balance
+ volumed expanding CREEK
+ resistance level
= wrong volume distribution weak approach"
WMB
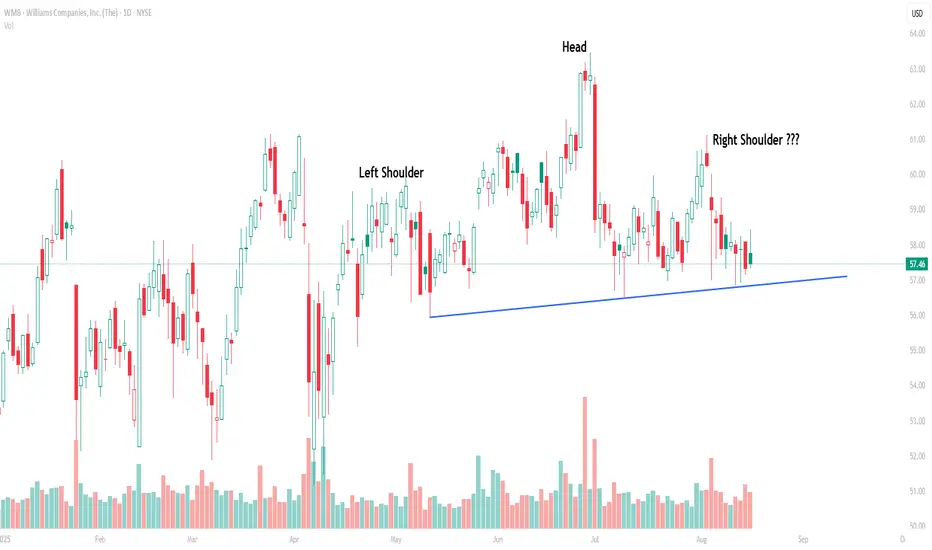
Pattern Decoded: WMB’s Potential Head & Shoulders in the MakingKey Note: Let’s keep it straight — until the neckline breaks, this remains a potential Head
& Shoulders (H&S), not a confirmed one. A close below $56.5 on strong volume would
be the real confirmation trigger.
Currently, WMB is sketching what looks like a bearish Head & Shoulders pattern. The
left shoulder was formed in April near $60, the head at the June peak around $63 and the
right shoulder is emerging with the recent rally stalling back at $60. The neckline aligns
with the rising trendline support around $57, which has been repeatedly tested.
If the neckline gives way, the breakdown completes the bearish setup, with a measured
downside projection of roughly $50, based on the head-to-neckline height. Until then,
this remains just a developing structure rather than a done deal.
WMB - Breakout StructureWMB has reached the top of a down channel at this point it will either break out or break down
I am favouring a break out due to the larger structure on the weekly chart which you can see for yourselves if watching this ticker.
Diagonal double bottom along the thin green line allows for a breakout of the entire down channel.
This double bottom is also supported by the dotted line which can be seen as a strong support line.

Long ETEKelsey Warren got em' this time. WMB is in trouble in their merger agreement and I think ETE will come out on top with this merger deal.
$18-20 target.
