Is Walmart Setting Up for a Bullish Momentum Shift?🛒 WMT: Walmart’s Wealth Heist Strategy 🚀 (Swing/Day Trade)
Asset: Walmart, Inc. (WMT)
Market: US Equities (not Forex, as WMT is a stock, not a currency pair! 😉)
Vibe: Bullish Breakout with a Thief Strategy twist! 🕵️♂️
📈 The Plan: Steal the Breakout! 💥
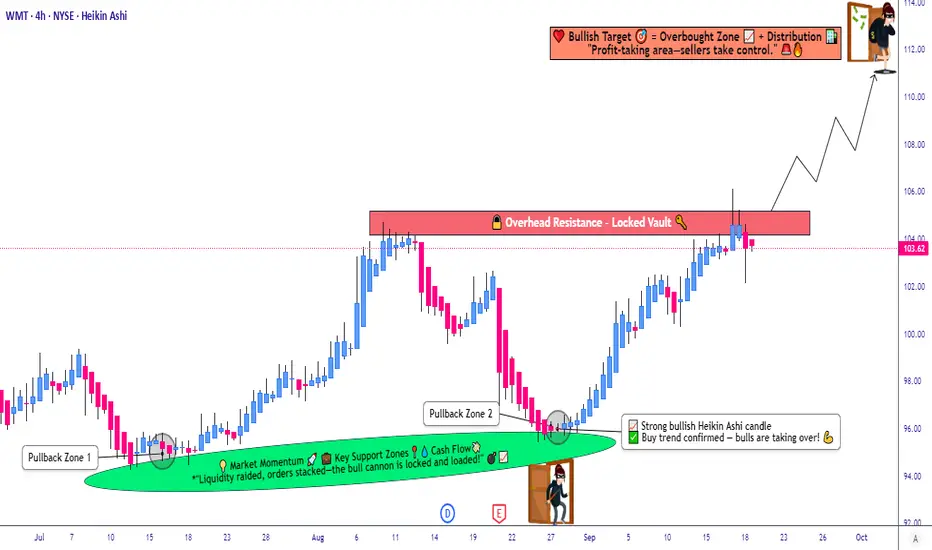
WMT is gearing up for a bullish breakout at $105.00!
🎯 For confirmation, we need a 4-hour candle close above the resistance level at $105.00 to lock in that buy signal. No sneaky moves before confirmation, or you’re gambling with your loot! 😎
🕵️♂️ Thief Strategy: Layered Limit Orders
This is where the Thief Strategy shines! 🌟 Instead of jumping in with one big order, we’re setting multiple buy limit orders to stack the deck in our favor:
$102.00
$103.00
$104.00
$105.00
$106.00
Pro Tip: Feel free to add more layers based on your risk appetite, but only place these limit orders after the breakout is confirmed (4H candle close above $105.00).
Setting layers blindly is like robbing a bank without a getaway car—risky business! 🚨
🛑 Stop Loss: Protect Your Stash
Set your stop loss at $101.00.
Note: Dear Thief OGs (Ladies & Gentlemen of the charts), this is my suggested SL, but it’s your heist, your rules! Adjust based on your risk tolerance. 💸
🎯 Take Profit: Cash Out Like a Pro
Our target is $112.00, where we expect strong resistance and potential overbought conditions. Watch out for a possible trap at this level—grab your profits and escape before the market pulls a fast one!
😈Note: This is my recommended TP, but you’re the boss of your trades. Take profits at your own discretion and keep the cash flowin’! 💰
🔗 Related Pairs to Watch (Correlations & Key Points)
Since WMT is a retail giant, its price action often correlates with consumer discretionary and retail sector stocks. Keep an eye on these related assets (all priced in USD):
NYSE:TGT (Target Corporation): Another retail titan. If WMT breaks out, TGT often follows the consumer spending vibe. 📊
NASDAQ:COST (Costco Wholesale): Big-box retail cousin. Strong correlation with WMT due to similar market dynamics. 🏬
AMEX:XRT (SPDR S&P Retail ETF): Tracks the broader retail sector. A bullish WMT could signal strength in XRT. 📈
Key Correlation Insight: WMT’s performance is tied to consumer confidence and economic data (e.g., retail sales, consumer price index). If these indicators are strong, expect WMT and related stocks to rally. Conversely, weak data could stall the breakout. Always check the economic calendar! 🗓️
📝 Final Notes for the Heist
Confirmation is King: Don’t set your layered limit orders until the 4H candle confirms the breakout above $105.00. Patience pays! ⏳
Risk Management: The Thief Strategy is slick, but don’t get greedy. Stick to your risk-reward ratio and protect your capital. 💼
Market Context: Watch for broader market sentiment (S&P 500, consumer sentiment reports) to support WMT’s bullish move. 🌍
✨ “If you find value in my analysis, a 👍 and 🚀 boost is much appreciated — it helps me share more setups with the community!”
Disclaimer: This Thief Style trading strategy is just for fun! Trade at your own risk and always do your own research. 😜
#Hashtags: #WMT #StockMarket #SwingTrading #DayTrading #ThiefStrategy #BullishBreakout #TechnicalAnalysis #TradingIdeas
Wmtbuy
$WMT #WMT attention shoppers line followers make money Very simple way to make sure profit on this huge box filled with Chinese garbage
Am buyer on #daily trimmed by 11 Am , wait to load afterhours for overnight #trade

$WMT Outperforms $SPY and $XLP: A Weekly Comparative AnalysisDetails:
Walmart ( NYSE:WMT ): Over the weekly time frame, Walmart saw an impressive gain of 22.51%, highlighting a strong trend in its stock performance.
S&P 500 ( AMEX:SPY ) : This ETF tracks the S&P 500 Index, a benchmark for 500 of the largest companies in the U.S. stock market. During the same period, AMEX:SPY recorded a gain of 16.17%.
Consumer Staples ( AMEX:XLP ): AMEX:XLP represents the Consumer Staples sector of the S&P 500, focusing on necessities like food, beverages, and household goods. It rose 15.61% in the weekly time frame.
Comparative Analysis:
NYSE:WMT vs. AMEX:SPY : Walmart outperformed the broader market ( AMEX:SPY ) by 6.34%.
NYSE:WMT vs. AMEX:XLP : Walmart's growth outshines the Consumer Staples sector ( AMEX:XLP ) by 6.90%.
Technical Indicators:
50-Day Exponential Moving Average (EMA): At present, NYSE:WMT is trading above its 50-day EMA, located around the $156.00 price mark. This divergence from the mean value might point to an overextension, particularly since the stock has reached all-time highs for the past five consecutive days.
Bollinger Bands & RSI: Walmart's stock is brushing against the upper Bollinger Band, hinting at possible overbought conditions. This is further corroborated by an RSI nearing 70, signaling that a pullback might be on the horizon.
Conclusion:
The combination of strong weekly gains and the current technical indicators presents a complex picture for $WMT. While the stock's performance has been robust, some signs point to potential overextension. Investors and traders must weigh these factors carefully and consider their strategies accordingly. The data and analysis presented here serve as valuable tools for understanding the stock's dynamics and planning future moves.


Walmart in a bullish channel.Walmart - 30d expiry - We look to Buy at 154.33 (stop at 150.33)
Price action continues to trade around the all-time highs.
Trading within a Bullish Channel formation.
We look to buy dips.
The primary trend remains bullish.
Trend line support is located at 154.
This stock has seen good sales growth.
Our profit targets will be 164.33 and 166.33
Resistance: 159.50 / 161.00 / 163.00
Support: 157.50 / 155.00 / 154.00
Please be advised that the information presented on TradingView is provided to Vantage (‘Vantage Global Limited’, ‘we’) by a third-party provider (‘Everest Fortune Group’). Please be reminded that you are solely responsible for the trading decisions on your account. There is a very high degree of risk involved in trading. Any information and/or content is intended entirely for research, educational and informational purposes only and does not constitute investment or consultation advice or investment strategy. The information is not tailored to the investment needs of any specific person and therefore does not involve a consideration of any of the investment objectives, financial situation or needs of any viewer that may receive it. Kindly also note that past performance is not a reliable indicator of future results. Actual results may differ materially from those anticipated in forward-looking or past performance statements. We assume no liability as to the accuracy or completeness of any of the information and/or content provided herein and the Company cannot be held responsible for any omission, mistake nor for any loss or damage including without limitation to any loss of profit which may arise from reliance on any information supplied by Everest Fortune Group.

Walmart support could prove difficult to breakdown.Walmart - 30d expiry - We look to Buy at 138.44 (stop at 133.86)
Levels below 138 continue to attract buyers.
The medium term bias is neutral.
138.27 has been pivotal.
Preferred trade is to buy on dips.
The stock is currently outperforming in its sector.
Support could prove difficult to breakdown.
Our profit targets will be 149.88 and 152.88
Resistance: 142.00 / 145.61 / 147.86
Support: 138.17 / 135.00 / 130.00
Please be advised that the information presented on TradingView is provided to Vantage (‘Vantage Global Limited’, ‘we’) by a third-party provider (‘Signal Centre’). Please be reminded that you are solely responsible for the trading decisions on your account. There is a very high degree of risk involved in trading. Any information and/or content is intended entirely for research, educational and informational purposes only and does not constitute investment or consultation advice or investment strategy. The information is not tailored to the investment needs of any specific person and therefore does not involve a consideration of any of the investment objectives, financial situation or needs of any viewer that may receive it. Kindly also note that past performance is not a reliable indicator of future results. Actual results may differ materially from those anticipated in forward-looking or past performance statements. We assume no liability as to the accuracy or completeness of any of the information and/or content provided herein and the Company cannot be held responsible for any omission, mistake nor for any loss or damage including without limitation to any loss of profit which may arise from reliance on any information supplied by Signal Centre.

Walmart WMT Trade setup for 31-August-2022 Walmart(WMT) is in a no trade zone. We need to wait for the stock to show us some direction.
The trend based on the last 2 months shows upside, but the way the stock has fallen into the support area(130-133) doesnt look good.
If the stock moves above 133, we can go long with a price target of 143 and a stop loss of 130.
If the stock moves lower than 130, we can go short witht h price target of 124 and a stop at 133.

$WMT 1D BUY SETUP ANALYSIS +10% MOVE!$WMT is reporting earnings this week and we are looking to buy and hold! There is a gap to be filled @$147.50 area! This move is an easy +10% trade. Wait for confirmation set parameters and let the trend & volume accumulate!

WMT-BUY strategyWe are basing well and we are slowly starting to go higher.
The GANN Fan resistance which coincides with FIB. is near $ 128.00. I would suggest take profit on longs near that area, and perhaps $ 126.75 - 127.25.

Walmart Analysis - BullsAn Analysis showing two periods one of stagnant sideways movement and one of large growth
The first led to a 600% gain, if repeated a 600% up move puts WMT at 262

WMT - STOCKS - 27. OCT. 2021Welcome to our Weekly V2-Trade Setup ( WMT ) !
-
4 HOUR
Bullish turnover and break above main sr level.
DAILY
Looking for more bullish pa!
WEEKLY
Great market structure..
-
STOCK SETUP
BUY WMT
ENTRY LEVEL @ 147.82
SL @ 139.80
TP @ Open
Max Risk: 0.5% - 1%!
(Remember to add a few pips to all levels - different Brokers!)
Leave us a comment or like to keep our content for free and alive.
Have a great week everyone!
ALAN


WMT - BOUNCE OF DEMAND ZONEWMT hit and bounced where we found a demand zone now should head higher to the trend line resistance
1) Break trend line resistance and make it to 145 for a gap fil
2) Reject the trend line resistance and bounce back down

WMT - 4HR SUPPLY AND DEMANDWhenever the WMT hit my demand lines it went up while when it hit my supply lines it went down

WMT Breaking outWMT has dropped below the 200 MA and now price has met support andraised up through the 20 day average indicating a a change in direction. Previous high is price target


Walmart is expected to make big move post earnings $WMT BullishThis is a very easy long. Walmart ($WMT) like Dominoes ($DPZ) did not experience any major dump when the markets crashed and it was one of the first to rally. $WMT was sold off and money flowed out of $WMT into stocks that were crushed in May and June, $WMT consequently dropped below $120. It snapped back above $120 on the announcement of Walmart plus and retested above $130 and FOMO buying came aboard. After a bit of correction, it is expected to break out of its previous top and make new highs on strong earnings. There was no post dividend dump. $140 is an easily reachable target post earnings.

WALMART INC LONG📈WMT LONG D1
🛒BUY above = 131.85
🎯Target1 = 134.50
🎯Target2 = 138.80
🛑Stop loss or cancel trade = 127.50
🙈Risk = (3%-5%)
#WMT #WMTLONG #BUYWMT

WALMART INC. (WMT) DailyDates in the future with the highest probability for price direction reversals

Walmart Bull + $85 TargetWalmart's earning reports are due within a week and they are coming up as close competitors to Amazon. They recently acquired Flipkart in a needy but brilliant move to try taking more control in the emerging e-commerce market. Given that they were positively skewed to the left and are now facing a negative correlation, it may not look good. However, the recent acquisition of Flipkart, the market share they already owned in the retail industry and the fact that many of their retail competitors are losing ground looks like positive market potential. However, some analyst could claim these as assumptions or informational bias in looking at the outcome of the data. That being said, given the recent trend-lines in price with medium risk, an $85 short call seems imminent and highly likely.

