Is Walmart Setting Up for a Bullish Momentum Shift?🛒 WMT: Walmart’s Wealth Heist Strategy 🚀 (Swing/Day Trade)
Asset: Walmart, Inc. (WMT)
Market: US Equities (not Forex, as WMT is a stock, not a currency pair! 😉)
Vibe: Bullish Breakout with a Thief Strategy twist! 🕵️♂️
📈 The Plan: Steal the Breakout! 💥
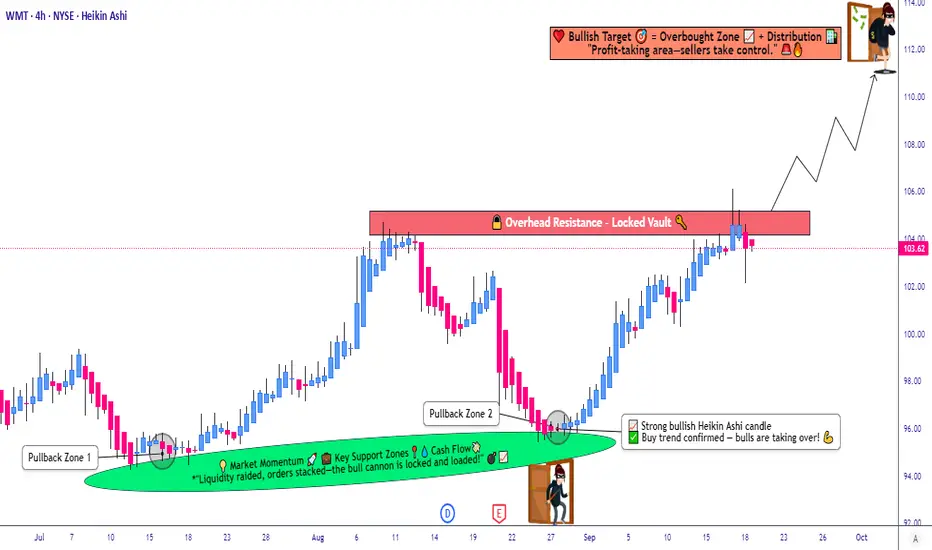
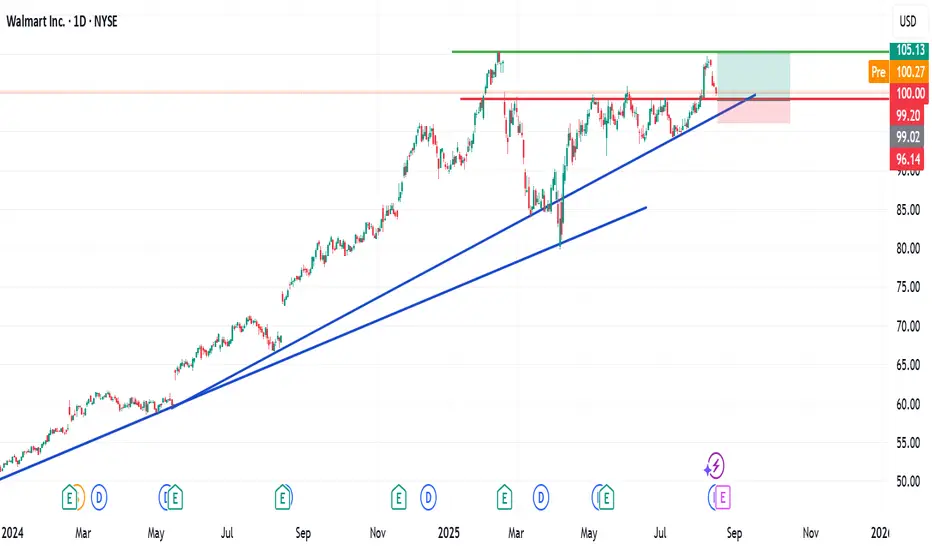
WMT is gearing up for a bullish breakout at $105.00!
🎯 For confirmation, we need a 4-hour candle close above the resistance level at $105.00 to lock in that buy signal. No sneaky moves before confirmation, or you’re gambling with your loot! 😎
🕵️♂️ Thief Strategy: Layered Limit Orders
This is where the Thief Strategy shines! 🌟 Instead of jumping in with one big order, we’re setting multiple buy limit orders to stack the deck in our favor:
$102.00
$103.00
$104.00
$105.00
$106.00
Pro Tip: Feel free to add more layers based on your risk appetite, but only place these limit orders after the breakout is confirmed (4H candle close above $105.00).
Setting layers blindly is like robbing a bank without a getaway car—risky business! 🚨
🛑 Stop Loss: Protect Your Stash
Set your stop loss at $101.00.
Note: Dear Thief OGs (Ladies & Gentlemen of the charts), this is my suggested SL, but it’s your heist, your rules! Adjust based on your risk tolerance. 💸
🎯 Take Profit: Cash Out Like a Pro
Our target is $112.00, where we expect strong resistance and potential overbought conditions. Watch out for a possible trap at this level—grab your profits and escape before the market pulls a fast one!
😈Note: This is my recommended TP, but you’re the boss of your trades. Take profits at your own discretion and keep the cash flowin’! 💰
🔗 Related Pairs to Watch (Correlations & Key Points)
Since WMT is a retail giant, its price action often correlates with consumer discretionary and retail sector stocks. Keep an eye on these related assets (all priced in USD):
NYSE:TGT (Target Corporation): Another retail titan. If WMT breaks out, TGT often follows the consumer spending vibe. 📊
NASDAQ:COST (Costco Wholesale): Big-box retail cousin. Strong correlation with WMT due to similar market dynamics. 🏬
AMEX:XRT (SPDR S&P Retail ETF): Tracks the broader retail sector. A bullish WMT could signal strength in XRT. 📈
Key Correlation Insight: WMT’s performance is tied to consumer confidence and economic data (e.g., retail sales, consumer price index). If these indicators are strong, expect WMT and related stocks to rally. Conversely, weak data could stall the breakout. Always check the economic calendar! 🗓️
📝 Final Notes for the Heist
Confirmation is King: Don’t set your layered limit orders until the 4H candle confirms the breakout above $105.00. Patience pays! ⏳
Risk Management: The Thief Strategy is slick, but don’t get greedy. Stick to your risk-reward ratio and protect your capital. 💼
Market Context: Watch for broader market sentiment (S&P 500, consumer sentiment reports) to support WMT’s bullish move. 🌍
✨ “If you find value in my analysis, a 👍 and 🚀 boost is much appreciated — it helps me share more setups with the community!”
Disclaimer: This Thief Style trading strategy is just for fun! Trade at your own risk and always do your own research. 😜
#Hashtags: #WMT #StockMarket #SwingTrading #DayTrading #ThiefStrategy #BullishBreakout #TechnicalAnalysis #TradingIdeas
Wmtlong
WMT - Our profit target is near, secure some profitsWhen I posted the long trade on Aug. 29th, I did not expect it to run that quick.
Who of you guys or gals pushed it that quick? §8-)
However, I will trail my stop below the last red candles low.
We are not here to win a contest, so we secure some profit, just in case price drops before the Centerline is reached.
Don't forget to follow me and profit from further trades and educational content.

WMT ran into a buyers zone. A nice Long opportunityOn the daily time-frame we see WMT running into the old buyers zone and stopping dead, instead of breaking through it.
It's exactly where the 1/4 line is.
So, if price can't get to the L-MLH, we have a "potential" Hagopian at hand. And that tells us, price will go more in the opposite direction than from where price came - which was the Center-Line.
Additionally, Friday closed higher than the high day a day prior. This is also proper momentum long signal, and because we have a decent Risk-Reward.
A couple facts coming together, which is a clear must take signal to me.
Happy Monday folks - another day in paradise §8-)

My 5% upside for WalmartMy 5% upside for Walmart.
There is a likely chance that WMT may push up from this psychological $100 zone. If this happens, we may see a 5% upside as shown on my chart with a risk-reward ratio of 1:2.1.
If it, however, drops further to the trend line, I will buy more using DCA and aim for 7% TP.
Trade with care
WMT Showing Bullish Momentum – Move Toward $99.00 ExpectedNYSE:WMT is demonstrating strong bullish momentum, driven by consistent price strength and support from key moving averages. The recent price action confirms buyers' dominance, with a clear uptrend evident on the chart. The stock has advanced steadily, breaking out of prior consolidation zones, and is now poised to target the $99.00 level, which serves as the next significant milestone.
This setup aligns with the expectation of a bullish continuation, offering a potential long opportunity if pullbacks or consolidations occur near current levels.
If you agree with this analysis or have additional insights, feel free to share your thoughts here!


Walmart in a bullish channel.Walmart - 30d expiry - We look to Buy at 154.33 (stop at 150.33)
Price action continues to trade around the all-time highs.
Trading within a Bullish Channel formation.
We look to buy dips.
The primary trend remains bullish.
Trend line support is located at 154.
This stock has seen good sales growth.
Our profit targets will be 164.33 and 166.33
Resistance: 159.50 / 161.00 / 163.00
Support: 157.50 / 155.00 / 154.00
Please be advised that the information presented on TradingView is provided to Vantage (‘Vantage Global Limited’, ‘we’) by a third-party provider (‘Everest Fortune Group’). Please be reminded that you are solely responsible for the trading decisions on your account. There is a very high degree of risk involved in trading. Any information and/or content is intended entirely for research, educational and informational purposes only and does not constitute investment or consultation advice or investment strategy. The information is not tailored to the investment needs of any specific person and therefore does not involve a consideration of any of the investment objectives, financial situation or needs of any viewer that may receive it. Kindly also note that past performance is not a reliable indicator of future results. Actual results may differ materially from those anticipated in forward-looking or past performance statements. We assume no liability as to the accuracy or completeness of any of the information and/or content provided herein and the Company cannot be held responsible for any omission, mistake nor for any loss or damage including without limitation to any loss of profit which may arise from reliance on any information supplied by Everest Fortune Group.

WMT symmetrical triangleWhat we can see on the chart is the symmetrical triangle which is neutral formation therefore we should wait with taking position as it may breakout to the upside or to the downside.
How to trade:
Enter long or short position once the price breakout of the triangle.
Targets for longs and shorts are shown on the chart.
In order to avoid trading the fake breakout, look for a volume surge.
Good luck

Walmart primary trend remains bullish.Walmart - 24h expiry - We look to Buy at 139.11 (stop at 134.61)
Levels below 140 continue to attract buyers.
The primary trend remains bullish.
This stock has seen good sales growth.
Preferred trade is to buy on dips.
A higher correction is expected.
Our profit targets will be 150.11 and 152.11
Resistance: 150.00 / 151.12 / 153.00
Support: 148.15 / 147.00 / 145.00
Please be advised that the information presented on TradingView is provided to Vantage (‘Vantage Global Limited’, ‘we’) by a third-party provider (‘Signal Centre’). Please be reminded that you are solely responsible for the trading decisions on your account. There is a very high degree of risk involved in trading. Any information and/or content is intended entirely for research, educational and informational purposes only and does not constitute investment or consultation advice or investment strategy. The information is not tailored to the investment needs of any specific person and therefore does not involve a consideration of any of the investment objectives, financial situation or needs of any viewer that may receive it. Kindly also note that past performance is not a reliable indicator of future results. Actual results may differ materially from those anticipated in forward-looking or past performance statements. We assume no liability as to the accuracy or completeness of any of the information and/or content provided herein and the Company cannot be held responsible for any omission, mistake nor for any loss or damage including without limitation to any loss of profit which may arise from reliance on any information supplied by Signal Centre.

Walmart (WMT) Has A Falling Wedge!Wal-Mart (WMT) has a falling wedge on the daily timeframe. The stock closed above the 200MDA 2 days in a row (last Thursday and Friday)! On the second day it also closed above the 50MDA! Last but not least, the second day closed with more buying volume and pressure than the day prior. Also, the upper trend line of the falling wedge pattern, was touched three times! Therefore, the aforementioned confluences are strong signals for price to increase over the next few weeks.
Harmony,
MrALtrades00
*This is not financial advice.

Waste Managment to break from a range.Waste Management, Inc - 30d expiry - We look to Buy a break of 155.81 (stop at 152.21)
The primary trend remains bullish.
Price action continued to range between key support & resistanc
ence for trading is higher highs and lows.
A break of the recent high at 155.49 should result in a further move higher.
This is curremtly an actively traded stock.
Our profit targets will be 164.81 and 165.81
Resistance: 153.50 / 155.66 / 160.00
Support: 150.00 / 148.55 / 145.00
Please be advised that the information presented on TradingView is provided to Vantage (‘Vantage Global Limited’, ‘we’) by a third-party provider (‘Signal Centre’). Please be reminded that you are solely responsible for the trading decisions on your account. There is a very high degree of risk involved in trading. Any information and/or content is intended entirely for research, educational and informational purposes only and does not constitute investment or consultation advice or investment strategy. The information is not tailored to the investment needs of any specific person and therefore does not involve a consideration of any of the investment objectives, financial situation or needs of any viewer that may receive it. Kindly also note that past performance is not a reliable indicator of future results. Actual results may differ materially from those anticipated in forward-looking or past performance statements. We assume no liability as to the accuracy or completeness of any of the information and/or content provided herein and the Company cannot be held responsible for any omission, mistake nor for any loss or damage including without limitation to any loss of profit which may arise from reliance on any information supplied by Signal Centre.


$WMT break out with a 2-2u continuation$WMT Trade Idea
Calls over $146.12
Target $146.42, $147.86
Puts under $144.51
Target $143.72(gap fill)

Walmart support could prove difficult to breakdown.Walmart - 30d expiry - We look to Buy at 138.44 (stop at 133.86)
Levels below 138 continue to attract buyers.
The medium term bias is neutral.
138.27 has been pivotal.
Preferred trade is to buy on dips.
The stock is currently outperforming in its sector.
Support could prove difficult to breakdown.
Our profit targets will be 149.88 and 152.88
Resistance: 142.00 / 145.61 / 147.86
Support: 138.17 / 135.00 / 130.00
Please be advised that the information presented on TradingView is provided to Vantage (‘Vantage Global Limited’, ‘we’) by a third-party provider (‘Signal Centre’). Please be reminded that you are solely responsible for the trading decisions on your account. There is a very high degree of risk involved in trading. Any information and/or content is intended entirely for research, educational and informational purposes only and does not constitute investment or consultation advice or investment strategy. The information is not tailored to the investment needs of any specific person and therefore does not involve a consideration of any of the investment objectives, financial situation or needs of any viewer that may receive it. Kindly also note that past performance is not a reliable indicator of future results. Actual results may differ materially from those anticipated in forward-looking or past performance statements. We assume no liability as to the accuracy or completeness of any of the information and/or content provided herein and the Company cannot be held responsible for any omission, mistake nor for any loss or damage including without limitation to any loss of profit which may arise from reliance on any information supplied by Signal Centre.

WMT Walmart Inc. Options After The EarningsLooking at the WMT Walmart Inc. options chain after the earnings, i would buy the $145 strike price Puts with
2023-1-20 expiration date for about
$3.65 premium.
If the options turn out to be profitable Before the earnings release, i would sell at least 50%.
Looking forward to read your opinion about it.

#Long WMTSymmetric triangle found with breakout from top
TP set as per back of the triangle
SL set below the bottom slope


Wal-Mart (WMT) Appears Prime for a Run to the Upside!Wal-Mart Appears Prime for a Run to the Upside!
Patterns Identified- ABCD and an Inverse head & shoulders pattern on Wal-Mart's (WMT) daily chart!
I expect a break of the neckline over the next few sessions. We popped above the trendline today and came back inside the triangle. Also we closed slightly below the zone (see screenshot below).
My next entry on Wal-Mart will be above 135 or after we break and hold above the upper trendline.
Short % of float 1.09 (as of October 1, 2022).
Bias-Bullish
Peace in Love,
MrALtrades00

Walmart WMT Trade setup for 31-August-2022 Walmart(WMT) is in a no trade zone. We need to wait for the stock to show us some direction.
The trend based on the last 2 months shows upside, but the way the stock has fallen into the support area(130-133) doesnt look good.
If the stock moves above 133, we can go long with a price target of 143 and a stop loss of 130.
If the stock moves lower than 130, we can go short witht h price target of 124 and a stop at 133.

2X $WMT TP1 HIT $7 MOVE FOR +5%!$WMT is reporting earnings this week and we are looking to buy and hold! There is a gap to be filled @$147.50 area! This move is an easy +10% trade. Wait for confirmation set parameters and let the trend & volume accumulate!

WMT long from key supportThere could be a good entry for long position, if the market gives an opportunity for buying at 117$. We expect the price to retest lows from June 2022 and hold the support.
If you want to short it, wait for rejection from the red line.

$WMT 1D BUY SETUP ANALYSIS +10% MOVE!$WMT is reporting earnings this week and we are looking to buy and hold! There is a gap to be filled @$147.50 area! This move is an easy +10% trade. Wait for confirmation set parameters and let the trend & volume accumulate!

Walmart Bottoms Relative to S&P 500This chart shows three things. First, the candles show how Walmart performs relative to the broader market (S&P 500 ETF - SPY). Second, it shows how that ratio changes as the unemployment rate goes up (light blue line). Third, it shows the 25-year support line of Walmart's relative performance to SPY (red line).
Notice how Walmart's relative performance goes down as the unemployment rate goes down, and goes up as the unemployment rate goes up. Walmart typically fares relatively better during economic downturns presumably because more people seek out bargain prices.
Also notice that, following its inflation warning, Walmart's performance relative to SPY is near its 25-year support line. One could reasonably argue a couple of things: (1) We are possibly near a bottom in terms of Walmart's underperformance to the S&P 500, and (2) If this correlation is predictive, the unemployment rate may soon start to rise.
Just remember that this is a relative chart, so it does not mean that the price of Walmart's stock will go up from here. It just means that Walmart may soon begin to shift from underperforming the broader market to outperforming (if the stock market is falling, then Walmart may fall too but by a lesser magnitude). This shift can take weeks to months, but once underway, can last for years.
While I am not providing financial advice, and encourage everyone to fully analyze the risks of their own trades, I am considering adding Walmart to my portfolio as a form of recession hedging. I am waiting for the possibility of Walmart to fall as much as 10% more in terms of its relative performance to the broader market (SPY), once it consolidates there I will likely begin accumulation. To read more about why I think a recession is coming you can click the link below in the related ideas section.
