WMT: Sell Zone is 164-168Walmart has been on a tear while the broader market has been correcting over the last few days. Walmart is in the heart of its 3rd wave right now, and my price targets for W-3 are 164-168. Once Walmart completes its W-5 up to the 172-175 region, it will experience a correction for about 4-8 weeks back down to the 150s.
Wmtlong

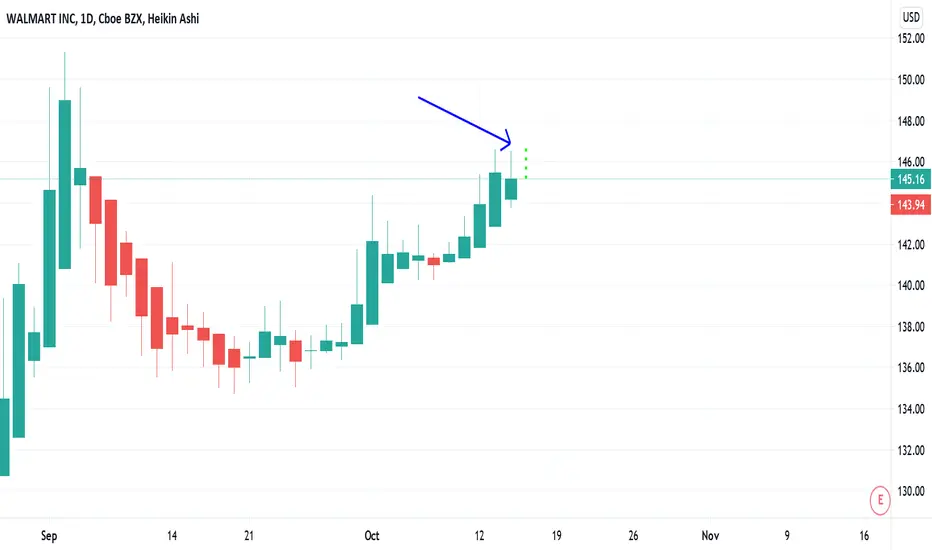
WMT - STOCKS - 27. OCT. 2021Welcome to our Weekly V2-Trade Setup ( WMT ) !
-
4 HOUR
Bullish turnover and break above main sr level.
DAILY
Looking for more bullish pa!
WEEKLY
Great market structure..
-
STOCK SETUP
BUY WMT
ENTRY LEVEL @ 147.82
SL @ 139.80
TP @ Open
Max Risk: 0.5% - 1%!
(Remember to add a few pips to all levels - different Brokers!)
Leave us a comment or like to keep our content for free and alive.
Have a great week everyone!
ALAN

WALMART WEEKLY LONG TERM ANALYSISTechnical Analysis Summary
WMT /USD
TREND ANALYSIS
We have 1 Downtrend in red color ( INTERNAL )
We have 2 uptrend in green color (Internal and External trends)
Be careful trends need to be modified when broken to the new peaks (downtrend) and lows (uptrend).
LEVELS OF SUPPORT
We have 1 weekly level of support which is essential to be respected for WMT to continue its move upward and its a great entry level.
Good luck everyone, stay safe!
If you need help don't hesitate to send me a message or comment
If you find this content beneficial please don't forget to LIKE and FOLLOW
Trading Involves High Risk
Not Financial Advice
Exercise Proper Risk Management

Walmart's Next Stop All Time HighsHello friends, today I am completing a technical analysis on the 1D linear scale chart for Walmart Inc. (WMT), a retail company traded on the NYSE.
In the chart I noted:
1) The WMT price has been moving in an ascending triangle since December 2020 with the first bottom trendline touch in March 2021. The bottom trendline has been respected two times with the second touch in October 2021.
2) The price is currently looking bullish based on a few indicators noted below. The price has potential to increase 5% or greater and make a new all time high.
3) The 21 Day EMA is hovering at the current price and the price is making an attempt to break it.
4) The Volume looks consistent with prior months.
5) The RSI is respecting the bottom trendline forming a Rising Wedge pattern. There is potential for the RSI to move higher as it recently completed a Double Bottom off of the bottom trendline.
6) The Stochastic RSI (Stoch RSI) is moving out of the oversold region with potential to create a double bottom or move directly higher. If it goes back down to create a double bottom, price may consolidate for a bit before moving higher.
7) The Money Flow Indicator recently exited the oversold region and headed higher. An example of the MFI reaching oversold region is shown in March 2021.
8) The Fibonacci extension showed the price recently re-tested the 0.382 level and currently entering the Golden Pocket (0.618-0.65).
What are your opinions on this?
If you enjoy my ideas, feel free to like it and drop in a comment. I love reading your comments below.
Disclosure: This is just my opinion and not any type of financial advice. I enjoy charting and discussing technical analysis. Don't trade based on my advice. Do your own research! #cryptopickk

WMT longEntry price: 144-145$
Target price: 150-151$
Stop loss: 142-143$
Bollinger bands: the price is approaching the lower band
Candle pattern: inverted hammer
Fibonacci retracement: the price is approaching 1 (144,43) level
Conclusions: Bollinger bands and candle pattern suggest a trend pullback. Moreover, the price is approaching the Fibonacci level, thus the long position is recommended with the stop loss under the resistance level.
No financial advice

$WMTWalmart’s earnings was spectacular. It reported an adjusted second-quarter profit of $1.78 a share, easily beating forecasts for $1.56, on sales of $141.05 billion, topping estimates for $136.88 billion. It offered full-year guidance of $6.20 to $6.35 a share, above the consensus for $6.02. Walmart said it’s taking share in groceries and that same-store sales rose every month during the quarter and yet it finished Tuesday, the day of the release, down slightly, and then fell 1.1% on Wednesday.
It closed the week at $151.45, roughly unchanged from where it had been before the release—and still below its November all-time high of $152.79.
When you look at the technical side of things, it looks like Walmart will eventually have its time soon.
Walmart’s in a nice clear uptrend on the weekly chart forming an ascending triangle with a double top.
Give this time with a to rest before it retests previous high but it’s very clear where this stock is heading.
I’m bullish.
- Factor Four


WMT - BOUNCE OF DEMAND ZONEWMT hit and bounced where we found a demand zone now should head higher to the trend line resistance
1) Break trend line resistance and make it to 145 for a gap fil
2) Reject the trend line resistance and bounce back down

Green light on WMT: fibo and trend linesWallMart can be a good candidate for a long position. I suppose it will touch again 131.30$ before shooting up to 139.50$.
On the next trading day (Monday the 15th of March), I will try to buy some stocks @131.30$: Stochastic RSI is in overbought area and RSI is ha three falling highs. My target is 139.50$ in profit and 126.20$ in loss.
The expected Win/Loss ratio of this trade is 1.60.


Price Trajectory for WMTWhere do you see WMT (a),(b), or (c). Or do you see something completely different? This prediction is open to new thoughts and opinions.
Knowing the profits, I know if it will be worth it to sell early in the short term and then swing trade to accumulate more options and therefore make even more money. I see WMT hitting an all time high in the near future.
Check out my included technical indicators to help you form your opinions, I have included Bollinger Bands, RSI, MACD, MA, and Divergence.

Daily Candlestick Prediction For WMTI love candles and based off my analysis this is where I see tomorrows candle for Walmart. I am 1 for 1 in my WMT candlestick analysis. Check out my previous prediction linked below and follow for daily updates!
Walmart (WMT) rounding out bottom on 65 min time frameLook to buy near the low range of the rounding formation that I drew. Also, there is horizontal support at $135 and horizontal resistance near $139. If it breaks out, it can make new highs again.

WMT Walmart looks like it is bottoming out. A trend continuation may be coming soon as Walmart looks to be bottoming out. A few more days of this rounding out formation and it should be good for a long. Also note the low volume pull back (not a lot of selling pressure).
I am not long WMT yet, just observing. Looking for an entry in mid $135 range. Support at $135 so stop loss would be around 134 to give it wiggle room. Minimum target would be near its short-term resistance right now around 138.80-140. However, a break out could send it back to new highs. The fundamentals also support a move higher.
- Andre, StockBros Research


Walmart is expected to make big move post earnings $WMT BullishThis is a very easy long. Walmart ($WMT) like Dominoes ($DPZ) did not experience any major dump when the markets crashed and it was one of the first to rally. $WMT was sold off and money flowed out of $WMT into stocks that were crushed in May and June, $WMT consequently dropped below $120. It snapped back above $120 on the announcement of Walmart plus and retested above $130 and FOMO buying came aboard. After a bit of correction, it is expected to break out of its previous top and make new highs on strong earnings. There was no post dividend dump. $140 is an easily reachable target post earnings.


WALMART INC LONG📈WMT LONG D1
🛒BUY above = 131.85
🎯Target1 = 134.50
🎯Target2 = 138.80
🛑Stop loss or cancel trade = 127.50
🙈Risk = (3%-5%)
#WMT #WMTLONG #BUYWMT

WMTThere might be a small pullback to the 200 ma then ready to take off and possibly breakout after earnings. Def. worth keeping an eye out. Long term bullish!

Bullflag Pattern on WMT Probably gonna Range till ERBullflag Pattern on WMT Probably gonna Range till ER
