🚨 WTI HIGH PROBABILITY SELL SETUP SOON 🚨🚨 WTI HIGH PROBABILITY SELL SETUP SOON 🚨
* Here we can see clearly the next potential moves for West Texas Intermediate Crude Oil, in coming days or week.
* Im thinking there might be a Down Trend Move happening FIRST to form the Inverse Head & Shoulder Reversal Pattern before the Huge Bullish Move to Up Trend.
* I've labelled where i can see the Inverse Head & Shoulder that MIGHT happen or not.
* I've got Multiple SELL trades to look at.
* First SELL position is going to be a quick SCALPING move to execute.
* EP(SELL): 70.263
* TP: 69.910
* No SL provided for this trade, use your own discretion.
* Nest EP(SELL) is for the Next potential Big Drop to form the Shoulder.
* EP(SELL): 69.623
* TP: 68.951
* TP2: 68.016.
* No SL provided for this trade, use your own discretion.
* Keep your eye close on your trading positions.
* Happy pip hunting traders.
* FXKILLA *
Wtishort

Short Crude Oil on ResistanceIn crude oil trading today, we made good profits in the trading strategy of shorting crude oil in the 70.6-70.8 area twice.
Judging from the current structural trend, crude oil will maintain range shocks in the short term, and fundamentally still maintain a short position. Although the inventory data has declined for two consecutive weeks, the pressure on the demand side is still very weak, and the U.S. dollar index has rebounded.Crude oil as a whole tends to run in a bearish trend. In terms of short-term structure, crude oil is currently facing the resistance of 71-71.2. If this area cannot be effectively broken through, then crude oil may still fall to the 69 position area at any time.
Therefore, before crude oil fails to break through the short-term resistance, it is mainly to short crude oil.
USOIL: @70.8-71 Sell, TP: 70.2
For more trading signals and trading plans, you can follow the bottom of the article to view the details!

WTI Crude Oil Sell TP = 42.67On the weekly chart, the trend started on March 13, 2022 (linear regression channel).
There is a high probability of profit, since the channel is not yet closed. A possible take profit level is 42.67 ( this is the minimum take profit value, but it has a high percentage of payoff ).
But don't forget about SL = 98 .
Using a trailing stop is also a good idea!
Please leave your feedback, your opinion. I am very interested in it. Thank you!
Good luck!
Regards, WeBelieveInTrading

WTI - Trade Setup Structure: Solid power move to the support zone aligned with the 200 MA Strateg
Trade: Short - A bounce back expected from this level
Risk/Reward: 1:2
Disclaimer: DYOR!

Petrol Breakdown analysis 28/03/2023Dear traders petrol was up trend and strong trend so he rejected previous weekly candle so it may consolidate a bit I expect petrol is he reache the key level of resistance zone it may be down so wait for price action to react and take the opportunity
TRADE SAFE

BREAKDOWN ANALYSIS PETROL 21/03/2023dear traders petrol trying to follow trend up so I expect petrol after bulk back in zone 66.92 it may be a chance to take a buy and if he breaks and close below 66.92 it will be high probability to sell ..follow my instructions and trade safe

wti.....h= Technical analysis of wti on the hourly chart
= The analysis is based on trend analysis and price behavior
= Now the price is moving casually in a dangerous area that is not suitable for trading. You must wait for it to cross this area to enter into a trade, and this will usually be done from below.

BREAKDOWN ANALYSIS PETROL 17/03/2023dear traders petrol was rejected from wekkly support it may correct this move ana retest previous ressistance
follow my chart and respect the zone of range price
trade safe

WTI BEARISH OUTLOOKWTI had fallen for 3 consecutive days in Wednesday. The bank crisis is calling banks to deleverage their positions, pulling back on their exposure on oil and causing the price to fall.
International Energy Agency (IEA) is also reporting that the current situation in the oil market is a situation of oversupply, while Russia is looking for buyers for its oil.
The price of WTI broke the support of the rising wedge pattern and continues to drop. Both MACD and RSI indicators are confirming the pattern as well.
If the current scenario continues, the price might reach levels of 62 or even 54.
In the opposite scenario the price might reach levels of 77.5 and pivot into an uptrend.
Risk Disclosure: Trading Foreign Exchange (Forex) and Contracts of Difference (CFD's) carries a high level of risk. By registering and signing up, any client affirms their understanding of their own personal accountability for all transactions performed within their account and recognizes the risks associated with trading on such markets and on such sites. Furthermore, one understands that the company carries zero influence over transactions, markets, and trading signals, therefore, cannot be held liable nor guarantee any profits or losses.

WTI : Short: I have set this sell limit based on my analysis of the market and trading strategy. Therefore, it is recommended that investors conduct their own research and due diligence before making any investment decisions.
Thank You

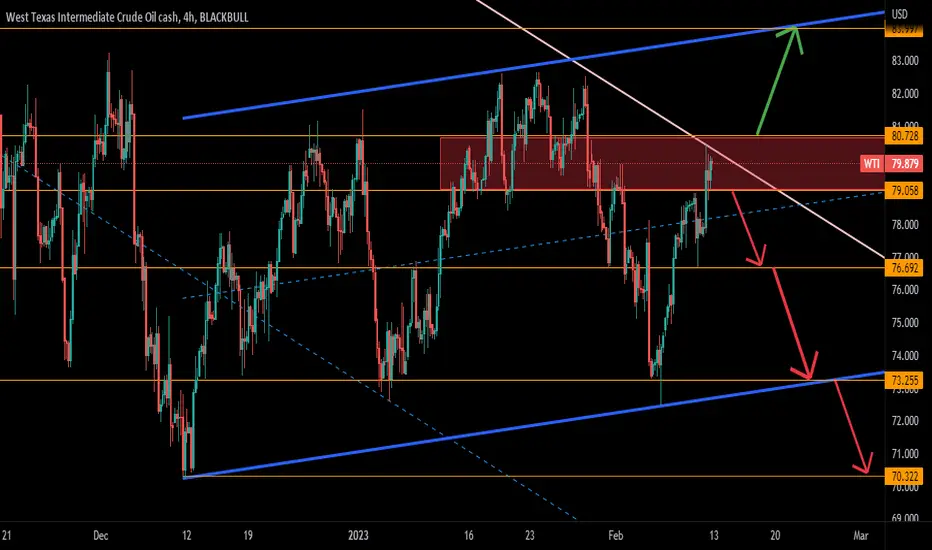
WTI update on the 4 hour chartOil analysis update
= The analysis is based on trend analysis and the Dow Laws
= The area from level 80.728 to level 79.058 is not suitable for trading and it is a dangerous area
= strong scenario
Exceeding the level 79.058 to the bottom, the targets are 76.692, then 73.255, then 70.322
= weak scenario
The level exceeded 80.728 to the top, targeting 83.997
Oil's long term re-test before upcoming rally? 13.2.2023Simple 1+1 equals 2.
There's a couple factors here.
1) Long-term support since March 2023 kept with multiple re-tests.
2) Long-term 8 month wedge consolidation with recent Jan 2023 breakout up together with RETEST of that breakout at 74.80-75.20 as of today.
If the week closes above this support, VERY high chance for continuation of breakout up and 80's-90's even 100 to be reached within coming weeks.
If the support of 74.80-75.20 breaks down, retest of long-term March 2021 to today support trend-line is possible at 71.40-60.
-------------------------------------------------------------------------------------------------------------------
I encourage to do your own research and trade with caution
Thank you for reading and would very much appreciate your comments and questions!
------------------------------------------------------------------------------------------------------------------

WTI......4hAnalysis of oil on the hourly chart ... Texas crude
= Crossed a downward price channel
= We have three selling goals
The first one started from the level of 75.317 and its target was = 73.192
The second is from level 73.192 and its target = 70.607
The third is from level 70,607 and its target = 68,810

WTI: Safety net 🧗Although the Oil might need a little persuasion, we're expecting the course to drop below the support line at $70.08 to continue with the downwards slope of the blue wave within the green target zone. Once completed, the blue wave should pump the course back up, before it ultimately hits the corrective low of the green wave .

Sure profits on USOIL!West Texas crude oil just broke its major resistance of double top neckline and now seems to be in a free fall action

Going short on West Texas Crude OilThe commodity just broke its major support trend line, additionally the formation of lower high and divergence support an upcoming bearish rally.

WTI short positionhidudes
west texas oil chart reached to supply zone for good short position
1:8 position

WTI: CRUDE OIL TREND OUTLOOKLet's look to Wti.
It moved up in the past weeks. But I think that trend is weakening and downside movement is possible soon.
Because, Crude Oil is reaching to strong level - 83.83!
What should we do in this case?
1. Place sell stop order at 81.52
2. First target is 76.98
3. Second target is 73.16
4. Stop Loss is necessary at 83.50
But if it will continue upward movement? Then, we need place buy stop order also:
1. Open buy stop at 83.65
2. Target is 86.98
3. Stop is 81.01
That's all for today. Let's wait and see what will be happen in next days.
Good luck!

WTI or USOIL (XTIUSD): BUY analysisWe can see WTI price jumped up as our prognosis here:
Now, what will be happen?
Price tested upper level on the chart and it will not stop here or it will continue its nonstop movement.
Hereby, WTI confirms own strenght. This is very gratifying occasion for us, because we love WTI trading.
So, today WTI broke up trend channel to upward. You will see on the chart. We need draw new channel for further explanation. OIL was moving between blue-green channel and it is entering to red trend channel. I marked these channels on the chart. It tries to create a new channel by choosing the correct entry point.
What is next level?
I think that, WTI will continue own movement until it reachs to 82.35. Because, this point is keypoint and strong level also. On the technical side, this is non-breaking level. But we think that this barrier can be broken, taking into account the volatility of the oil price (of course, if there is no strong fundamental or strategic news).
You can open a BUY operation by setting a stop loss. It is possible to set 82.30-82.35 as a target. Let's trade and see what will happen in the coming days.

WTI (CRUDE OIL) shortterm forecastHi dear traders.
WTI (Crude OIL) created nice trend channel started from 73.37. Upper border of the channel is 75.60.
Although, oil prices is moving between these prices from 16 December, as soon as it will jump to 77.55 level.
This is my private opinion and this is good opportunity for buyers.
Signal characteristics:
WTI will move down firstly, then possibly impulse here. Small impulse will reach to 76.29. Then will come retracement. It will retest 75.80-76.00 secondly.
As a resut, second impulse will take us to target.
Of course, we need entry, take profit and stop loss levesl for signal:
ENTRY: 75.62
TP 77.50
SL 74.25
Signal can reach our target during this week. Do not forget to put Stop Loss because trading without SL is gambling only. This will be non-professionalism.
Good luck and follow us ))

Selling West Texas Crude OilThe security shows continuation of it's bearish trend after a sharp bounce from its bearish trend line. Sellers can seek the opportunity to sell on the dip till the next respected trend-line support of 67.7.
(please note: the energy is formed a falling wedge pattern and might change its trend into bullish, so be mindful).

WTI Further downside risk? Commentary:
WTI crude: The sharpe sell-off on November 28th may have strengthened the case for further weakness in the short term (5-25 days), the November 28th opening at $76.60 and intra day low at $73.93 followed by a closing price which was below the previous day’s high (November 27th) could be confirmation for a resumption of the November 7th - November 28th downtrend. Current price is below the 20 and 50 day moving averages (bearish); MACD is below its signal line (bearish); multi-week lower tops and lower bottoms on price indicate a downtrend (dow pattern), therefore, short positions can be technically supported for a potential downside target near the $70 round number, provided price can remain below the $83.4 resistance.
Not investment advice. Past performance is not indicative of future results.

WTI BEARISH OUTLOOKCrude Oil benchmark WTI broke its previous established support at 81.75 and continued its downtrend through Wednesday after G7 talk for implementing a price cap on Russian supply. The mark cap of 65-70 USD per barrel was higher than the market expected, which elevate some of the fears of supply distribution of the oil. Another positive news for the global oil supply is that Chervon Corp. might expand operations in Venezuela.
Both MACD and RSI technical indicators are confirming the downtrend with MACD histogram below the 0 line and RSI below the 50 neutral line.
If the trend continues the price might try to reach levels of 73.65 or even 70.47 In the opposite scenario, the price might revert and test its resistance at 81.75
Risk Disclosure: Trading Foreign Exchange (Forex) and Contracts of Difference (CFD's) carries a high level of risk. By registering and signing up, any client affirms their understanding of their own personal accountability for all transactions performed within their account and recognizes the risks associated with trading on such markets and on such sites. Furthermore, one understands that the company carries zero influence over transactions, markets, and trading signals, therefore, cannot be held liable nor guarantee any profits or losses.
